
abstract
The sensory profile and acceptance of cookies enriched with medicinal herbs mixture “Vitalplant,” aimed at body weight regulation and metabolism enhancement, were evaluated. Seven cookies were prepared varying the content of powder and extract mixture (0, 2, 4, and 6 g/100 g flour basis, respectively). The descriptors used by an expert sensory panel (n = 8) that best separated samples were: appearance (shape, uniformity, surface, and color), texture (structure break, firmness, and chewiness), odor, and flavor. Preference mapping was assessed using multidimensional scaling on data obtained through an acceptability test (n = 64) with a 5-point hedonic scale. The hedonic responses showed significant differences (p < 0.05) between the cookies. The first three principal components captured 70.90% of the total variance, indicating the complex structure in consumer preference patterns. External preference mapping showed potential for predicting consumers overall acceptance of the cookies using five descriptive attributes that drove the preference of the six consumer clusters. The vector model was selected as the model of choice for most clusters. The addition of medicinal herbs in cookies is feasible, based on the sensory results, which may facilitate marketing of functional food with sensorial qualities equivalent to conventional products.
Introduction
Medicinal herbs that contain bioactive compounds with therapeutic properties have been widely studied and commercialized worldwide.[Citation1] The majority of these studies focus on organic compounds with diverse functions in the body. Given that their consumption is increasing, it is interesting to use these herbs as a supplement in food because these plants can present a significant source of biologically active substances including antioxidants, antimutagens, and anticarcinogens.[Citation2,Citation3] The antioxidant and antimicrobial activity of mixed ethanolic extracts of parsley, buckthorn, mint, caraway, was confirmed by previous studies.[Citation4–Citation6] With respect to the obtained results, the “Vitalplant” mixture was created using a selection of non-toxic medicinal plants with proven pharmacological action with the aim to stimulate metabolism and regulate body weight.[Citation7] It is composed of Rhamnus Frangula L. bark (35%), Petroselinum crispum (Mill.) A.W. Nym. ex Hill fruit (25%), Mentha x piperita L. leaves (20%), and Carum Carvi L. fruit (20%).[Citation7,Citation8] Moreover, “Vitalplant” plant mixture, in the form of powder and extract can be considered not only as functional, but also as sensory quality ingredient.
Cookies are widely consumed throughout the world and they represent the largest category of confectionary products.[Citation9] Development of new foodstuff by adding functional components to a carrier food, such as cookies, provides better marketing opportunities for food manufacturers.[Citation10] It is known that some carrier products, relative to the type of enrichment, may have an impact on consumers’ acceptance and willingness to try different functional foods. At the same time, the addition of functional components can contribute to deterioration of sensory quality and thereby reduce consumers’ preferences.[Citation11] Several authors[Citation12–Citation18] reported that consumers are hardly willing to compromise on the taste of functional foods for eventual health benefits. However, consumer preference responses are usually heterogeneous,[Citation19] and averaged consumer data may not be representative of any individual opinion. Thus, the awareness of inter-individual differences in preference behaviour gives rise to an increasing popularity of consumer segmentation.[Citation20] Although the human sensory system is quite sensitive, consumers often find it difficult to explain the slight differences between products.[Citation21] By integrating consumer response with the sensory data, more directional information may be acquired.[Citation22] For these reasons, preference mapping is a useful tool to accomplish integration between consumer responses and descriptive data. Information for each consumer individually is presented within a multidimensional space, representing the products evaluated.[Citation23] The internal preference mapping (IPM) is based on a principal component analysis (PCA) implemented on preference data with the products as observations, and the consumers as variables. The data ratings are given by the consumers for each product. This approach allows generating a map on which one can identify the consumers or groups of consumers’ preferences represented as vectors.[Citation24,Citation25] The external preference mapping (EPM) allows relating the preferences shown by the consumers to some sensory or physicochemical properties of the products. This approach is essential as it gives a reliable basis to the marketing and research and development teams for adapting or creating products that will correspond to the consumers’ expectations.[Citation23Citation25–Citation32] In order to recognize consumers acceptance of the cookies enriched with a digestion stimulating medical herbs mixture “Vitalplant,” three fields were explored with the aim to evaluate sensory profile, to identify the cookies related to preference, and to pinpoint external influences connected to the consumers perceptions of the cookies.
Materials and Methods
Materials
According to Pestorić et al.,[Citation33] seven cookie samples were prepared varying the content of powder and extract “Vitalplant” mixture used: 2, 4, and 6 g/100 g flour basis, respectively. The ingredients were weighed in the proportions listed in .
Table 1. Cookie formulations.
Preparation of Extracts and Cookies
As previously described by Šimurina et al.[Citation8] and Pestorić et al.,[Citation33] the baking trials were conducted under laboratory conditions in duplicates. The final cookie products can be seen in and .
Figure 1. Cookies made with different levels of “Vitalplant” powder: 0(C), 2 (P_2), 4 (P_4), 6 (P_6), g/100 g flour basis.
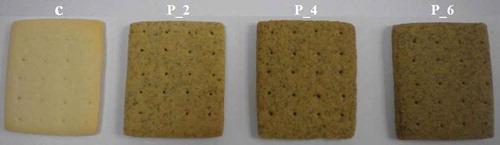
Figure 2. Cookies made with different levels of “Vitalplant” extract mixture: 0 (C), 2 (E_2), 4 (E_4), 6 (E_6), g/100 g flour basis.

Sensory Evaluation
Seven cookie samples were evaluated by a panel consisted eight assessors (seven females and one male, from the ages of 34–45) with necessary knowledge and experience in sensory descriptive analysis, which included techniques and practice in attribute identification and terminology development (University of Novi Sad, Institute of Food Technology, Serbia). Before evaluation, the panel went through three training sessions to select relevant sensory attributes. Each session lasted for 2 h and included various commercial cookies as well as some of the actual samples from the project. The panel developed a list of attributes and evaluated the samples using a 5-point method (). The score method was appropriate because the quality levels were precisely defined. The differences between scores were not too great, but they were high enough for the assessors to distinguish them. In order to obtain the overall quality, prior to sensory evaluation importance coefficients (ICs) for each sensory attribute were standardized and fixed by the experts. ICs were balanced that their sum equals to 5.0, similar to what has been described previously by other authors.[Citation34–Citation36] The obtained marks were multiplied by following: IC = 0.8 for appearance (AP); IC = 1.2 for structure, break and firmness (ST); IC = 1.0 for chewiness and other textural properties (CW); IC = 0.8 for odor (O); and IC = 1.2 for flavor (F). Two replicates of each test sample were conducted in sensory laboratories which fulfilled requirements of ISO 8589.[Citation37] A whole cookie sample was served in a plastic container with lid, coded with random three-digit numbers and presented individually to the assessors in a randomized order according to the XLSTAT software (Addinsoft, New York, NY). A 2 min rest period was provided between the evaluations of each sample. Warmish water was used for rinsing the palate.
Table 2. List of sensory attributes.
Consumer Test
Sixty-four consumers, who were selected from the staff of the Institute of Food Technology, participated in the acceptance test. Gender of participants was balanced, being 54% female and 46% male, and ages ranging from 18–60 years old. Consumers were selected on the basis of their availability for the evaluation, interest to participate in the research, absence of aversions, allergies or intolerances, normal perception abilities, and moderate preference toward this kind of product. The test was carried out 24 h and 48 h after baking trials in session between 10 am and 15 pm. Before rating, consumers were given a printed response sheet with instructions.
They rated the degree of liking on a modified version of the five point hedonic scale.[Citation38] The scale was anchored with (1) dislike extremely and (5) like extremely, and with a neutral center point of (3) neither like nor dislike. The cookie samples were served to consumers in an order which used a balanced design. Whole cookies were presented on the plates marked with a three-digit number. Warmish water was available for consumers to drink as they pleased.
Statistical Analysis
Analysis of variance (ANOVA) was conducted to assess significant differences between cookie batches in terms of sensory attributes, considering assessors, samples and their interaction. The mean intensities were then compared by Fisher’s least square difference multiple comparison test. A PCA was performed on the sensory data to provide further multivariate graphical presentation of the product space. In addition, a PCA of the correlation matrix of consumers (variables) by cookie products (objects) was carried out. To relate the data from the sensory and consumers’ data, the extended IPM was used.[Citation39] All statistical analyses were performed using XLSTAT version 2012.2.02 (Addinsoft, New York, NY; http://www.xlstat.com/), at 5% level of significance.
Results and Discussion
Sensory Evaluation of Cookies
The obtained results from the sensory evaluation are shown in . The samples presented statistical differences (p < 0.05) on most attributes, suggesting that the assessors were able to detect differences among them. Cookies prepared with different level of both enrichments evaluated significantly higher scores in comparison with the control sample (C). Moreover, cookies with all levels of extract enrichments rated with the highest scores for appearance and texture attributes. As pointed out earlier by Jones,[Citation40] appearance between the conventional confectionery products with different replacement or supplements is very important because it is one of the main sensory attributes which plays a role in sensory acceptance. In this study, appearance (AP) was evaluated, comprehensive with different levels of quality (shape, uniformity, surface, and color). Although it was easy to make the difference between samples in terms of color, the perceived appearance by the expert panel led to clear differences only between the control sample (C) and the samples E_4 and E_6. The same remark could be emphasized for the textural attributes. It was known earlier that the addition of sugar and fat mostly influences the texture changes, but many other ingredients even in small amounts, can cause these changes.[Citation41] With respect to chewiness (CW), the cookie P_4 was evaluated as the worst sample but with relatively higher values of scores (3.91). Considering there was no difference (p > 0.05) among all samples regarding attributes, except the sample P_6, it can be concluded that the addition of “Vitalplant” mixture either in the form of powder or extract at the applied levels did not exert a negative influence on the textural attributes of the cookie products.
Figure 3. Effect of “Vitalplant” mixture addition on the sensory attributes and consumers’ acceptance of the cookies (*Attribute: OA: overall acceptance, AP: appearance (shape, uniformity, surface), ST: (structure, break, firmness), CW: (chewiness and other textural properties), O: odor, F: flavor; columns marked with the same letter are not significantly different from each other (p < 0.05).
According to Pereira et al.,[Citation42] the evaluation of the odor and flavor intensity involves the perception which is related to raw materials and the amount of ingredients added in the manufacture process, being also more or less related to other effects, such as toasted, vegetable fat, cereal aromas. In this research, these attributes contributed greatly to the sensory profile of the cookies without producing a negative impact on the odor (O) and flavor (F).
In some cases, sensory evaluation by experts coincided with consumers’ expectations, while in others, consumer preferences are driven in different directions. The majority of researchers agreed[Citation43–Citation45] that the quality is a multi-dimensional concept and recognizes the importance of the products’ sensory attributes experienced by both experts and consumers. The hedonic responses showed significant differences (p < 0.05) between the tested samples. The mean value of the consumers’ acceptance was between 3.5 and 4.8. As shown in , the samples P_2 and E_4 were rated with the highest scores (3.30 and 3.33, respectively), contrary to samples C and E_2 (2.81 and 2.80, respectively). Despite the fact that consumers assigned the higher scores for the samples P_2 and E_4, it could be concluded that consumers were indifferent to these cookie samples. Moreover, it is noteworthy to say that the mean scores fall within the options slightly disliked, don’t like, nor dislike, and slightly liked indicating that the product showed potential to sensorial growth, just as it was the case with those obtained by Oliveira et al.[Citation1] This is in accordance with other studies in connection with the assessment of the wine[Citation46] or ham,[Citation47] in which the results showed that experts expressed a higher discriminating sensory ability than consumers. Consequently, it can also be concluded that consumers were likely to use different criteria of quality compared with experts in assessing the cookies.
In order to get a deeper insight and comprehension of both results, the results of both evaluations are shown in . The weighted mean value (WMV) of the expert panel scores for each evaluated attributes was calculated applying the ICs as a quantitative expression of the total product quality. Because of the experts were highly familiar with this type of product they evaluated the samples in terms of appearance (AP), texture (ST and CW), odor (O), and flavor (F; ). These attributes clearly drove overall quality as unacceptable (<2.5), good (2.5–3.5), very good (3.5–4.5), and excellent (>4.5). The applied score-based method showed that the best scores (>4.5-excellent quality) were obtained for all cookies enriched with “Vitalplant” extract mixture, except for odor and flavor.
Figure 4. Overall quality of the cookies analyzed by both panels.
Sensory Map
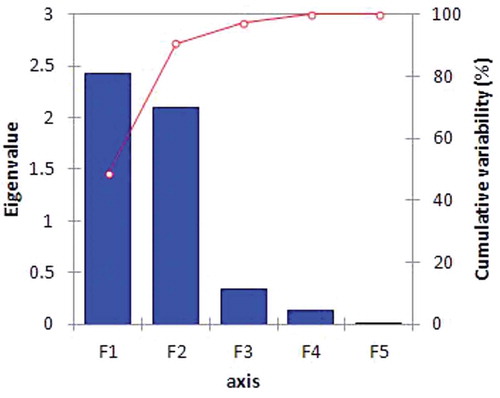
PCA was performed on the sensory data and the variables measured on the seven cookie samples could be summarized in two main orthogonal components, accounting for 90.47% of the total variance. In it can be noticed that the relative importance of the two main components can be assessed and the first two principal components accounted for 48.58 and 41.89% of the variance, respectively. The first component (F1) represented mainly the following variables: F, AP, and O, while the second (F2) basically represented textural variables (CW and ST), both in the positive range ().
Table 3. Contribution of each variable (%) to the different principal components (abbreviation cues are in ).
Figure 5. Scree plot of PCA.
The previously published results of the PCA[Citation48] on the cookie products showed both the relationships of the cookies to each other and the associations among the original descriptive attributes. The plot of the cookie products is offset from the plot of the attributes to aid the visual presentation while maintaining the relative directions and magnitudes. A good relationship between texture and chemical attributes of sensations was shown, and the second dimension was linked to the attributes ST and CW. The opposition between the cookie E_4 and E_6, on one hand, and the cookies E_2 and C, on the other hand, was due to the fact that the first ones were perceived primarily in relation to AP. The positioning of the cookie P_4 can be considered in terms of the chemical attributes (O and F), while the cookie P_6 can be only considered in relation to the textural attributes (ST and CW). One side of the first dimension of variability was likely to be more appreciated by almost all the cookies sample than the other side.
IPM
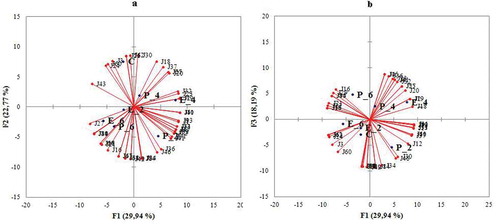
IPM was performed to visualize the behavior of distinct segments of consumers in such a way that each vector is associated with each consumer and represents increasing acceptance. In the PCA of the consumers’ data, the first three principal components captured 70.90% of the total variance (29.94, 22.77 and 18.19, respectively), indicating the complex structure in consumer preference patterns and the heterogeneity in consumers’ acceptance (). Consumers were distributed homogenously in all four quadrants along the components. F1 component separated consumers that preferred the cookies E_4 and P_2 from those that liked the cookies E_6 and P_6. From it can be noticed that F2 component separated consumers that were fonder of the conventional cookie sample C (control sample), while F3 component reflected familiarity with the cookies P_2 and P_6.
Figure 6. Biplot of consumers’ variables and cookie samples in the first three components (abbreviation cues are in ).
EPM
While IPM allows us to obtain a map of the samples, based on the consumers’ scoring patterns, it does not provide any information regarding sensory attributes of the products. Unlike IPM, EPM uses products’ sensory attributes as a base (PCA space) on which the mean scoring patterns are regressed on. As such, the mean consumer acceptance scores (cluster scores), for each cookie, are modeled as a function of the two main principal components (F1 and F2) using preference mapping (PREFMAP) regression statistical technique contained in XLSTAT software. The clustering of consumers (Agglomerative Hierarchical Clustering) was based on the Euclidian distance between the individual sets of acceptance scores.
summarizes the mean preference scores across all clusters for every product separately, while the grey cells represent the above mean scores within a column. The obtained contour plot () shows areas corresponding to predicted percentages of consumers’ overall acceptability (PREFMAP), with the cluster mean value as a threshold.
Table 4. Mean preference scores across consumer clusters
Figure 7. External preference mapping of the consumer clusters and cookies (abbreviation cues are in ).
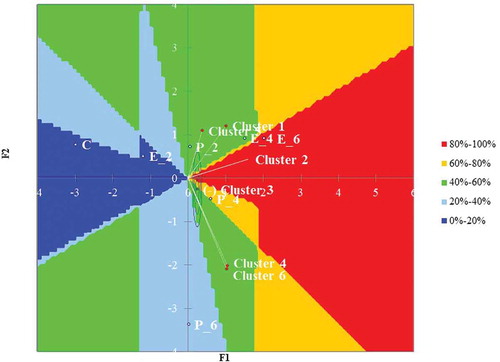
The PREFMAP results indicate that the vector model was selected as the model of choice for most clusters. Cluster 3 with was the only cluster where the quadratic model was used to explain/predict the preference scores. The vector models for clusters 1, 2 and 5 generated high p-values, which implies a poor explanatory power of these models for the associated cluster scores. Despite the evident lack of fit of the selected models for Clusters 1, 2, and 5, the overall obtained map () goes relatively well along with the raw data from for some products. E_4 and E_6 cookies were perceived as the samples with the highest relative preference scores across clusters. Samples C and E_2 are on the opposite side of the plot (cold dark region), which is also reflected in . Cookie P_6 was the most different sample from the sensorial point-of-view. Its different sensory profile provided no a clear ascendant or descendent pattern of preference scores for most consumer clusters. It was also the main reason why the vector models not fitted well the data (cluster 1, 2, and 5). Clusters 2 and 6 showed a clear preference for the cookie P_6. Their vector models, while still not being statistically significant (5%), had a p-value approaching 0.2. The cookie P4 predicted mean score was not well represented in . It was positioned in a relatively warm area of the plot, where predicted success rate (percentage of cluster mean scores above their own mean score) was between 60–80%, while the actual obtained cluster mean score ratio was less than 20%. Due to poor fit of the vector models the obtained contour plot should not be over-interpreted.
Conclusions
Both applied mixture enhancements, in the form of powder and extract, can be used without adversely affecting the sensory profile of the cookies. In addition, quantitative descriptive analysis separated seven cookie samples by their sensory attributes which may be successfully used for future sensory studies on cookies. The cookies developed in this study presented good acceptance among consumers and possibilities of sensorial growth as well. The combination of cluster analysis and IPM led to a deeper understanding of consumer liking for enriched cookies. The samples differed in their average acceptance scores. An interpretation of the cluster analysis alone, led to the identification of six groups of consumers, and provided a more complex picture than was actually necessary. EPM showed potential for predicting consumers overall acceptance of the enriched cookies using five descriptive attributes which drove the preference of some of the six consumer clusters. Cookies developed with addition of “Vitalplant” herbal mixture provide new market opportunities. The findings of this research could be applied by the biscuit industry in developing novel formulations of enriched cookies able to better meet consumer requirements. The relative weighting given by consumers to the choice of these products, particularly with special health, where confectionery consumption may be higher, would also merit investigation.
Funding
This work is a part of the Project (grant number TR31029) supported by the Ministry of Education, Science and Technological Development, Republic of Serbia, and the Project (grant number 114-451-4382) supported by the Provincial Secretariat for Science and Technological Development, Autonomous Province of Vojvodina, Republic of Serbia.
Additional information
Funding
References
- Oliveira, K.E.D.; Takase, I.; Gonçalves, É.C.B.D.A. Development of Gluten-Free Cookie from Medicinal Plants (Guaraná-Paullinea Cupana and Catuaba-Anemopaegma Mirandum) Aiming at Copper, Iron, and Zinc Supplementation. Food Science and Technology (Campinas) 2009, 29, 631–635.
- Dillard, C.J.; German, J.B. Phytochemicals: Nutraceuticals and Human Health. Journal of the Science of Food and Agriculture 2000, 80, 1744–1756.
- Sharma, V.J.; Patel P.M. Evaluation of Antibacterial Activity of Methanolic Extract of Plant Rivea Ornata. International Research Journal of Pharmacy 2013, 4, 233–234.
- Mišan, A.; Mimica-Dukić, N.; Mandić, A.; Sakač, M.; Milovanović, I.; Sedej, I. Development of a Rapid Resolution HPLC Method for the Separation and Determination of 17 Phenolic Compounds in Crude Plant Extracts. Central European Journal of Chemistry 2011, 9, 133–142.
- Mišan, A.; Mimica‐Dukić, N.; Sakač, M.; Mandić, A.; Sedej, I.; Šimurina, O.; Tumbas, V. Antioxidant Activity of Medicinal Plant Extracts in Cookies. Journal of Food Science 2011, 76, C1239–C1244.
- Šarić, L.J.; Čabarkapa, I.; Beljkaš, B.; Aleksandra, M.; Sakač, M.; Plavšić, D. Antimicrobial Activity of Plant Extracts from Serbia. Food Processing, Quality, and Safety 2009, 36, 1–6.
- Đurendić Brenesel, M.; Pilija, V.; Popović, T.; Arsić, A.; Milić, M.; Kojić, D.; Milić, N.; Mišan, A. Antihyperlipidemic, antioxidant, and weightlowering effects of “Vitalplant.” Open Life Sciences 2015, 10, 291-298.
- Šimurina, O.; Filipčev, B.; Psodorov, Đ.; Sakač, M.; Bodroža-Solarov, M.; Pestorić, M.; Novaković, B. Bread Supplemented with Herbal Blend VITALPLANT®. Food Processing, Quality, and Safety 2008, 35, 113–117.
- Lorenz, K. Protein Fortification of Biscuits. Cereal Foods World 1983, 28, 449–452.
- Krutulyte, R.; Grunert, K.G.; Scolderer, J.; Lähteenmaäki, L.; Hagemann, K.S.; Elgaard, P.; Neilsen, B.; Graverholt, J.P. Perceived Fit of Different Combinations of Carriers and Functional Ingredients and Its Effect on Purchase Intention. Food Quality and Preference 2011, 22, 11–16.
- Glanz, K.; Basil, M.; Maibach, E.; Goldberg, J.; Snyder, D. Why Americans Eat What They Do: Taste, Nutrition, Cost, Convenience, and Weight Control Concerns as Influences on Food Consumption. Journal of the American Dietetic Association 1998, 98, 1118–1126.
- Westenhoefer, J.; Pudel, V. Pleasure from Food: Importance for Food Choice and Consequence of Deliberate Restriction. Appetite 1993, 20, 246–249.
- Drewnowski, A.; Gómez-Carneros, C. Bitter Taste, Phytonutrients, and the Consumer: A Review. American Journal of Clinical Nutrition 2000, 72, 1424–1435.
- Wennström, P. Functional Foods and the Consumer’s Perception of Health Claims. Scandinavian Journal of Nutrition 2000, 44, 30–33.
- Tuorila, H.; Cardello, A.V. Consumer Responses to an off-Flavor in Juice in the Presence of Specific Health Claims. Food Quality and Preference 2002, 13, 561–569.
- Augustin, M. Functional Foods: An Adventure in Food Formulation. Food Australia 2003, 53, 428–432.
- Verbeke, W. Functional Foods: Consumer Willingness to Compromise on Taste for Health? Food Quality and Preference 2006, 17, 126–131.
- Ares, G.; Giménez, A.; Gámbaro, A. Does Information About the Source of Functional Ingredients Influence Consumer Perception of Functional Milk Desserts? Journal of the Science of Food and Agriculture 2008, 88, 2061–2068.
- Moskowitz, H.R.; Krieger, R.B. The Contribution of Sensory Liking to Overall Liking: an Analysis of Six Food Categories. Food Quality and Preference 1995, 6, 83–90.
- Ares, G.; Giménez, A.; Gámbaro, A. Preference Mapping of Texture Of Dulce de Leche. Journal of Sensory Studies 2006, 21, 553–571.
- Steenkamp, J.E.M.; Van Trijp, H.C.M.; Berge, J.M.F. Perceptual Mapping Based on Idiosyneratic Sets of Attributes. Journal of Marketing Research 1994, 31, 15–27.
- Elmore, J.R.; Heymann, H.; Johnson, J.; Hewitte, J.E. Preference Mapping: Relating Acceptance of Creaminess to a Descriptive Sensory Map of a Semi-Solid. Food Quality and Preference 1999, 10, 465–475.
- McEwan, J.A.; Earthy, P.J.; Ducher, C. Preference Mapping: A Review. (Review No. 6. Project No. 29742); Campden & Chorleywood Food Research Association: Gloucestershire, UK, 1998.
- Schlich, P. Preference Mapping: Relating Consumer Preferences to Sensory or Instrumental Measurements. In Bioflavour’95. Analysis/Precursor Studies/Biotechnology; Etiévant, P.; Schreier, P., Eds.; INRA Editions: Versailles, France, 1995; 231–245.
- Delgado, C.; Guinard, J.-X. Internal and External Quality Mapping as a New Approach to the Evaluation of Sensory Quality: A Case Study with Olive Oil. Journal of Sensory Studies 2012, 27, 332–343.
- MacFie, H.J.; Bratchell, N.; Greenhoff, K.; Vallis, L.V. Designs to Balance the Effect of Order of Presentation and First-Order Carry-Over Effects in Hall Tests. Journal of Sensory Studies 1989, 4, 129–148.
- Earthy, P.J.; MacFie, H.J.H.; Hedderley, D. Effect of Question Order on Sensory Perception and Preference in Central Location Trials. Journal of Sensory Studies 1997, 12, 215–237.
- Martínez, C.; Santa Cruz, M.J.; Hough, G.; Vega, M.J. Preference Mapping of Cracker Type Biscuits. Food Quality and Preference 2002, 13, 535–544.
- Thompson, J.L.; Drake, M.A.; Lopetcharat, K.; Yates, M.D. Preference Mapping of Commercial Chocolate Milks. Journal of Food Science 2004, 69, 406–413.
- Geel, L.; Kinnear, M.; de Kock, H.L. Relating Consumer Preferences to Sensory Attributes of Instant Coffee. Food Quality and Preference 2005, 16, 237–244.
- Caspia, E.L.; Coggins, P.C.; Schilling, M.W.; Yoon, Y.; White, C.H. The Relationship Between Consumer Acceptability and Descriptive Sensory Attributes in Cheddar Cheese. Journal of Sensory Studies 2006, 21, 112–127.
- Gámbaro, A.; Ares, G.; Giménez, A.; Pahor, S. Preference Mapping of Color of Uruguayan Honeys. Journal of Sensory Studies 2007, 22, 507–519.
- Pestorić, M.; Mišan, A.; Šimurina, O.; Jambrec, D.; Belović, M.; Gubić, J.; Nedeljković, N. Sensory and Instrumental Properties of Cookies Enriched with “Vitalplant”—Extract. Agro Food Industry Hi Tech 2014, 25, 19–22.
- Sikora, M.; Kowalski, S.; Krystyjan, M.; Krawontka, J.; Sady, M. Optimization of Corn Starch/Xanthan Gum Content for Thickening of Cocoa Syrups. Journal of Food Quality 2007, 30, 682–702.
- Pajin, B. Practicum in Technology of Confectionery Products; Faculty of Technology: Novi Sad, Serbia, 2009.
- Sedej, I.; Sakač, M.; Mandić, A.; Mišan, A.; Pestorić, M.; Šimurina, O.; Čanadanović-Brunet J. Quality Assessment of Gluten-Free Crackers Based on Buckwheat Flour. LWT–Food Science and Technology 2011, 44, 694–699.
- ISO 8589. General Guidance for the Design of Test Rooms; The International Organization for Standardization: Geneva, Switzerland, 2007.
- ISO 4121. Sensory Analysis—Guidelines for the Use of Quantitative Response Scales; The International Organization for Standardization: Geneva, Switzerland, 2003.
- McEwan, J.A. Preference Mapping for Product Optimization. In Multivariate Analysis of Data in Sensory Science; Naes, T.; Risvik, E.; Eds.; Elsevier: Amsterdam, The Netherlands, 1996; 71–80.
- Jones, S.A. Issues in Fat Replacement. In Handbook of Fat Replacers; Roller, S.; Jones, S.A.; Eds.; CRC Press: Boca Raton, FL, 1996; 3–26.
- Zoulias, E.I.; Oreopoulou, V.; Tzia, C. Textural Properties of Low-Fat Cookies Containing Carbohydrate- or Protein-Based Fat Replacers. Journal of Food Engineering 2002, 55, 337–342.
- Pereira, R.B.; Bennett, R.J.; Luckman, M.S. Instrumental and Sensory Evaluation of Textural Attributes in Cheese Analogs: A Correlation Study. Journal of Sensory Studies 2005, 20, 434–453.
- Guinard, J.X.; Brun, P. Sensory-Specific Satiety: Comparison of Taste and Texture Effects. Appetite 1998, 31, 141–157.
- Cliff, M.A.; King, M. Use of Principal Component Analysis for the Evaluation of Judge Performance at Wine Competitions. Journal of Wine Research 1999, 10, 25–32.
- Gawel, R.; Godden, P.W. Evaluation of the Consistency of Wine Quality Assessments from Expert Wine Tasters. Australian Journal of Grape and Wine Research 2008, 14, 1–8.
- Ballester, J.; Patris, B.; Symoneaux, R.; Valentin, D. Conceptual Versus Perceptual Wine Spaces: Does Expertise Matter? Food Quality and Preference 2008, 19, 267–276.
- Resano, H.; Sanjuán, A.I.; Cilla, I.; Roncalés, P.; Albisu, L.M. Sensory Attributes That Drive Consumer Acceptability of Dry-Cured Ham and Convergence with Trained Sensory Data. Meat Science 2010, 84, 344–351.
- Pestorić, M.; Šimurina, O.; Filipčev, B.; Jambrec, D.; Belović, M.; Mišan, A.; Nedeljković, N. Relationship of Physicochemical Characteristics with Sensory Profile of Cookies Enriched with Medicinal Herbs. International Journal of Food Properties 2015, 18, 2699–2712.