
ABSTRACT
In this study, aqueous extraction of phenolic compounds from jamun (Syzygium cumini L.) seed was undertaken. The effects of various parameters such as extraction temperature (34.8–85.2°C), extraction time (49.8–100.2 min), and liquid-to-solid ratio (9.8–60.2 mL/g) on the extraction yield, extract purity (i.e., total polyphenol content), and its antioxidant activities (1,1-diphenyl-2-picrlthydrazyl free radical scavenging assay and ferric reducing antioxidant power) were investigated. Response surface methodology was used to optimize the extraction conditions. The optimum extraction conditions (49.2°C, 89.4 min, and 51.6:1 mL/g) produced an extract with 17.3% extraction yield, high total polyphenol content (415 mg gallic acid equivalent/g dried extract) and significant antioxidant activity (IC50: 35.4 ± 0.7 µg/mL). The high-performance liquid chromatography analysis of seed extract revealed the presence of gallic acid (90.8 mg/g dried extract), ellagic acid (36 mg/g dried extract), caffeic acid (26.07 mg/g dried extract), p-coumaric acid (0.26 mg/g dried extract), catechin (9.05 mg/g dried extract), epicatechin (0.42 mg/g dried extract), and quercetin (1.54 mg/g dried extract). Tannic acid (188.5 mg/g dried extract) was also identified as a major phenolic compound. The extraction kinetics was also studied and experimental data were fitted to four kinetic models such as first-order model, second-order model, Peleg’s model, and Minchev and Minkov model, to evaluate their applicability.
Introduction
Jamun (Syzygium cumini L.) is an important tropical and subtropical evergreen plant of the Myrtaceae family. These trees are also found to grow in many parts of the world such as Bangladesh, Pakistan, Philippines, West Indies, Eastern Africa, South America, etc. This fruit is of Indian origin, commonly known as Jambul, Black Plum, Java Plum, Indian Blackberry, Jamblang, etc. India is the second largest producer of this fruit in the world.[Citation1] The domestic and industrial use of these large quantities of jamun fruits, especially for the production of juice and wine, results in the accumulation of large amount of by-products such as seed which represent a serious disposal problem.[Citation1] So far, some part of them are used as a cattle feed due to their high fiber content.[Citation2] Jamun seed accounts about 20% of the fruit weight, which can be a good and cheap source of polyphenols having antioxidant capacity. Jamun seeds are traditionally used in Ayurveda medicine due to their medicinal properties such as anti-bacterial, anti-diabetic, anti-inflammatory effects, etc.[Citation3] Previous studies have revealed that the seed contains various polyphenols such as ellagitannins, gallic acid, ellagic acid, etc., and phytosterol such as β-sitosterol.[Citation3,Citation4] Jamun seed extract seems to be an inexpensive source of natural antioxidants that can be used as dietary antioxidant supplement in food and bioactive substances in the cosmetics and pharmaceutical industries. Antioxidants, both in natural and synthetic forms, are able to scavenge free radicals and inhibit oxidation processes in the human body. The most widely used synthetic antioxidants, such as butylated hydroxyl anisole (BHA), butylated hydroxyl toluene (BHT), and propylgallate (PG), etc., have restricted use in food and have been suspected of being responsible for liver damage and carcinogenesis.[Citation5] Indeed, in recent years, a lot of research has focused on plants and their by-products to extract natural and low-cost antioxidants that can replace the harmful synthetic additives.[Citation6–Citation11] Different techniques have been applied to recover antioxidant phenolic compounds from plant materials or waste products of food industry including solid–liquid extraction with organic solvents,[Citation7] ultrasound-assisted extraction,[Citation8] microwave assisted extraction,[Citation9] supercritical fluid extraction,[Citation10] and high-pressure processes.[Citation11] Among these techniques, solid–liquid extraction using organic solvents is a common operation applied in many industrial processes. Solvents such as methanol, acetone, ethyl acetate, diethyl ether, and their combinations, often with different proportions of water are widely used. Even though some solvents are cheap and easily accessible, their extracts may contain residual solvents which are considered unsafe for food products. Removal of traces of solvents from the final product is also a big challenge. In this regard, ethanol is commonly used in antioxidant extraction because it is a generally recognized-as-safe (GRAS) solvent.[Citation12] However, ethanol shows residual flavor and its use could be limited in foodstuffs. Water being non-toxic, environmentally safe, and inexpensive, it does not have limitations on its use.[Citation13] Several investigators have successfully demonstrated the use of water as an extracting medium to extract the phenolic compounds from plants and their by-products.[Citation14–Citation17] During extraction of phenolic compounds, polysaccharides (cellulose, pectins, etc.) are also co-extracted leading to decrease in purity of the phenolic extract. Very few studies with limited information are available on antioxidant potential of jamun seed. Hence, the present study was undertaken to investigate the potential of extracting polyphenolic antioxidants from jamun seed, using water as solvent.
The extraction process is influenced by a number of process variables including extraction temperature, extraction time, and liquid-to-solid ratio. Response surface methodology (RSM) is an efficient statistical and mathematical technique, which has been successfully used by several researchers for optimization of process parameters in many applications such as clarification of juice,[Citation18,Citation19] and extraction of different bioactive compounds from plant: steviosides from stevia leaves,[Citation20] polyphenols from Quercus bark,[Citation21] and Myrtus communis L. leaves,[Citation22] etc. To the best of our knowledge, no optimization study has been reported for water extraction of phenolic compounds from jamun seeds. Furthermore, for scale up of any extraction system, the extraction mechanism should be properly understood. The most common way to study it is to analyze the extraction behavior with time. Therefore, knowledge of the appropriate kinetic model and determination of kinetic parameters are warranted to have an efficient design and subsequent scale up for extraction of phenolic compounds from seed extract. Various kinetic equations have been proposed to model extraction of phenolic compounds from plant material. These include first-order model,[Citation8] pseudo first-order model,[Citation23] second-order model,[Citation24] Peleg’s model,[Citation25] model proposed by Minchev and Minkov,[Citation26] Weibull-type model,[Citation27] etc. However, no information is available in literature about the kinetics of water extraction of polyphenols from jamun seed.
The main objectives of the present work were (1) to investigate the effects of various parameters (extraction temperature, extraction time and liquid-to-solid ratio), and to apply the RSM approach in order to optimize these conditions to obtain the aqueous extract of jamun seeds with the maximum extraction yield, maximum purity, and antioxidant activity, (2) to identify and quantify the individual phenolic compounds in the optimally obtained jamun seed extract. This work was also aimed to investigate the kinetics of the extraction process and to evaluate the applicability of most commonly used kinetic models reported in literature.
Material and Methods
Plant Materials and Chemicals
Dry jamun seed powder was purchased from M/s. Shree Enterprises, Maharashtra, India. Distilled water was used as the solvent for the extraction process. The chemicals, 1,1-diphenyl-2-picrlthydrazyl (DPPH), 2,4,6-tripyridyl-s-triazine (TPTZ), Folin–Ciocalteu phenol reagent, (+)-catechin hydrate (≥95%), (-)-epicatechin (≥90%), caffeic acid (≥98%), p-coumaric acid (≥98%), ellagic acid (≥95%), quercetin (≥95%), triethanolamine, and tannic acid were purchased from Sigma–Aldrich Chemical Co. (St. Louis, MO). Bovine serum albumin (BSA), gallic acid, ascorbic acid, glacial acetic acid, sodium acetate trihydrate, BHT, potassium acetate, methanol, ferrous sulphate, sodium hydroxide, sodium chloride, ferric chloride, sodium dodecyl sulfate (SDS), aluminium chloride, and potassium acetate were obtained from Sisco Research Laboratories (SRL Pvt. Ltd., India). All other chemicals used were of analytical grade.
Experimental Design
In the present study, RSM was used to determine the optimal extraction conditions. A full factorial central composite design with a quadratic model[Citation28] was employed to study the combined effect of three independent variables, i.e., extraction temperature (X1, °C); extraction time (X2, min); liquid-to-solid ratio (X3, mL/g) on the four response functions such as extraction yield (Y1, %), extract purity (Y2, %), and the antioxidant capacity measured by DPPH free radical scavenging activity (Y3, % inhibition) and ferric reducing antioxidant power (FRAP; Y4, μmol Fe (II)/L). The independent variables were considered with five levels and two star points for each of them. A total of 20 randomized experiments, including six replicates as the center points were required for this procedure. The experimental design and statistical analysis of the data were carried out using “Design Expert” software (Version 8.0.6, Stat-Ease, Inc., Minneapolis, USA). The statistical combination of design variables with values of four response variables under different operating conditions were presented in . The quadratic model for each response variable can be written as,
Table 1. Statistical combination of design variables with response variables under different operating conditions.
where Y is the dependent variable and the coefficient of the polynomial are represented by β0 (constant or offset term); β1, β2, and β3 (linear effects); β11, β22, and β33 (quadratic effects); β12, β13, and β23 (interaction effects). The terms X1, X2, and X3 are the independent variables. The term ε allows for uncertainties or discrepancies between predicted and measured values of response and stands for residual.[Citation29] The regression coefficients were then used to make statistical calculation. The fitted quadratic models were expressed as surface plots in order to visualize the relationship between the response variables and independent variables. Feasible optimal values of design variables inside the valid region were obtained by analyzing the response surface plots with the aid of the software.
Extraction and Extract Characterization
Extraction
Extraction was carried out in a simple laboratory Quickfit apparatus under stirring with a Teflon-coated magnetic stirrer, at 700 RPM, for predetermined temperature and time. The apparatus consisted of a 1 L distillation flask and a condenser. After the selected temperature was attained, the appropriate amount of dried seed powder of jamun was mixed with required volume of distilled water taken in the distillation flask and predefined extraction time started. At the end of extraction, the extract was cooled to room temperature (25 ± 1°C), and then extract was filtered through Whatman No. 1 filter paper (Whatman International Ltd., England). Then the extract was used for estimation of extraction yield, extract purity and antioxidant activities through various chemical assays. Extraction yield and extract purity are defined as,
For kinetic study, extractions were carried out at different liquid-to-solid ratios (9.8:1, 35:1, and 60.2:1 mL/g) and temperatures (34.8, 60, and 85ºC). For determination of extraction kinetics, the samples were collected (5 mL) at preset times (4, 6, 8, 10, 14, 20, 35, 55, 80, 90, 120 min) replacing the extract volume with distilled water. The obtained extracts were filtered through Whatman No. 1 filter paper prior to estimation of total polyphenol content (TPC) and total solids (TS). All the experiments were carried out in triplicate.
Physico-Chemical Parameters Determination
Color was measured by absorbance at 420 nm and clarity by transmittance at 660 nm using U-2900, UV/VIS Spectrophotometer (Hitachi, Japan). The pH value was measured by a pH Meter (Mettler Toledo, AG-8603, Switzerland). For titratable acidity measurement, aqueous extract sample was titrated with 0.1 N NaOH to pH 8.3 and expressed as percentage of malic acid equivalent. Viscosity and conductivity of the aqueous extracts were measured at 25 ± 1°C by Ostwald Viscometer and autoranging conductivity meter (Chemiline, CL-220, India), respectively. The TS content of the sample was measured gravimetrically by heating the aqueous extract in a hot air oven at 70 ± 1°C for 16 h[Citation30] and used for calculation of extraction yield and extract purity. The content of pectinious materials present in the extracts was measured in terms of alcohol-insoluble-solids (AIS). AIS was determined by boiling 5 mL aqueous extract with 150 mL 80% ethanol, simmering for 30 min, and filtering through Whatman No. 1 filter paper. The filtered residue was washed with 80% ethanol. The residue was dried at 100°C for 2 h and expressed in mg per gram of dried extract (DE).[Citation31] For all analysis, measurements were done in triplicate and results were presented as mean ± standard deviation.
Determination of TPC
TPC in the aqueous extract was measured using a modified Folin and Ciocalteu method[Citation32,Citation33] based on colorimetric oxidation/reduction reaction. Folin–Ciocalteu reagent was used as an oxidizing agent. Briefly, 0.5 mL of 10-fold diluted extract was mixed with 0.5 mL of the Folin–Ciocalteu reagent in a 25 mL flask. The solutions were mixed thoroughly and incubated at room temperature (25 ± 1°C) for 3 min. After incubation, 10 mL sodium carbonate (7.5 wt%) solution was added and mixed well. The volume was then made up to 25 mL with distilled water and kept at room temperature for 60 min. The absorbance was then measured at 750 nm using a ultraviolet (UV) spectrophotometer. Then the absorbance value was compared with a gallic acid standard curve (50 to 500 µg/mL) for estimation of concentration of TPC in the extract and result was expressed as mg of gallic acid equivalents (GAE) per gram of DE.
Determination of Total Flavonoid Contents (TFC)
The amount of flavonoid content in the extract was determined using aluminium chloride colorimetric method.[Citation34] The reaction mixture consisted of 1.0 mL of 10-fold diluted extract, 1.0 mL methanol, 0.5 mL of (1.2 wt%) aluminium chloride and 0.5 mL (120 mM) potassium acetate and incubated at room temperature (25 ± 1°C) for 30 min. The absorbance of the sample was measured at 415 nm using a UV spectrophotometer and compared to a quercetin standard curve for concentration of TFC in the samples. Five different concentrations of quercetin solutions (12.5 to 100 µg/mL) were used for calibrations. The results were expressed in mg quercetin per gram of DE.
Determination of Tannic Acid
Estimation of the tannic acid in seed extract was performed using protein precipitation method[Citation35] based upon the colorimetric method. Briefly, 1 mL seed extract was mixed with 3 mL of BSA solution (0.1 wt% BSA in 0.20 M acetate buffer at pH 5.0 containing 0.17 M NaCl). Then the mixture was incubated for 15 min at room temperature (25 ± 1°C) followed by centrifugation at 5000 RPM for 10 min. After discarding supernatant, 3 mL SDS/triethanolamine solution (1.0 wt% SDS and 5% v/v triethanolamine in distilled water) was used to dissolve the precipitate. Then 1 mL of ferric chloride reagent (0.01 M ferric chloride in 0.01 N HCl) was added to it. The reaction mixture was kept for 15 min at room temperature and its absorbance was measured at 530 nm by UV spectrophotometer against water as a blank. Six different concentrations of standard tannic acid solution (100 to 1000 µg/mL) were used for the calibration. Results were expressed in mg tannic acid per gram of DE.
Determination of Antioxidant Activities
The antioxidant capacity of seed extract was determined by two methods, DPPH free radical-scavenging activity and FRAP assay. The free radical scavenging activity of jamun seed extract was measured by using 2, 2-diphenyl-1-picrylhydrazyl (DPPH) by the modified method of Mc Cune and Johns 2002.[Citation36] In the DPPH test, the reaction mixture consisted of an aliquot of 1 mL methanolic solution of DE with a concentration of 50 μg/mL, 1.0 mL of DPPH (0.3 mM), and 1.0 mL of methanol, was incubated for 10 minutes in dark at 37 ± 1°C, after incubation the absorbance of the mixture was measured at 517 nm using a UV spectrophotometer using methanol as a blank. Ascorbic acid and BHT was used as positive control. Percentage of inhibition was calculated using the following formula:
where B was the absorbance of blank (DPPH and methanol); A was the absorbance of extract sample (DPPH, methanol and sample). The IC50 value was calculated from the linear regression of the % inhibition curves obtained for varying concentrations of DE. The antioxidant activity was inversely proportional to IC50 values.
FRAP assay measured the ability of the antioxidants in the extract which was based on the reduction of ferric-tripiridyl-triazine complex [Fe+3-TPTZ] to the ferrous form [Fe+2-TPTZ] at an acidic condition. [Fe+2-TPTZ] was an intense blue color complex with a maximum absorption at 593 nm.[Citation37] The FRAP reagent was prepared by mixing 2.5 mL of TPTZ (10 mM in 40 mM hydrochloric acid), 2.5 mL of ferric chloride (20 mM) and 25 mL of sodium acetate buffer (300 mM, pH 3.6). An aliquot of 5 mL aqueous solution of DE with a concentration of 100 μg/mL was mixed with 4.5 mL of FRAP reagent. The absorbance was measured after 4 min of incubation in the dark at room temperature (25 ± 1°C) at 593 nm by UV spectrophotometer using water as a blank. The absorbance was then compared with a calibration curve of aqueous solution of ferrous sulphate (FeSO4.7H2O; 25–800 µmol/L). The FRAP values were expressed in μmol Fe(II)/L.
High-Performance Liquid Chromatography (HPLC) Analysis
The phenolic compounds (phenolic acids and flavonoids) present in the extract were identified and quantified using a HPLC (Perkin Elmer 200 series, USA) equipped with a ABI 785 detector and a column C18 (Atlantis T3) column (150 mm × 4.6 mm). Solvent A (water with 0.1% H3PO4) and solvent B (acetonitrile) were used as the mobile phases. A linear gradient system started with 5% B, increasing to 30% in 20 min and back to 5% at 30 min. The solvent gradient in volume ratios were as follows: 0–20 min, 5–30% B; 20–22 min, 30–15% B; 22–24 min, 15–10% B; 24–26 min, 10% B; 26–28 min, 10–5% B; 28–30 min, 5%B. The phenolic compounds were quantified using calibration curves constructed with the external standards. Standard stock solutions were freshly prepared at a concentration of 100 µg/mL. Standard solutions, containing gallic acid, ellagic acid, caffeic acid, p-coumeric acid, catechin, epicatechin, quercetin were mixed together (0.5–50 µg/mL) and injected into the column. For all analysis the column was maintained at a constant temperature of (25 ± 1°C) and absorbance was measured at a wavelength of 280 nm. All samples were filtered using 0.22 µm cellulose acetate filters before injection into the column with an injection volume of 20 µL and at a flow rate of 1 mL/min.
Results and Discussion
Statistical Analysis
The analysis of variance (ANOVA) tests of significance of the regression models for the four responses were evaluated to see the effect of individual linear, quadratic, and interaction term.[Citation28] The significances of all terms in the polynomial were judged statistically using the F-test and p-value. The corresponding variables would be more significant if the absolute F-value becomes greater and the p-value becomes smaller.[Citation38] Values of p < 0.05 indicated that model terms were significant. The ANOVA of responses Y1, Y2, Y3, and Y4 showed that the model F values of 10.31, 12.29, 14.17, and 14.01, respectively, were highly significant (p < 0.0001), i.e., there was only a 0.01% chance that this error was caused by noise implying a very high significance of the regression model. The suitability of the above proposed correlation was determined by analyzing the coefficient of determination value of the fit. It was a statistic measure of how well the polynomial function (Eq. 1) approximated the actual data points. The values of coefficient of determination (R2) of responses Y1, Y2, Y3, and Y4 were found to be 0.903, 0.917, 0.927, and 0.926, respectively. These indicated that the regression models explained more than 90% of the variability of response variables. The adjusted determination coefficient (Adj. R2) of responses Y1, Y2, Y3, and Y4 were found to be 0.815, 0.842, 0.861, and 0.860, respectively. The smaller values of coefficient of variation (CV) indicated high degree of precision and a great deal of reliability of the experimental data. The CV of responses Y1, Y2, Y3, and Y4 were found to be 5.1, 5.82, 9.07, and 6.88%, respectively. The obtained CV of this study was less than 10% and showed the reproducible nature. Also, adequate precision value was obtained as greater than four demonstrating a significant and intense correlation between the observed and predicted values. The relationship between responses and the three tested variables were presented in the following equations (Eqs. (2)–(5)):
A negative sign in the above equations indicated an antagonistic effect of the variables and a positive sign represented a synergistic effect of the variables.
Effect of Process Variables on the Extraction Yield
The statistical analysis data revealed that the extraction yield was significantly affected (p < 0.001) by linear and quadratic terms of liquid–to-solid ratio. The quadratic term of extraction time was significant at p < 0.01, whereas the interaction effect of extraction time and extraction temperature was found to be significant at p < 0.05. and illustrated the effects of extraction temperature, time, and liquid-to-solid ratio on extraction yield. As shown in these figures, an increase of the liquid volume in the system enhanced the extraction yield leading to a more efficient extraction. These results were consistent with the equilibrium and mass transfer principles. The driving force during mass transfer was the concentration gradient between solid and liquid which was greater for larger liquid-to-solid ratio, resulting in an increase of the diffusion rate. It was identified earlier[Citation16,Citation39] that the effect of increasing liquid-to-solid ratio on extraction yield was two-fold. First, it increased the concentration gradient between solid and liquid resulting in an increase in mass transfer of extracted compounds from solid to liquid phase; and second, it modified the solubility and final equilibrium state. Liquid-to-solid ratios of 9.8:1 to 60.2:1 mL/g were used in the optimization during extraction. It was observed that the extraction yield was found to be maximum at a liquid-to-solid ratio of about 50:1 mL/g. On further increase in liquid-to-solid ratio, no significant increase in extraction yield was observed. To make any extraction process economically feasible, it was important to maximize extraction yield, while minimizing consumption of solvent and associated energy cost for solvent heating. With regard to time, extraction yield increased with the increase of time at the beginning of extraction with a maximum value followed by a decrease. A maximum extraction yield was also observed when the liquid-to-solid ratio and extraction time increased to about 50:1 and 50ºC, respectively, keeping the extraction time fixed at 75 min (). Similar extraction yield of about 15% was observed when the liquid-to-solid ratio and extraction time increased to about 50:1 and 90 min, respectively keeping the extraction temperature fixed at 60ºC (). It was observed from the surface plot that with increase in extraction temperature and extraction time, extraction yield increased. However, the combination of higher temperature and longer extraction time led to decline in extraction yield. Extraction yield approached to its minimum value of about 11% when the extraction temperature and time increased to about 85ºC and 100 min, respectively keeping the liquid-to-solid ratio fixed at 35:1.
Figure 1. Response surface for the effects of: A: temperature and liquid-to-solid ratio, and B: time and liquid-to-solid ratio, on the extraction yield, C: temperature and liquid-to-solid ratio, D: and time and liquid-to-solid ratio on the extract purity; E: temperature and liquid-to-solid ratio, and F: time and liquid-to-solid ratio on DPPH; G: temperature and liquid-to-solid ratio, and H: time and liquid-to-solid ratio on FRAP. The value of the missing independent variable in each plot was kept at the center point.
Effect of Process Variables on the Extract Purity
ANOVA results indicated that the extract purity was significantly affected by linear terms of liquid-to-solid ratio (p < 0.001), extraction temperature (p < 0.01) and extraction time (p < 0.05). The quadratic terms of extraction temperature also showed significant effect at the probability level of p < 0.01. The interaction between extraction temperature and liquid-to-solid ratio, as well as between extraction time and liquid-to-solid ratio was significant (p < 0.01). and illustrated the effects of extraction temperature, time and liquid-to-solid ratio on the extract purity. As shown in these figures, the extract purity increased slowly when extraction temperature and liquid-to-solid ratio increased in the range of 34.8 to 50°C and 9.8:1 to 50:1 mL/g, respectively. Beyond about 50°C, purity of extract decreased while on further increase in liquid-to-solid ratio, no significant change in purity was observed. Increasing temperature generally favored extraction by increasing solubility of phenolic compounds in the solvent. However, at higher temperatures, TPC of the extract decreased due to possible decomposition of less thermally stable antioxidant compounds which were already extracted at lower temperatures. It was also observed from the surface plot that at low temperature, purity of the extract increased with increase in extraction time. But the combination of higher temperature and longer extraction time led to decrease in TPC of the extract. Therefore, extract purity declined.
Effect of Process Variables on the Antioxidant Activity of the Extract
The antioxidant activity of seed extract was determined using DPPH free radical scavenging activity and FRAP assay. The antioxidant activity of the extract measured by DPPH method was significantly influenced by the linear effect of extraction temperature (p < 0.001) and liquid-to-solid ratio (p < 0.0001). Among the quadratic terms, only extraction temperature was found to be significant (p < 0.05). The contribution of the interaction term of extraction temperature and liquid-to-solid ratio, as well as the interaction term of extraction time and liquid-to-solid ratio were significant (p < 0.01) as observed in case of TPC. For FRAP assay, linear effect of extraction temperature and liquid-to-solid ratio were found to be significant as observed in DPPH assay. Furthermore, all the quadratic terms were found to be significant (p < 0.01). Among the interaction terms, only interaction between extraction temperature and time was found to be significant (p < 0.05). – illustrated the effects of extraction temperature, time and liquid-to-solid ratio on antioxidant activity of the extract measured by DPPH and FRAP assay, respectively. The responses for both DPPH and FRAP assay showed almost similar trends as those observed for TPC in and indicating that antioxidant activity was believed to be responsible for total polyphenol content of the extracts. The strong correlation between TPC and antioxidant activity had been reported by other authors in many fruit residues.[Citation40] In separate experiments, linear correlations were observed between seed extract and antioxidant activity when extract samples of different concentrations (12.5–50 µg/mL) were analyzed using both FRAP (R2 = 0.998) and DPPH (R2 = 0.992) assays as shown in and . The high R2 values suggested that the polyphenols extracted with this technique clearly contributed to the antioxidant activity of the extracts. This was in agreement with other previous findings regarding the relationship of phenolic content and inhibition percentage of extracts from natural products.[Citation41] These experiments confirmed that conditions that favored maximum extraction of polyphenols were also the conditions which favored to obtain extracts with maximum antioxidant activity.
Figure 2. Antioxidant activities of dried extract of jamun seed assessed by A: DPPH, B: FRAP. Data presented are average values of triplicates.
Optimization and Experimental Validation of Optimized Condition
The optimal extraction conditions for obtaining the maximum extraction yield with maximum purity and antioxidant activity of the extract were: Extraction temperature 49.2°C; extraction time 89.4 min; and liquid-to-solid ratio 51.6:1 mL/g. Under conditions described above, the model predicted the following values: Extraction yield (15.3%), purity (43.5%), DPPH radical scavenging activity at an extract concentration of 50 μg/mL (77.7%) and FRAP at an extract concentration of 100 μg/mL (665 µmol/L). To confirm the values obtained from the numerical optimization, experiments were performed under the optimal conditions which allowed to obtain an extract with the following characteristics: Extraction yield (17.3 ± 0.8)%, purity (41.5 ± 1.0)%, DPPH radical scavenging activity (75.5 ± 2.5)%, and FRAP (720 ± 25) µmol/L. There was a good agreement between predicted and experimental values demonstrating the validation of the RSM model for the extraction process. The extraction yield was found to be comparable with the yield achieved for other plant food wastes such as grape seed (19.2%), guarana (23.8%), fennel (16.2%).[Citation8,Citation11,Citation40] However, those studies involved the use of either organic solvent or microwave etc. to achieve similar extraction yield. In comparison to those, the present study seemed to be more cost effective. TPC of the jamun seed extract (72 ± 2.5)mg GAE/g seed or (415 ± 10) mg GAE/g DE were comparable with the values reported for other plant seeds such as guarana (119 mg GAE/g extract),[Citation11] date (55 mg GAE/g),[Citation17] litchi (17.9 mg GAE /g), kinnow (3.68 mg GAE /g), grape (35–65 mg GAE/g), jackfruit (27.7mg GAE/g), avoca (88.2 mg GAE/g), longan (62.6 mg GAE/g), and tamarind (94.5 mg GAE/g)[Citation42] at different solvent, time and temperature combinations for extraction. It was also observed that seed extracts exhibited comparable reducing power with the values reported for other plant seeds. Soong and Barlow[Citation42] reported the FRAP value of 2.8 μmol FeSO4/g, 1484 μmol FeSO4/g, 1388 μmol FeSO4/g, 2486 μmol FeSO4/g for aqueous ethanolic seed extracts of jackfruit, avoca, longan, tamarind, respectively, using different time and temperature combinations for extraction. FRAP values for BHT, ascorbic acid and water extract of seed were experimentally found to be (355 ± 12) µmol Fe(II)/L, (1053 ± 20) µmol Fe(II)/L and (720 ± 20) µmol Fe(II)/L, respectively, at a concentration of 100 μg/mL. Furthermore, the DPPH assay showed that seed extract exhibited higher antioxidant activity (75.5 ± 2.5% at extract concentration of 50 μg/mL) than other fruit residue as well as some synthetic antioxidants. Babbar et al.[Citation43] reported antioxidant activity (DPPH assay) of 77, 83, and 67% for methanolic seed extracts of grape, litchi, kinnow, respectively, at the extract concentration of 5000 μg/mL using different time and temperature combinations for extraction. IC50 value of the aqueous jamun seed extract was estimated as (35.44 ± 0.7) µg/mL (). The IC50 values of standard ascorbic acid and BHT were experimentally found to be 14.3 ± 0.4 μg/mL (y = 2.372x + 16.2, R2 = 0.96) and 30.35 ± 0.9 μg/mL (y = 1.131x + 15.6, R2 = 0.98), respectively. Therefore, the IC50 value on the DPPH radical scavenging activity decreased in the following order: ascorbic acid < BHT < seed extract. The other physicochemical properties of seed extract (at optimum conditions) such as total flavonoid compounds, AIS, pH, total acidity, viscosity, conductivity, color, and clarity were also presented in .
Table 2. Physico-chemical properties of aqueous extract of jamun seeds.
Identification and Quantification of Phenolic Compounds by HPLC
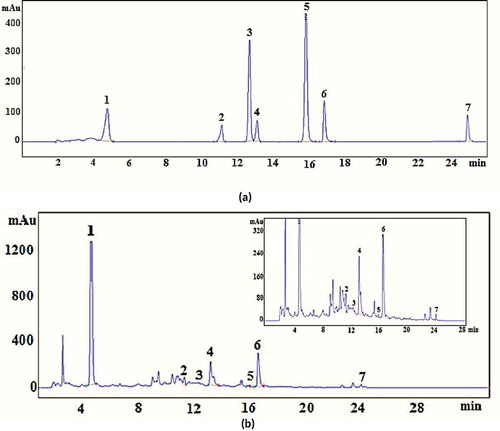
and showed the HPLC chromatogram of synthetic solution of standards and optimally obtained aqueous extract of jamun seed at 280 nm, respectively. Individual phenolic compounds were identified by comparison of the retention time and UV–vis spectrum of the original standard and quantified from peak area. HPLC analysis identified seven phenolic compounds in the extract as gallic acid, ellagic acid, caffeic acid, p-coumaric acid, catechin, epicatechin and quercetin as shown in . The content of individual phenolic compound in the seed extract was calculated from respective standard calibration curves, and the values were 90.8 mg/g DE for gallic acid, 36.0 mg/g DE for ellagic acid, 26.07 mg/g DE for caffeic acid, 0.26 mg/g DE for p-coumaric acid, 9.05 mg/g DE for catechin, 0.42 mg/g DE for epicatechin, and 1.54 mg/g DE for quercetin. In separate analysis, tannic acid was quantified as 188.5 mg/g DE. Mean values of three replicates analysis were given. SD% values were found to be always less than 3%. Tannic acid was found to be the most abundant phenolic acid (45.4%) in the extract followed by gallic acid (21.9%), ellagic acid (8.65%), and caffeic acid (6.3%), while the least abundant phenolic acid was p-coumaric acid. Catechin was found to be the most dominant flavonoid compound (2.2%) in the extract. TPC of the seed extract was determined spectrophotometrically by Folin–Ciocalteu’s phenol reagent as 415 mg GAE/g DE. Sum of individual phenolics of seed extract was calculated as 352.64 mg/g DE indicating that TPC determined by Folin–Ciocalteu’s phenol reagent gave close results to sum of individual phenolic content. This result further demonstrated that about 85% of TPC was identified in the present study.
Table 3. Content of identified phenolic compounds in the optimally obtained jamun seed extract.
Figure 3. HPLC Chromatograms (280 nm) of: A: synthetic solution of standards (50 µg/mL), B: Jamun seed extract obtained under optimal condition. (1) Gallic acid; (2) Catechin; (3) Epicatechin; (4) Caffeic acid; (5) p-coumaric acid; (6) Ellagic acid; (7) Quercetin.
Kinetics of Polyphenols Extraction
showed the effect of extraction temperatures (34.8, 60, and 85.2°C) and liquid-to-solid ratios (9.8:1, 35:1, 60.2:1 mL/g) on the extraction kinetics of total polyphenols from jamun seed. As observed from , extraction occurred very rapidly at the beginning of extraction followed by gradual extraction rate, and asymptotically approaching the equilibrium concentration in which the solvent was not able to remove the polyphenols from the jamun seeds. Several kinetic equations were reported in literature to model the solid-to-liquid extraction of bioactive compounds from plant materials. In the present study, four widely used kinetic models namely, first-order model,[Citation8] second-order model,[Citation24] Peleg’s model,[Citation25] and Minchev and Minkov model[Citation26] were used for interpretation of experimental extraction data and kinetic parameters were estimated by the non-linear regression analysis as presented in .
Table 4. Kinetic parameters for aqueous extraction of total polyphenols from jamun seed.
Figure 4. Aqueous extraction of total polyphenols from jamun seeds for various operating conditions (Error bar: ±3%).
It was also observed from the that for all the models, the extraction rate increased with increasing extraction temperature as well as with increasing liquid-to-solid ratio. The estimated values of rate constant (k) varied from 0.137 to 0.185 min−1, 0.044 to 0.086 min−1 and 0.132 to 0.1836 min−1 in temperature range of 34.8–85.2°C, estimated from first-order model, second-order model and Minchev and Minkov model, respectively. The extraction rate constant values were compatible with the results reported by other authors.[Citation44] The extraction rate (1/k1) estimated from Peleg’s model increased from 1.08 to 1.78 g GAE/100 gm of seed with increase in temperature from 34.8–85.2°C, while extraction rate (k) estimated from second-order model increased from 1.27 to 2.68 g GAE/100 gm of seed with the same increment of temperature. Further an increase in liquid-to-solid ratio resulted in an increase in the extraction rate. It could be seen that with increase in liquid-to-solid ratio from 9.8 to 60.2 mL/g, the extraction rate increased from 0.6 to 2.5 g min−1/100 gm of seed and 0.49 to 1.96 g min−1/100 gm of seed obtained from second-order model and Peleg’s model, respectively.
For solid to liquid extraction process, Arrhenius model is commonly used to describe extraction rate to temperature relations followed by estimation of activation energy (Ea).[Citation44–Citation46] Temperature dependence of the extraction kinetics can be expressed by Arrhenius equation as,
where k0 is a constant (g GAE/100 g min), R the universal gas constant (8.314 J mol−1 K−1), Ea the activation energy (J mol−1) and T is the absolute temperature (K). Activation energy is an important scientific parameter for better understanding of the extraction process. The Ea values of polyphenol extraction obtained from the slope of the plot (-ln(k) vs l/T) in the first-order model, second-order model and Minchev and Minkov model for the temperature range under investigation were found to be (5.45 ± 0.16) kJ mol−1 (R2 = 0.94), (12.1 ± 0.35) kJ mol−1 (R2 = 0.88), and (6.02 ± 0.2) kJ mol−1 (R2 = 0.98), respectively, as shown in . For the same temperature range, the value of Ea obtained from the slope of the plot (–ln(k1) vs l/T) in the Peleg’s model was estimated to be (9.48 ± 0.25) kJ mol−1 (R2 = 0.89), as also shown in . There were no such reports available in literature on the activation energy of polyphenol extraction from jamun seeds. However, these values were in good agreement with literature values reported for other bioactive compounds.[Citation44–Citation46]
Figure 5. Arrhenius plot of aqueous extraction of total polyphenols from jamun seeds. First-order model (R2 = 0.94), y = –0.129 + 0.656x; Minchev and Minkov model (R2 = 0.98), y = –0.320 + 0.724x; Second-order model (R2 = 0.88), y = –1.545 + 1.455x; Peleg’s model (R2 = 0.89), y = 3.831 – 1.141x.
For selection of best kinetic model to represent the extraction of total polyphenols from jamun seeds, the concordance between experimental data and model predicted value was established by the magnitudes of the coefficient of determination (R2), the root mean squared deviation (RMSD) and mean relative error (MRE). The higher is the value of R2 and the lower is the value of RMSD or MRE, the better will be the goodness of fit. The extraction kinetics could be well described by all the four kinetic models tested under operating conditions employed, which was proved by high coefficient of determination (R2 > 0.98), low RMSD (<0.55) and low MRE (<±4.7%). However, compared to other models, second–order model showed maximum values of RMSD (0.131–0.546) and MRE (±2.8–4.65%) in all experiments and thus was not the best model to fit our experimental data. First-order model, Peleg’s model and Minchev and Minkov model generated quite similar errors values (RMSD and MRE) for fitting experimental data. The lowest values of RMSD and MRE obtained from Peleg’s model, Minchev and Minkov model, and first-order model were found to be (0.047 and ±0.06%), (0.081 and ±0.34%), and (0.080 and ±0.06%), respectively. The relationship between rate constant and reciprocal absolute temperature yielded a R2 of 0.88 for Peleg’s model, R2 of 0.96 for first-order model, and R2 of 0.98 for Minchev and Minkov model. The high value of coefficient of determination (R2) confirmed that Arrhenius equation could be used to describe the variation of extraction rate constant with temperature. Peleg’s model and that proposed by Minchev and Minkov, both were empirical in nature. Minchev and Minkov model was based on numerical analysis of the experimental data whereas, the Peleg’s model was based on curves of sorption/desorption. However, first-order rate equation was derived from Fick’s second law[Citation23] based on some hypotheses (solid particles were considered as spheres with an initial uniform concentration of active component; porous solid which was considered as a pseudo-homogeneous medium where the concentration of active component varied with time and distance; thermodynamic equilibrium was established at the interface) and using the steady-state model. Since the rate constant–temperature relationship was a very important issue and use of physical model was more convenient for process design, optimization and scaling-up, the first-order model seemed to be more appropriate to represent the extraction of total polyphenols from jamun seeds. Similar methodology was used by Sant’Anna et al.,[Citation44] for determining the best model to explain the extraction kinetics of total polyphenols from grape marc.
Conclusion
Aqueous extract of jamun seed was demonstrated as a potential source of phenolic compounds in the present study. Extraction process was optimized by central composite design and the optimum conditions were extraction time 89.4 min, temperature 49.2°C and liquid-to-solid ratio 51.6:1 mL/g, respectively. Second-order polynomial models were developed using the RSM which gave a satisfactory description of the experimental data. Tannic acid (188.5 mg/g DE) and gallic acid (90.8 mg/g DE) were identified as major phenolic compounds in the extract. On the basis of the experimental results, the aqueous jamun seed extract obtained by optimized extraction procedure exhibited significant antioxidant activity and considered as a potential source of phenolic compounds, especially in terms of phenolic acids (tannic acid, gallic acid, ellagic acid, and caffeic acid, etc.), which was about 82% of TPC. However, more studies are required to determine the flavonoid compounds present in the extract. Kinetics of the total polyphenol extraction was investigated and experimental extraction data were analyzed by four kinetic models reported in literature. The activation energy was estimated to be (5.45–12.1) kJ mol−1 in the studied temperature range. The first-order model seemed to be more appropriate to represent the extraction of total polyphenols from jamun seeds. The present study provided the basis for promising and environmental-friendly large scale polyphenols extraction process from the jamun seeds. In view of the potential of jamun seeds to provide a natural source of antioxidants, our on-going research is underway to purify and concentrate the jamun seeds extract, evaluating its shelf life in terms of antioxidant activity.
Nomenclature
| AIS | = | Alcohol Insoluble Solids (wt%) |
| Ct | = | Concentration of TPC at time t, g GAE/100 g seed |
| C∝ | = | Concentration of TPC at saturation, g GAE/100 g seed |
| Cexp | = | Concentration of experimental TPC at time t, g GAE/100 g seed |
| Ccal | = | Concentration of calculated TPC at time t, g GAE/100 g seed |
| Ea | = | Activation energy, J mol−1 |
| k | = | Kinetic rate constant, min−1 |
| k1 | = | Peleg’s rate constant, 100 g seed. min/g GAE |
| k2 | = | Peleg’s capacity constant, 100g seed/g GAE |
| N | = | Number of samples |
| R2 | = | Coefficient of determination |
| R | = | Universal gas constant, J mol−1 K−1 |
| RMSD | = | Root mean squared deviation, dimensionless |
| MRE | = | Mean relative error (%) |
| t | = | Time, min. |
| T | = | Temperature, °K |
| TPC | = | Total polyphenol content |
| TFC | = | Total flavonoid content |
| X | = | Real variables |
| Y | = | Response variable |
Greek symbols
| βij | = | Coefficient of the interactions terms |
| βii | = | Coefficient of the quadratic terms |
| βi | = | Coefficient of the linear terms |
| β0 | = | Constant term |
Funding
The authors sincerely thank the Council of Scientific and Industrial Research, India (under grant – CSIR-38/(1392)/14/EMR-II) for financial support of this research project.
Additional information
Funding
References
- Patil, S.S.; Thorat, R.M.; Rajasekaran, P. Utilization of Jamun Fruit (Syzygium Cumini) for Production of Red Wine. Journal of Advanced Laboratory Research in Biology 2012, 2(2), 200–203.
- Vaidya, S.V. The Indian Feed Industry. CLFMA 2001, 193.43.36.12.
- Swami, S.B.; Thakor, N.S.J.; Patil, M.M.; Haldankar, P.M. Jamun (Syzygium Cumini (L.)): A Review of Its Food and Medicinal Uses. Food and Nutrition Science 2012, 3, 1100–1117.
- Kaneria, M.; Chandra, S. Evaluation of Antioxidant and Antimicrobial Capacity of Syzygium cumini L. Leaves Extracted Sequentially in Different Solvents. Journal of Food Biochemistry 2013, 37, 168–176.
- Grice, H.P. Enhanced Tumour Development by Butylated Hydroxyanisole (BHA) from the Prospective of Effect on Forestomach and Oesophageal Squamous Epithelium. Food and Chemical Toxicology 1988, 26, 717–723.
- Krishnaiah, D.; Sarbatly, R.; Nithyanandam, R. A Review of the Antioxidant Potential Of Medicinal Plant Species. Food and Bioproducts processing 2011, 89, 217–233.
- Pinelo, M.; Rubilar, M.; Jerez, M.; Sineiro, J.; Nunez M.J. Effect of Solvent, Temperature, and Solvent-to-Solid Ratio on the Total Phenolic Content and Antiradical Activity of Extracts from Different Components of Grape Pomace. Journal of Agriculture and Food Chemistry 2005, 53, 2111–2117.
- Khan, M.K.; Abert-Vian, M.; Tixier, A.S.F.; Dangles, O.; Chemat, F. Ultrasound-Assisted Extraction of Polyphenols (Flavanone Glycosides) from Orange (Citrus Sinensis L.) Peel. Food Chemistry 2010, 119, 851–858.
- Li, Y.; Skouroumounis, G.K.; Elsey, G.M.; Taylor, D.K. Microwave-Assistance Provides Very Rapid and Efficient Extraction of Grape Seed Polyphenols. Food Chemistry 2011, 129(2), 570–576.
- Yang, C.; Xu, Y.R.; Yao, W.X. Extraction of Pharmaceutical Components from Ginkgo Biloba Leaves Using Supercritical Carbon Dioxide. Journal of Agricultural and Food Chemistry 2002, 50, 846–849.
- Cama, M.; Hisil, Y. Pressurised Water Extraction of Polyphenols from Pomegranate Peels. Food Chemistry 2010, 123, 878–885.
- Vilkhu, K.; Raymond, M.; Simons, L.; Bates, D. Applications and Opportunities for Ultrasound Assisted Extraction in the Food Industry—A Review. Innovative Food Science and Emerging Technology 2008, 9, 161–169.
- Majhenic, L.; Skerget, M.; Knez, Z. Antioxidant and Antimicrobial Activity of Guarana Seed Extracts. Food Chemistry 2007, 104, 1258–1268.
- Brahim, M.; Gambier, F.; Brosse, N. Optimization of Polyphenols Extraction from Grape Residues in Water Medium. Industrial Crops and Products 2014, 52, 18–22.
- Reis, S.F.; Rai, D.K.; Ghannam, N.A. Water at Room Temperature as a Solvent for the Extraction of Apple Pomace Phenolic Compounds. Food Chemistry 2012, 135, 1991–1998.
- Cisse, M.; Bohuon, P.; Sambe, F.; Kane, C.; Sakho, M.; Dornier, M. Aqueous Extraction of Anthocyanins from Hibiscus Sabdariffa: Experimental Kinetics and Modelling. Journal of Food Engineering 2012, 109, 16–21.
- Al-Farsi, M.A.; Lee, C.Y. Optimization of Phenolics and Dietary Fibre Extraction from Date Seeds. Food Chemistry 2008, 108, 977–985.
- Rai, P.; Majumdar, G.C.; DasGupta, S.; De, S. Optimizing Pectinase Usage in Pretreatment of Mosambi Juice for Clarification by Response Surface Methodology. Journal of Food Engineering 2004, 64, 397–403.
- Biswas, P.P.; Mondal, M.; De, S. Comparison Between Centrifugation and Microfiltration as Primary Clarification of Bottle Gourd (Lagenaria Siceraria) Juice. Journal of Food Processing and Preservation 2016, 40, 226–238.
- Rai, C.; Majumdar, G.C.; De, S. Optimization of Process Parameters for Water Extraction of Stevioside Using Response Surface Methodology. Separation Science and Technology 2012, 47, 1014–1022.
- Bouras, M.; Chadni, M.; Barba, F.J.; Grimi, N.; Bals, O.; Vorobiev, E. Optimization of Microwave-Assisted Extraction of Polyphenols from Quercus Bark. Industrial Crops and Products 2015, 77, 590–601.
- Dahmoune, F.; Nayak, B.; Moussi, K.; Remini, H.; Madani, K. Optimization of Microwave-Assisted Extraction of Polyphenols from Myrtus Communis L. Leaves. Food Chemistry 2015, 166, 585–595.
- Spiro, M.; Jago, D.S. Kinetics and Equilibria of Tea Infusion. Part 3. Rotatingdisc Experiments Interpreted by a Steady-State Model. Journal of Chemical Society. Farady Transactions 1982, 78, 295–305.
- Qu, W.; Pan, Z.; Maa, H. Extraction Modeling and Activities of Antioxidants from Pomegranate Marc. Journal of Food Engineering 2010, 99, 16–23.
- Peleg, M. An Empirical–Model for the Description of Moisture Sorption Curves. Journal of Food Science 1988, 53(4), 1216–1219.
- Minchev, A.; Minkov, S. A Model for Determination of the Effective Diffusion Coefficient by the Standard Function Technique. Journal of Applied Chemistry 1984, 57(3), 717–720.
- Amendola, D.; De Faveri, D.M.; Spigno, D.F. Grape Marc Phenolics: Extraction Kinetics, Quality and Stability of Extracts. Journal of Food Engineering 2010, 97, 384–392.
- Khuri, A.I.; Cornell, J.A. Response Surfaces: Design and Analysis; Marcel Dekker Inc: New York, NY, 1987.
- Montgomery, D.C. Design and Analysis of Experiments, 5th ed.; John Wiley and Sons: New York, NY, 2001.
- Ranganna, S. Hand Book of Analysis and Quality Control for Fruit and Vegetable Products; Tata McGraw Hill Publishing Company Limited: New Delhi, India, 1986.
- Hart, F.L.; Fisher, H.J. Methods of Analysis, Modern Food Analysis; Springer: Berlin, 1971; 43.
- Singleton, V.; Rossi, J.A. Colorimetry of Total Phenolics with Phosphomolybdic-Phosphotungstic Acid Reagents. American Journal of Enology and Viticulture 1965, 16, 144–158.
- Vasco, C.; Ruales, J.; Eldin, A.K. Total Phenolic Compounds and Antioxidant Capacities of Major Fruits from Ecuado. Food Chemistry 2008, 111, 816–823.
- Chang, C.; Yang, M.; Wen, H.; Chern, J. Estimation of Total Flavonoid Content in Propolis by Two Complementary Colorimetric Methods. Journal of Food and Drug Analysis 2002, 10, 178–182.
- Haggerman, A.E.; Butler, L.G. Protein Precipitation Method for Determination of Tannins. Journal of Agriculture and Food Chemistry 1978, 26, 809–812.
- McCune, L.M.; Johns, T. Antioxidant Activity in Medicinal Plants Associated with the Symptoms of Diabetes Mellitus Used by the Indigenous Peoples of the North American Boreal Forest. Journal of Ethnopharmacology 2002, 82, 197–205.
- Gohari, A.R.; Hajimehdipoor, H.; Saeidnia, S.; Ajani, Y.; Hadjiakhoondi, A. Antioxidant Activity of Some Medicinal Species Using FRAP Assay. Journal of Medicinal Plants 2011, 10(37), 54-60.
- Box, G.E.P.; Wilson, K.B. On the Experimental Attainment of Optimum Conditions. Journal of the Royal Statistical Society 1951, 13, 1–45.
- Cacace, J.E.; Mazza, G. Mass Transfer Process During Extraction of Phenolic Compounds from Milled Berries. Journal of Food Engineering 2003, 59, 379–389.
- Oktaya, M.; Gulcin, I.; Kufrevioglu, O.I. Determination of in Vitro Antioxidant Activity of Fennel (Foeniculum Vulgare) Seed Extracts. LWT–Food Science and Technology 2003, 36, 263–271.
- Kaur, C.; Kapoor, H.C. Antioxidant Activity and Total Phenolic Content of Some, Asian Vegetables. International Journal of Food Science and Technology 2000, 37, 153–161.
- Soong, Y.; Barlow, P.J. Antioxidant Activity and Phenolic Content of Selected Fruit Seeds. Food Chemistry 2004, 88, 411–417.
- Babbar, N.; Oberoi, H.S.; Uppal, D.S.; Patil, R.T. Total Phenolic Content and Antioxidant Capacity of Extracts Obtained from Six Important Fruit Residues. Food Research International 2011, 44, 391–396.
- Sant’Anna, V.; Brandelli, A.; Marczak, L.D.F.; Tessaro, I.C. Kinetic Modeling of Total Polyphenol Extraction from Grape Marc and Characterization of the Extracts. Separation and Purification Technology 2012, 100, 82–87.
- Hoa, Y.S.; Oumarou, H.A.H.; Fauduet, H.; Porte, C. Kinetics and Model Building of Leaching of Water-Soluble Compounds of Tilia Sapwood. Separation and Purification Technology 2005, 45, 169–173.
- Linares, A.R.; Hase, S.L.; Vergara, M.L.; Resnik, S.L. Modeling Yerba Mate Aqueous Extraction Kinetics: Influence of Temperature. Journal of Food Engineering 2010, 97, 471–477.