
ABSTRACT
The effect of microwave treatment to reduce the cooking times of five pulses, namely red lentil, chickpea, pigeon pea, mung bean, and pinto bean, were determined in this study. Pulses from 10 to 18% moisture contents were treated using 400 to 600 W microwaves for 14 to 56 s. The cooking times of microwave-treated pulses were significantly lower than that of the control samples. The lowest cooking time was observed for 18% moisture content chickpea and pigeon pea treated with 600 W for 56 s. The Fourier transform mid-infrared spectra in both lipids and fingerprint regions showed the macronutrients differences among the five pulses. Major changes were observed in the amide I region of microwave treated pulses. This effect of microwave treatment was higher in red lentil, chickpea, and mung bean than in pigeon pea and pinto bean at 10% moisture content. At 18% moisture content, the change of β-sheets to aggregates was observed in all pulses due to microwave treatment.
Introduction
Pulses are dicotyledonous seeds and belong to the Leguminosae family. Pulses are an excellent source of protein, carbohydrates, and fiber. They provide many essential amino acids, vitamins, and minerals. They are primarily consumed with staple foods such as rice, wheat, or millets as a supplementary source of protein. Despite such favorable characteristics, leguminous foods are always debated over their protein efficiency ratios, presence of anti-nutritional compounds, and high processing or cooking times. Numerous ongoing researches on pulse foods support their wide usage in the food industry as pulses are rich in protein, fiber, and essential nutrients.[Citation1–Citation4]
Currently employed conventional pulse processing methods like soaking, fermentation, germination, and milling are relatively ineffective in reducing the cooking time and improving nutritional quality.[Citation5] There are different thermal and non-thermal technologies used as pre-treatments for pulses. Thermal technologies include radio-frequency heating, microwave heating, infrared (IR) heating, pulsed electric field heating, and ohmic heating. Research has shown that microwave treatment modifies the physicochemical and rheological properties of food at the molecular level by the creation of free radicals, which react with other components in the food resulting in several changes.[Citation6]
Microwaves are non-ionizing rays that cause heating as a result of the interaction of alternating electromagnetic field with the chemical constituents of foods at frequencies of 915 or 2450 MHz.[Citation7] This leads to molecular friction causing instantaneous heat generation. Microwave drying of grains is faster and better than convective drying.[Citation8] It has also been shown to improve drying characteristics, including savings in drying time, increased drying rate, and improved energy efficiency.[Citation9] Research using IR treatment has shown that IR as a pre-treatment reduces cooking time.[Citation10–Citation13] Even though exposure of pulses to microwave treatment has proven to be a good method for disinfestation and to reduce cooking time, not much work has been done to determine the effect of microwave treatment on the nutritional qualities of pulses.
Fourier transform mid-infrared (FTIR) spectroscopy is a well-established, fast, and analytical technique that can be used to obtain the molecular compositional information of solids, liquids, or gases with no or minimal sample preparation.[Citation14] A typical mid-FTIR spectromicroscope consists of an optical microscope, an IR spectrometer, and an array detector which allows simultaneous visualization of microstructural and chemical makeup of a particular area of biological tissues.[Citation15–Citation17] Understanding the secondary structure of protein in seeds is important to understand its nutritive quality, digestion properties, and assimilation through consumption in the body.[Citation18] Limited research has been done on the use of FTIR spectroscopy to study the effect of microwave treatment on chemical composition and inherent structure of biomolecules in cereals and pulses, and relating the changes to understand its digestive properties. Therefore, the main objectives of this work were to: (1) study the effect of microwave treatment on the cooking times of five common pulses; (2) compare the macronutrients qualities of the pulses using FTIR spectroscopy; and (3) study the effect of microwave treatment on the macronutrients qualities and microstructural properties of pulses.
Materials and Methods
Pulses
Five different pulses commonly used in India were selected for this study. Red lentil (Lens culinaris L.), chickpea (Cicer arietinum L.), and pinto bean (Phaseolus vulgaris L.) were procured from St. Joseph, Manitoba, Canada; mung bean (Vigna radiata L.) from a local supermarket in Winnipeg, Manitoba; and pigeon pea (Cajanus cajan L.) from a local market in Thanjavur, Tamil Nadu, India. Initial moisture contents (m.c.) of red lentil and mung bean were determined by drying 16 g of unground samples, in triplicate, at 130°C for 20 h.[Citation19] For pinto bean, chickpea, and pigeon pea, 15 g of the samples, were dried in a hot-air oven at 103°C for 72 h.[Citation19] After determining the initial m.c., the samples were conditioned to 10, 14, and 18% m.c. (% wet basis [w.b.]) by adding distilled water and mixing it thoroughly. The samples were then stored in polythene bags at 4°C for 72 h for moisture equilibration until used.[Citation20]
Microwave Treatment
An industrial and continuous type pilot scale microwave system operating at 230 V AC, 60 Hz, and 23 A (Model No: P24YKA03, Industrial Microwave Systems, Morrisville, NC) was used for the treatment to pulses. It consists of a continuous conveyor belt assembly, microwave applicator, fan, and a control panel. The speed of the conveyor and the power output of the microwave generator could be adjusted to the desired level. The maximum allowable speed of the conveyor was 3 m/min, at which sample can be exposed for 28 s in the applicator. The fan was switched on while conducting the experiments and the air inlet temperature was set at 30°C. The sample holder used for experiments was made of polystyrene having dimensions of 30 cm × 3 cm × 1 cm and sample holding capacity of 50 g. The microwave treatment experiment was conducted for the five pulses at 3 m.c.: 10, 14, and 18% (w.b.); at three microwave power levels: 400, 500, and 600 W; and at three microwave exposure times: 14, 28, and 56 s. The power levels and exposure times were selected based on results from the preliminary studies.
Cooking Time Test
A lab scale water bath (Model: B-461, Buchi, Switzerland) was used to determine the cooking times of untreated and microwave treated pulses using the procedure described by Sashikala and Narasimha.[Citation21] Cooking time tests for each pulse sample were performed in triplicate. In a batch, 12 individual test tubes containing 100 mL of distilled water in each were kept in a boiling water bath. When the distilled water temperature reached 100°C, 10 g of pulse kernels were added and stirred occasionally. Samples were checked every 30 s for the determination of the cooking time. Cooking was considered complete when the kernels were soft to make uniform transparent mass (with no opaque core in the kernels) when placed between two glass slides and pressed against each other with no lateral movement. This method will have an error of 30 s in the determination of cooking time, if the cooking time was not determined the first time. The cooking time results were analyzed using the general linear model (GLM) procedure of the Statistical Analysis System (version 9.1, SAS Institute Inc., Cary, NC). One-way analysis of variance (ANOVA) was used to determine the individual effects of m.c., power level, and exposure time; and interactive effects of m.c. versus power level, m.c. versus exposure time, and power level versus exposure time. The variations in cooking time due to various treatments were determined by performing mean comparison test using Fisher’s least significant difference (LSD) method at p <0.05.
Sample Preparation for FTIR Spectroscopy
Untreated and microwave treated, red lentil, pigeon pea, and mung bean were dehulled using a lab scale dehuller (Model No. TM05C, Satake Corporation Inc., Hiroshima, Japan). Chickpea and pinto bean were not dehulled as they are consumed in whole form. All pulses were milled using a cyclone sample mill (Model–3010 018, Udy Co. Fort Collins, USA) to a fine powder to be analyzed using the FTIR spectrometer. The ground material was then sieved using 160 μ mesh size sieve and stored in Ziploc bags
FTIR Spectroscopy
The FTIR spectroscopy of pulse samples was performed at the mid-IR beamline 01B1-1 of the Canadian Light Source Inc., Saskatoon, SK using the glowbar (silicon carbide) as the IR source. The Bruker—IFS 66V/S spectrophotometer (Bruker Optics, Ettlingen, Germany) equipped with deuterated triglycine sulphate (DTGS) detector was used for the FTIR transmission measurements based on the potassium bromide (KBr) pellet method.[Citation22] One hundred milligrams of KBr salt was mixed with 1.5 mg of sample to prepare the pellet. The sample concentration was maintained same as high concentrations of samples caused spectral distortions due to absorption saturation. Five pellets made from random sampling for each pulse powder were used to collect the spectra. The FTIR data were collected in the mid-IR region (4000–800 cm−Citation1) with a resolution of 2 cm−Citation1. The sample chamber was evacuated to minimize the spectral peaks of CO2 and H2O from the air. Each sample spectrum was an average of 64 scans and pure KBr spectrum (average of 512 scans) was recorded as a reference (background) for normalizing all sample spectra.
FTIR Data Analysis
All FTIR data analysis was performed using the Unscrambler (version 10.1, Camo Software AS., Norway). All spectra were first corrected to minimize the scattering effects using the extended multiplicative scattering correction (EMSC) algorithm in Unscrambler. The FTIR spectra of samples were then normalized using amide I (1650 cm−Citation1) or other bands for plotting and comparison. The Origin software (version 9.1, OriginLab Corporation, MA) was used for plotting the spectral data.
The principal component analysis (PCA) procedure of Unscrambler software was used to determine the variation of the macronutrients compositions between different pulses. The PCA is one of the most commonly used methods in IR spectroscopy to observe the variability within and between samples. The first PC axis represents the direction of greatest variability, the second greatest variation lies on the second PC axis and so on. Before the PCA analysis of pulse samples, spectra were separated into lipid (3000–2800 cm−Citation1) and fingerprint (1800–800 cm−Citation1) regions. The second derivative of the EMSC corrected data were then smoothed by Golay-Savitzky algorithm using 21 points. The PCA was performed on the data by considering each wavelength of FTIR treated as an equally weighted variable. Total lipid (3000–2840 cm−Citation1), carbonyl ester (1760–1720 cm−Citation1), amide I (1700–1600 cm−Citation1), carbohydrates (1005–945 cm−Citation1), β-sheets (1648–1622 cm−Citation1), and aggregates (1635–1622 cm−Citation1) were determined by integrating the spectral regions of corresponding band positions from the second derivative spectra using OPUS software (version 7.0, Bruker Optics Inc., Billerica, MA).
Microstructural Analysis Using Scanning Electron Microscopy (SEM)
Microstructural analysis of pulses was carried out using SEM (Model: TM 1000, Hitachi, Tokya, Japan) on control and microwave treated (600 W, 56 s) chickpea and mung bean samples at 18% m.c. Seed samples were first frozen at –10°C. The frozen samples were hand sectioned with a surgical steel blade number 11 (Feather Industries Limited, Tokyo, Japan). The cut samples were then mounted on carbon tapes and placed on stub and observed at an accelerating voltage of 15 keV.
Results and Discussion
Effect of Microwave Treatment on Cooking Times of Pulses
Cooking time is one of the main criteria to evaluate pulse cooking quality.[Citation23] Other cooking quality characteristics include texture, appearance, and flavor. The cooking time of pulses refers to the time required for tissue softening that is acceptable for consumption.[Citation10] Effects of microwave power level, exposure time, and m.c. of red lentil, chickpea, pigeon pea, mung bean, and pinto bean on the cooking times are shown in . The untreated pulses required significantly (p ≤ 0.05) longer cooking time than the treated pulses. Cooking time reduced with increase in microwave power level, exposure time and m.c. The lowest cooking time was observed for 14% m.c. red lentil, mung bean, and pinto bean treated at 600 W for 56 s (). This may be due to different seed sizes and structural and compositional differences of pulses. The cooking time of mung bean recorded in this study is in agreement with earlier work by Purohit et al.[Citation24] During microwave treatment, moisture evaporates from starch granules in the cotyledon which makes it porous. Purohit et al.[Citation24] determined that particle density decreases in microwave treated pulses and cooking is fast, as large surface area is available for water absorption. The cooking times due to microwave treatment at 600 W and 56 s of 18% m.c. red lentil, chickpea, pigeon pea, mung bean, and pinto bean were reduced by 27.8, 26.5, 17.7, 28.8, and 18.8%, respectively, compared to the initial cooking time of untreated samples at 10% m.c. The increase of m.c. of pulses from 10 to 18% decreased the cooking time in control and microwave treated samples. In spite of the large seed size, a higher decrease in cooking time was observed for chickpea than pinto bean due to microwave treatment. The highest decrease in cooking time for red lentil and mung bean may be due to the small seed sizes.
Table 1. Cooking times of untreated and microwave treated pulses.
Studies on IR treatment to pulses showed reduction in cooking times of cowpeas,[Citation25] lentils,[Citation10,Citation11] and beans.[Citation26] The reduction in cooking times of IR-treated pulses may be due to pre-gelatinization of starch within the endosperm, disintegration of middle lamella of cotyledon parenchyma cells, and protein denaturation.[Citation10,Citation12] Reduction in cooking time of pulses as a result of microwave treatment implies that less energy and time is required for cooking which has potential to improve utilization and nutritional qualities of pulses, as long cooking time is known to damage vitamins and minerals.[Citation20,Citation27]
Variations in cooking time with respect to various treatments were determined. Significant differences (p <0.0001) in cooking times due to the main variables (m.c., power level, and exposure time) were noted for all the pulses. There was a significant interactive effect of m.c. and power level on pigeon pea, mung bean, and pinto bean. Significant interactive effect of m.c. and exposure time was observed only in pinto bean. However, there was no significant interactive effect of power level and exposure time on any of the pulses.
Macronutrients Qualities of Pulses
The macronutrients qualities of pulses were evaluated by comparing the FTIR spectra recorded for each pulse. (EMSC corrected and area normalized) shows the average absorbance spectra of the biochemical seed composition of five pulses at 10% m.c. The assignment of the most relevant FTIR bands in pulses spectra is listed in . Major differences between the pulses were observed in the lipid, protein, and carbohydrate regions. Lipids contains carbonyl C=O ester as well as CH2 and CH3 functional groups. The unique IR spectral peaks for lipids are: 1745 cm−Citation1 (carbonyl C=O), 1470 cm−Citation1 (CH bending), 2956 and 2876 cm−Citation1 (CH3 asymmetric and symmetric stretch), 2926 and 2855 cm−Citation1 (CH2 asymmetric and symmetric stretch).[Citation28] Chickpea had the highest amount of lipids with slight variations among the other four pulses. Chickpea have about 3–10% of lipids and have the highest percentage of lipids among pulses.[Citation29]
Table 2. Characteristic bands of different functional group observed in the mid infrared spectra of pulses.[Citation31,Citation32,Citation39]
Figure 1. The average and area normalized FTIR spectra of the five pulses at 10% m.c. Inserts show the expanded view of lipid and protein regions. RL: Red lentil; CP: Chickpea; PP: Pigeon pea; MB: Mung bean; PB: Pinto bean.
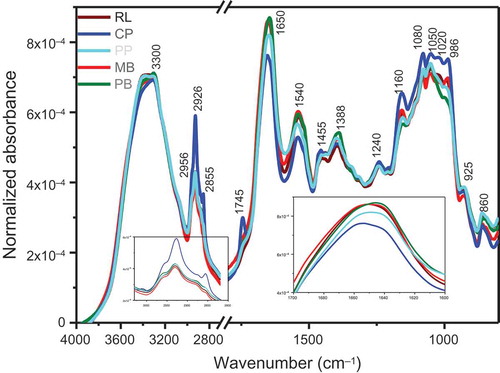
The protein’s peptide contains C=O, C-N and N-H bonds. The amide I vibration is primarily due to C=O stretching (80%) and C-N stretching vibrations, and has a characteristic peak between 1700 and 1600 cm−Citation1 (1650 cm−Citation1). Amide II peak between 1600 and 1500 cm−Citation1 (1540 cm−Citation1), represents N-H bending (60%), and C-N stretching (40%) vibrations. Red lentil, mung bean, and pinto bean had the highest amount of proteins (represented by amide I and II bands) and chickpea had the lowest amount of protein.
Depending on bond linkage and type of sugar, the peak positions for carbohydrate is between 1180 and 950 cm−Citation1. Strong peaks for lignin, hemicellulose, cellulose, and starch are at 1510, 1320, 1240, and 1020 cm−Citation1, respectively.[Citation30–Citation32] The IR bands at 1050 and 1020 cm−Citation1 can be assigned predominantly to starch.[Citation33,Citation34] The shoulders at 1080 and 986 cm−Citation1 may correspond to the C-O-H bending and C-O-C bond stretching mode of the glycosidic link and β-(1–4) linkages.[Citation35] These bands were previously identified in wheat starch,[Citation36] cell wall polysaccharides,[Citation37] and oligosaccharides.[Citation38] Chickpea had the highest intensity for carbohydrates.
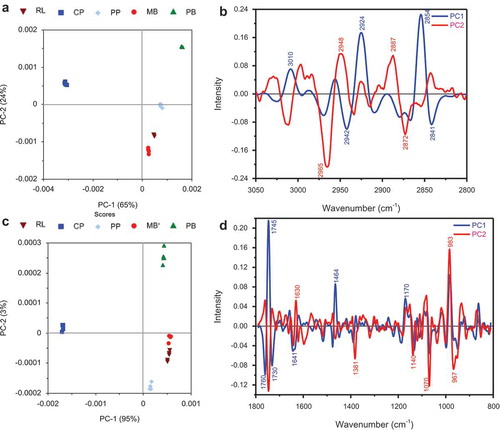
The PCA analysis of the pulse spectra in the lipid (3000–2800 cm−Citation1) and fingerprint (1800–800 cm−Citation1) regions clearly show the macronutrients differences among the five pulses (). The PCA loadings plot allows the spectral sources of inter- and/or intra-category variance to be identified. PC1 is considered the most important PC for inter-category segregation as it passes through both normal and low-grade clusters; therefore, the variance along this PC axis is responsible for inter-category segregation. Chickpea (2924 and 2854 cm−Citation1) and pigeon pea (2942 and 2841 cm−Citation1) had opposite characteristics in lipids characterized by PC1 axis. Chickpea oil contain high amount of unsaturated fatty acids which is indicated by the unsaturated HC=CH vibration at 3010 cm−Citation1.[Citation39] Both PC1 and PC2 in the lipid region explained 89% of variability between the samples. The other three pulses were characterized by PC2 axis. Red lentil and mung bean were closer in composition (2948 and 2887 cm−Citation1) compared to pinto bean (2965 and 2872 cm−Citation1) which were grouped on the positive side of PC2. The fingerprint region, shown in and , explained 95% of variation showed that chickpea (1745 and 1464 cm−Citation1), mung bean (1760 and 1730 cm−Citation1), and red lentil were characterized by PC1 axis. Pinto bean (1381 and 1070 cm−Citation1) and pigeon pea (1630 and 983 cm−Citation1) had opposite characteristics in the fingerprint region as characterized by their grouping along the positive and negative PC2 axis, respectively.
Figure 2. The PCA of the FTIR spectra of the five pulses in the lipid (a: 3100–2700 cm−Citation1) and fingerprint (c: 1800–800 cm−Citation1) regions of five pulses at 10% m.c. and the respective loading plots (b and d). RL: Red lentil; CP: Chickpea; PP: Pigeon pea; MB: Mung bean; PB: Pinto bean.
There are major changes in intensity of functional groups from carbohydrates. The normalized absorbance around 1200–800 cm−Citation1 was slightly higher and sharper in treated flour sample of all pulses than control sample, possibly suggesting a more ordered saccharide conformation.[Citation40] Conformational changes have previously been observed in wheat starch during gelatinization and retrogradation.[Citation36] Intensities also change with m.c. as starch molecule absorbs water resulting into gelatinization which may have an impact on bonding arrangement.
Effect of Microwave Treatment on the Macronutrients Qualities of Pulses
shows no changes to lipids (3000–2800 cm−Citation1, shifting of band positions) due to microwave treatment, except in mung bean, which is indicative of small lipid phase changes due to microwave treatment. This is in agreement with the increase of total lipid content in mung bean following microwave treatment (). The amount of total lipids (3000–2800 cm−Citation1), carbonyl ester (1760–1720 cm−Citation1), amide I (1700–1600 cm−Citation1), and carbohydrates (1005–945 cm−Citation1) was affected negatively or positively by microwave treatment and varied with the type of pulse and microwave treatment. The lipid/protein ratio was increased for red lentil, chickpea, and mung bean at both microwave treatments relative to control. In contrast, change was observed in pigeon pea only for microwave treatment of 18% m.c. at 600 W (). High microwave energy of 1250 W and extended exposure time of 232 s (500 W) led to unfavorable baking quality of wheat and damaged rice starch.[Citation41,Citation42]
Figure 3. Second derivatives of the FTIR spectra of control and microwave treated pulses in the lipid A: (3000–2840 cm−Citation1) and amide I B: (1710–1600 cm−Citation1) regions. Each spectrum is the average of five independent spectra. a: red lentil; b: chickpea; c: pigeon pea; d: mung bean; and e: pinto bean.
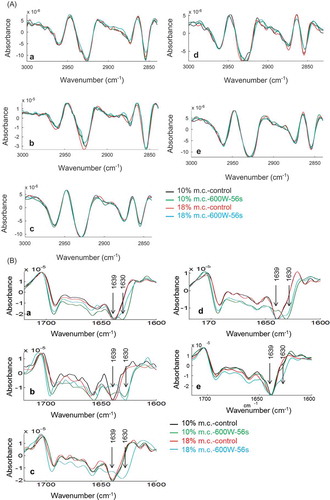
Changes in protein secondary structures measured in the amide I band for untreated and microwave treated pulses are shown in . Similar observation on the change of protein structures is reported for wheat.[Citation43] It is worth pointing out that such modifications involve a build-up of a high amount of stable aggregates.[Citation22,Citation44] The changes in protein structures may account for changes in digestibility of storage proteins after thermal treatment and, possibly, of the formation of novel complexes whose bioactivity deserves further consideration.[Citation45] Adverse effect of heat treatment on digestibility of legume proteins has been reported.[Citation46,Citation47] Considerable changes in the β-sheets region (1640–1630 cm−Citation1) were observed for all pulses. Results from this study showed the variation in intensities of peaks at 1639 and 1630 cm−Citation1, respectively, was associated with β-sheets modified to unstructured β-sheets (aggregates) due to microwave treatment, indicating changes of β-sheets H-bond environment (). The shift of 1639 cm−Citation1 band to lower wavenumber is indicative of either breaking of H-bonds or loosening the β-sheet structure. We observed that the different amount of m.c. also played a role in changes of protein secondary structures. Pinto bean had less change in the protein structures due to microwave treatment compared to other pulses. Major changes were observed in the 1650, 1640, and 1630 cm−Citation1 bands. It was observed that when the pulses were dry (10% m.c.), red lentil, chickpea, and mung bean β-sheets were affected extensively by microwave treatment, whereas the increase of m.c. to 18% changed the β-sheet profile of all pulses. It should be noted that the PCA in the fingerprint region of untreated pulses also showed that pigeon pea and pinto bean had different characteristics compared to the other three pulses.
Effect of Microwave Treatment on the Microstructural Qualities of Pulses
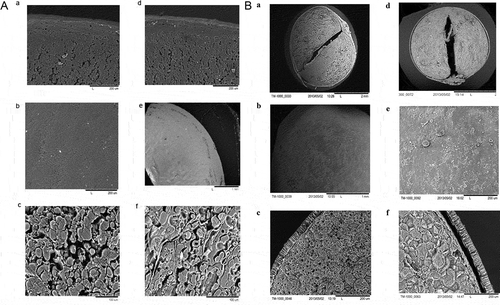
The SEM micrographs of untreated and microwave treated chickpea and mung bean are shown in . Very small to dramatic changes in the seed coat of microwave treated mung bean and chickpea were observed (, micrographs a and d, , micrographs a and d). The seed coat was clearly detached from the endosperm in microwave treated mung bean compared to chickpea. The seed coat surface of microwave treated chickpea showed extensive changes, whereas similar effect was not observed in mung bean. Microwave treated chickpea seed coat surface had lots of small creases and fractures (, micrographs b and e). The fractures on the surface of the seed coat after microwave treatment may be due to puffing action caused by moisture pressure build-up during treatment. Gelatinization and swelling of starch and escaping moisture due to high heating temperature might have created pressure on seed coat resulting in the development of fissures. The most notable difference due to microwave treatment, however, was seen in the starch granules of both the pulses. Cavities in the center of starch granules in chickpea, and increased starch granules sizes and structural alterations were observed in mung bean (, micrographs c and f, , micrographs c and f). This might be due to the vaporization of water from starch granules causing puffing action during microwave treatment. Another observation is the development of cracks in the cotyledon of chickpea. As hydration of the seeds is a critical step in achieving the necessary textural changes during cooking, these open structures in cotyledon could play a significant role in water transport and reduction of cooking time. IR treatment increased rehydration rates and degree of swelling on pinto bean[Citation48] and durum wheat.[Citation49] Similar results on the alteration of starch granules by micronization have been reported in cow peas.[Citation50] Gelatinization of starch during cooking of legumes is a very important phenomenon that has a positive correlation with the texture of cooked seeds.[Citation51] Starch gelatinization and protein denaturation during microwave heating of wheat is also reported by Dolińska et al.[Citation52]
Figure 4. The SEM micrographs of untreated and microwave (18% m.c., 600 W, and 56 s treated) A: chickpea and B: mung bean.
Conclusions
This work is the first detailed study of the effect of microwave treatment on the cooking and macronutrients qualities of different pulses. Microwave treatment has significantly reduced cooking time of all pulses. Lowest cooking time was observed at 600 W, 56 s, and 18% m.c. for chickpea and pigeon pea and at 600 W, 56 s, and 14% m.c. for red lentil, mung bean, and pinto bean. The FTIR spectroscopy is a fast method to determine the macronutrients composition of pulses and the nature of protein’s secondary structures. Results obtained from the FTIR spectra of pulse samples with and without microwave treatments showed macronutrients composition differences between pulses and that microwave treatments have induced extensive changes to the protein secondary structures specifically the β-sheets in all pulses. The SEM results of chickpea and mung bean showed that fissures developed in the seed coat and cotyledon, and gelatinization of starch could help to improve water uptake during the cooking process, thus reducing cooking time of pulses.
Disclosures and Author Contributions
The authors declare that they have no competing interests. MTD, CK, and DSJ did the conceptual design of the study and the experimental setup and methods. MTD and CK performed the experiments. CK, RL, SK, and VC were involved in the data analysis and the writing work. XL and FB helped in FTIR setup and data collection. CK, SS, and DSJ supervised the work. All authors read and approved the final manuscript.
Acknowledgments
We acknowledge the kind help from Mr. Andre Dufresne from the Department of Biological Sciences, University of Manitoba for the help in sample preparation and data collection of SEM samples and mid-IR beamline staff Dr. Tim May for the technical help during the work.
Funding
Funding for this work was supported by the Manitoba Innovation, Energy, and Mines and Ministry of Food Processing Industries, India. Part of the research described in this article was performed at the Canadian Light Source and which is funded by the Canada Foundation for Innovation, the Natural Sciences and Engineering Research Council of Canada, the National Research Council Canada, the Canadian Institutes of Health Research, the Government of Saskatchewan, Western Economic Diversification Canada, and the University of Saskatchewan.
Additional information
Funding
References
- Deshpande, S.S. Food Legumes in Human-Nutrition—APersonal Perspective. Critical Reviews in Food Science and Nutrition 1992, 32(4), 333–363.
- Randhir, R.; Shetty, K. Microwave-Induced Stimulation of l-DOPA, Phenolics, and Antioxidant Activity in Fava Bean (Vicia Faba) for Parkinson’s Diet. Process Biochemistry 2004, 39(11), 1775–1784.
- Tharanathan, R.N.; Mahadevamma, S. Grain Legumes—A Boon to Human Nutrition. Trends Food Science and Technology 2003, 14(12), 507–518.
- Iqbal, A.; Khalil, I.A.; Ateeq, N.; Khan, M.S. Nutritional Quality of Important Food Legumes. Food Chemistry 2006, 97(2), 331–335.
- Siddhuraju, P.; Makkar, H.P.S.; Becker, K. The Effect of Ionising Radiation on Antinutritional Factors and the Nutritional Value of Plant Materials with Reference to Human and Animal Food. Food Chemistry 2002, 78(2), 187–205.
- Bhat, R.; Karim, A.A. Impact of Radiation Processing on Starch. Comprehensive Reviews in Food Science and Food Safety 2009, 8(2), 44–58.
- Mullin, J. Microwave Processing. In New Methods of Food Preservation; Gould, G.W.; Ed.; Springer: Dordrecht, Netherlands, 1995; 112–134.
- Shivhare, U.; Raghavan, V.; Bosisio, R.; Giroux, M. Microwave Drying of Soybean at 2.45 Ghz. The Journal of Microwave Power & Electromagnetic Energy 1993, 28(1), 11–17.
- Yu, Y.; Wang, J. Effect of Gamma-Ray Irradiation on Starch Granule Structure and Physicochemical Properties of Rice. Food Research International 2007, 40(2), 297–303.
- Arntfield, S.D.; Scanlon, M.G.; Malcolmson, L.J.; Watts, B.M.; Cenkowski, S.; Ryland, D.; Savoie, V. Reduction in Lentil Cooking Time Using Micronization: Comparison of 2 Micronization Temperatures. Journal of Food Science 2001, 66(3), 500–505.
- Cenkowski, S.; Sosulski, F.W. Cooking Characteristics of Split Peas Treated with Infrared Heat. Transactions of the ASAE 1998, 41(3), 715–720.
- Mwangwela, A.M.; Waniska, R.D.; Minnaar, A. Hydrothermal Treatments of Two Cowpea (Vigna Unguiculata L. Walp) Varieties: Effect of Micronisation on Physicochemical and Structural Characteristics. Journal of the Science of Food and Agriculture 2006, 86(1), 35–45.
- Dronachari, M.; Yadev, B.K. Application of Microwave Heat Treatment in Processing of Pulses. Journal of Academia and Industrial Research 2015, 3(9), 401–406.
- Griffiths, P.R; De Haseth, J.A. Fourier Transform Infrared Spectrometry; Wiley-Interscience: Hoboken, 2007; 560.
- Yu, P.Q.; Christensen, C.R.; Christensen, D.A.; McKinnon, J.J. Ultrastructural-Chemical Makeup of Yellow-Seeded (Brassica Rapa) and Brown-Seeded (Brassica Napus) Canola Within Cellular Dimensions, Explored with Synchrotron Reflection FTIR Microspectroscopy. Canadian Journal of Plant Science 2005, 85(3), 533–541.
- Yu, P.Q.; McKinnon, J.J.; Christensen, C.R.; Christensen, D.A. Imaging Molecular Chemistry of Pioneer Corn. Journal of Agricultural and Food Chemistry 2004, 52(24), 7345–7352.
- Yu, P.Q.; McKinnon, J.J.; Christensen, C.R.; Christensen, D.A. Using Synchrotron Transmission FTIR Microspectroscopy as a Rapid, Direct, and Nondestructive Analytical Technique to Reveal Molecular Microstructural-Chemical Features Within Tissue in Grain Barley. Journal of Agricultural and Food Chemistry 2004, 52(6), 1484–1494.
- Wetzel, D.L.; Srivarin, P.; Finney, J.R. Revealing Protein Infrared Spectral Detail in a Heterogeneous Matrix Dominated by Starch. Vibrational Spectrosccopy 2003, 31(1), 109–114.
- ASABE. Moisture Measurements—Unground Grain and Seeds. ASAE S532.2; American Society of Agricultural and Biological Engineers: St. Joseph, MI, 2008.
- Wang, N.; Hatcher, D.W.; Tyler, R.T.; Toews, R.; Gawalko, E.J. Effect of Cooking on the Composition of Beans (Phaseolus Vulgaris L.) and Chickpeas (Cicer Arietinum L.). Food Research International 2010, 43(2), 589–594.
- Sashikala, V.B.; Narasimha, H.V. An Objective Method and a Device for Determining the End Point of Cooking of Dhal and Rice. International Journal of Food Properties 2010, 13(4), 877–889.
- Carbonaro, M.; Maselli, P.; Dore, P.; Nucara, A. Application of Fourier Transform Infrared Spectroscopy to Legume Seed Flour Analysis. Food Chemistry 2008, 108(1), 361–368.
- Moscoso, W.; Bourne, M.C.; Hood, L.F. Relationships Between the Hard-to-Cook Phenomenon in Red Kidney Beans and Water Absorption, Puncture Force, Pectin, Phytic Acid, and Minerals. Journal of Food Science 1984, 49(6), 1577–1583.
- Purohit, P.; Jayas, D.S.; Chelladurai, V.; Yadav, B.K. Microwave Treatment of Mung Bean (Vigna Radiata) for Reducing the Cooking Time. Applied Engineering in Agriculture 2013, 29(4), 547–556.
- Kayitesi, E.; Duodu, K.G.; Minnaar, A.; de Kock, H.L. Effect of Micronisation of Pre-Conditioned Cowpeas on Cooking Time and Sensory Properties of Cooked Cowpeas. Journal of the Science of Food and Agriculture 2013, 93(4), 838–845.
- Bellido, G.G.; Arntfield, S.D.; Scanlon, M.G.; Cenkowski, S. The Effect of Micronization Operational Conditions on the Physicochemical Properties of Navy Beans (Phaseolus Vulgaris L.). Journal of Food Science 2003, 68(5), 1731–1735.
- Mubarak, A.E. Nutritional Composition and Antinutritional Factors of Mung Bean Seeds (Phaseolus Aureus) as Affected by Some Home Traditional Processes. Food Chemistry 2005, 89(4), 489–495.
- Xin, H.; Khan, N.A.; Falk, K.C.; Yu, P. Mid-Infrared Spectral Characteristics of Lipid Molecular Structures in Brassica Carinata Seeds, Relationship to Oil Content, Fatty Acid, and Glucosinolate Profiles, Polyphenols, and Condensed T=Tannins. Journal of Agricultural and Food Chemistry 2014, 62(32), 7977–7988.
- Nobile, C.G.M.; Carreras, J.; Grosso, R.; Inga, M.; Silva, M.; Aguilar, R.; Allende, M.J.; Badini, R.; Martinez, M.J. Proximate Composition and Seed Lipid Components of “Kabuli”-Type Chickpea (Cicer Arietinum L.) from Argentina. Agricultural Sciences 2013, 14(12), 729–737.
- Wetzel, D.L.; Eilert, A.J.; Pietrzak, L.N.; Miller, S.S.; Sweat, J.A. Ultraspatially-Resolved Synchrotron Infrared Microspectroscopy of Plant Tissue in Situ. Cellular and Molecular Biology 1998, 44(1), 145–168.
- Pietrzak, L.N.; Miller, S.S. Microchemical Structure of Soybean Seeds Revealed in Situ by Ultraspatially Resolved Synchrotron Fourier Transformed Infrared Microspectroscopy. Journal of Agricultural and Food Chemistry 2005, 53(24), 9304–9311.
- Yu, P.; Meier, J.A.; Christensen, D.A.; Rossnagel, B.G.; McKinnon, J.J. Using the NRC-2001 Model and the DVE/OEB System to Evaluate Nutritive Values of Harrington (Malting-Type) and Valier (Feed-Type) Barley for Ruminants. Animal Feed Science and Technology 2003, 107(1–4), 45–60.
- Capron, I.; Robert, P.; Colonna, P.; Brogly, M.; Planchot, V. Starch in Rubbery and Glassy States by FTIR Spectroscopy. Carbohydrate Research 2007, 68(2), 249–259.
- vanSoest, J.J.G.; Tournois, H.; deWit, D.; Vliegenthart, J.F.G. Short-Range Structure in (Partially) Crystalline Potato Starch Determined with Attenuated Total Reflectance Fourier-Transform IR Spectroscopy. Carbohydrates Research 1995, 279, 201–214.
- Mathlouthi, M.; Koenig, J.L. Vibrational-Spectra of Carbohydrates. Advances in Carbohydrate Chemistry and Biochemistry 1986, 44, 7–89.
- Wilson, R.H.; Goodfellow, B.J.; Belton, P.S. Fourier Transform Infrared Spectroscopy for the Study of Food Biopolymers. Food Hydrocolloid 1988, 2(2), 169–178.
- Kacurakova, M.; Capek, P.; Sasinkova, V.; Wellner, N.; Ebringerova, A. FT-IR Study of Plant Cell Wall Model Compounds: Pectic Polysaccharides and Hemicelluloses. Carbohydrate Research 2000, 43(2), 195–203.
- Kacurakova, M.; Mathlouthi, M. FTIR and Laser-Raman Spectra of Oligosaccharides in Water: Characterization of the Glycosidic Bond. Carbohydrates Research 1996, 284(2), 145–157.
- Christy, A.A.; Egeberg, P.K. Quantitative Determination of Saturated and Unsaturated Fatty Acids in Edible Oils by Infrared Spectroscopy and Chemometrics. Chemometrics and Intelligent Laboratory Systems 2006, 82(1–2), 130–136.
- Chung, H-J.; Liu, Q.; Hoover, R. Impact of Annealing and Heat-Moisture Treatment on Rapidly Digestible, Slowly Digestible, and Resistant Starch Levels in Native and Gelatinized Corn, Pea, and Lentil Starches. Carbohydrate Research 2009, 75(3), 436–447.
- Grundas, S.; Warchalewski, J.R.; Dolinska, R.; Gralik, J. Influence of Microwave Heating on Some Physicochemical Properties of Wheat Grain Harvested in Three Consecutive Years. Cereal Chemistry 2008, 85(2), 224–229.
- Pinkrova, J.; Hubackova, B.; Kadlec, P.; Prihoda, J.; Bubnik, Z. Changes of Starch During Microwave Treatment of Rice. Czech Journal of Food Science 2003, 21(5), 176–184.
- Walde, S.G.; Balaswamy, K.; Velu, V.; Rao, D.G. Microwave Drying and Grinding Characteristics of Wheat (Triticum Aestivum). Journal of Food Engineering 2002, 55(3), 271–276.
- Carbonaro, M.; Nucara, A. Application of FT-IR Spectroscopy in the Assessment of Changes in the Secondary Structure of Food Proteins Taking Legumes as a Model. Amino Acids 2007, 33(3), Xlv–Xlvi.
- Carbonaro, M.; Grant, G.; Cappelloni, M. Heat-Induced Denaturation Impairs Digestibility of Legume (Phaseolus Vulgaris L. and Vicia Faba L.) 7S and 11S Globulins in the Small Intestine of Rat. Journal of the Science of Food and Agriculture 2005, 85(1), 65–72.
- Carbonaro, M.; Cappelloni, M.; Nicoli, S.; Lucarini, M.; Carnovale E. Solubility-Digestibility Relationship of Legume Proteins. Journal of Agricultural and Food Chemistry 1997, 45(9), 3387–3394.
- Deshpande, S.S.; Damodaran, S. Structure-Digestibility Relationship of Legume-7s Proteins. Journal of Food Science 1989, 54(1), 108–113.
- Abdulkadir, R.; Bargman, T.J.; Rupnow, J.H. Effect of Infrared Heat Processing on Rehydration Rate and Cooking of Phaseolus Vulgaris (Var Pinto). Journal of Food Science 1990, 55(5), 1472–1473.
- Scanlon, M.G.; Segall, K.I.; Cenkowski, S. The Stiffness Versus Porosity Relationship for Infrared-Heat Treated (Micronized) Durum Wheat Grain. In Bubbles in Food. Campbell, G.M.; Webb, C.; Pandiella, S.S.; Niranjan. K.; Eds.; American Association of Cereal Chemists: St. Paul, MN, 1999; 283–290.
- Mwangwela, A.M.; Waniska, R.D.; Minnaar, A. Hydrothermaltreatmentsof Two Cowpea (Vigna Unguiculata L. Walp) Varieties: Effect of Micronisation on Physico-Chemical and Structural Characteristics. Journal of the Science of Food and Agriculture 2006, 86, 35–45.
- Arntfield, S.D.; Scanlon. M.G.; Malcolmson, L.J.; Watts, B.; Ryland, D.; Savoie, V. Effect of Tempering and End Moisture Content on the Quality of Micronized Lentils. Food Research International 1997, 30(5), 371–380.
- Dolińska, R.; Warchalewski, J.R.; Gralik, J.; Jankowski, T. Effect of γ-Radiation and Microwave Heating of Wheat Grain on Some Starch Properties in Irradiated Grain as Well as in Grain of the Next Generation Crops. Nahrung/Food 2004, 48(3), 195–200.