
ABSTRACT
The dielectric properties (dielectric constant [ε′] and dielectric loss factor [ε″]) for three frozen meals (basil fried chicken, green curry with chicken, and congee with minced pork) were measured at frequency 2.45 GHz from –18 to 80°C. Thermal properties (thermal conductivity [k] and specific heat capacity [c]) of each food item were characterized using their composition for improving the modeling of microwave thawing process of frozen products. For all frozen meals, similar trends in the dielectric and thermal properties values were observed as a function of temperature. In all samples of frozen foods, the dielectric properties (ε′, ε″) rapidly increased with temperature for the range from –10 to 0°C. Thereafter, dielectric properties linearly increased with temperature for basil fried chicken and congee with minced pork but linearly decreased with temperature for green curry with chicken from 0 to 80°C. The dielectric properties data bases were used to calculate power reflected (Pr), power transmitted (Pt), dielectric loss tangent (tanδ), and penetration depth (dp). These parameters were related to the dielectric properties. The thermal conductivity values of all samples decreased with increasing temperature in the frozen stage and little changed after thawing. While the specific heat capacity values increased first and then do not change considerably. The temperature-dependent material properties can give insight into how the food product interacts with the incident electromagnetic radiation.
Introduction
Today, consumption behavior is changing. They are spending less time for preparing meals and are looking for quick way to prepare meals that still taste good and provide adequate nutrition.[Citation1] The frozen food offers consumers immense convenience and comfort. The frozen food is a food that has been prepared or cooked then packaged and rapidly freezing. It is normally kept at –18°C for preservation. The frozen food market in Thailand is forecast to grow at an average of 10% from 2012 to 2016.[Citation2] In addition, a highly popular food for Thai people is cooked to order meals such as basil fried chicken, fried rice, green curry, phat Thai with fresh shrimp, congee, etc.[Citation3] The frozen foods need to be thawed before using them. The easy and convenient way to thaw these foods is put in microwave oven.
Microwave heating is preferred for thawing processing over the conventional heating for the basic reason that the process is fast and require minimum come-up time to the desired process temperature. Among its important advantages, microwaves penetrate and produce heat deep within food materials (volumetric heating) that lead to fast accelerating rate, improved bacterial control and low costs. However, the non-uniform distribution of the electromagnetic field in the microwave cavity is a limitation for microwave applications in practice. The engineering design of microwave heating process needed to know the information about dielectric and thermal properties of selected foods.
Dielectric properties of food are important factors in microwave and radio frequency heating because these properties measure the interaction of the food with electromagnetic field. Dielectric properties are normally described by complex permittivity,
From the above equation, ε′ is real part which referred to dielectric constant, describes material’s ability to store electric energy in an alternating field. ε″ is an imaginary part which referred to dielectric loss factor, determines the property of the material to convert electric energy to thermal energy.
Various factors influence the dielectric properties of food materials such as frequency, ionic nature, moisture content, temperature, concentration, nature, and constituents of food materials.[Citation4] The rate of change of dielectric constant and dielectric loss factor with temperature depends on the free and bound water content of the food materials.[Citation5]
Thermal properties, including thermal conductivity and specific heat capacity, are also important input parameters for a heat transfer model. During heating and standing time, the thermal conductivity will influence the diffusion of thermal energy from hot spots to cold spots.[Citation6] While in microwave heating process, the specific heat capacity of material influences the heating rate. Especially, for frozen food, the latent heat associated with phase change will greatly influence the thawing process.[Citation7]
Many previous studies determine the dielectric and thermal properties of food materials in radio frequency and microwave frequency ranges such as fruits and vegetables,[Citation8–Citation10] chicken breast muscle,[Citation11] pork muscle,[Citation12] salmon fillets,[Citation13] macaroni and cheese dinner preparation, ground whole-wheat flour, and apple juice,[Citation14,Citation15] grape juice, and wine,[Citation16] egg whites and whole eggs,[Citation17] whey protein gel,[Citation18] meat.[Citation19,Citation20] However, there is lack of information studies on dielectric and thermal properties of composite food at 2.45 GHz over frozen temperature range to thawed state. Knowledge of dielectric and thermal properties is important to the research of RF and microwave heating in applications for thawing of frozen products.
The objectives of this study were: (1) to determine temperature-dependent dielectric properties using a portable dielectric measurement (network analyzer) at frequency of 2.45 GHz, (2) to calculate total power transmitted, power reflected, and penetration depth from dielectric properties measurements, (3) to derive predictive equations that relates dielectric properties of three Thai foods to temperature, and (4) to quantify thermal properties of three Thai frozen meals (basil fried chicken, green curry with chicken, and congee with minced pork).
Materials and methods
Samples preparation
Basil fried chicken was made from the composition of 40% chicken sliced, 55.8% of seasoning (soup stock powder, cooking oil, soy sauce, fish sauce, sugar), and 4.2% of vegetable (red chili, Holy basil, kaffir lime leaves) by weight basis. Green curry with chicken was made from the composition of 18.01% chicken sliced, 70.08% of seasoning (green curry paste, coconut milk, chicken soup stock powder, sugar, fish sauce), and 11.91% of vegetable (eggplants, red chili, Holy basil, kaffir lime leaves) by weight basis. Congee with minced pork was made from the composition of 85.20% congee, 12.30% of minced pork, and 2.5% of vegetable (dried Chinese mushroom, ginger, spring onion) by weight basis. All samples were packed into microwaveable plastic container and stored at –18°C in a freezer until used for measurement of dielectric properties.
Dielectric properties measurement
The portable dielectric measurement kit (Püschner GmbK+Co.KG, France) was used to measure dielectric properties of frozen food. The portable dielectric measurement kit allows for measurements of the complex permittivity over a wide range of solid, semi-solid, granular, and liquid materials. The dielectric properties measurement system consisted of control functions, treatment of the microwave signals, calculation, data processing, and results representation, as shown in . The software controls the microwave reflectometer to measure the complex reflection coefficient of the material under test (MUT). It then detects the cavity resonant frequency and quality factor and converts the information into the complex permittivity of the MUT. Finally, the measurement results are displayed in a variety of graphical formats, or saved to disk. The precision is not more than 2% of the dielectric constant and 5% of the dielectric loss factor.
Figure 1. Portable dielectric measurement (network analyzer).
The instrument was warmed up for at least 30 min before the calibration and measurements were made. Calibration of the probe was done using air and water at 25°C. The sample was placed in a wide glass tube and the open coaxial probe was set into the tube. The sample holder was dipped into a temperature controlled water bath. The surface and internal temperature of the samples was monitor by using an infrared thermometer (Testo 845, German) and the thermocouple temperature sensor (Fluke 51 II, USA), respectively. The sample was heated from –18 to 80°C and the dielectric properties were measured while samples were at the desire temperature of –18, –10, 0, 10, 20, 30, 40, 50, 60, 70, and 80°C. The experiments were repeated three times. The results are reported at frozen and unfrozen stages as a function of temperature and at 2.45 GHz. The typical error of the dielectric properties measurements was about 5% following standard calibration procedures.
Analysis of thermal properties
In this study, the thermal properties (thermal conductivity and specific heat capacity) were calculated using mathematical models. The steps are following: (1) to send all samples to SGS (Thailand) Limited Laboratory Services for measuring their nutritional values, (2) to calculate the thermal properties of food components (including protein, fat, carbohydrate, fiber, and ash) by using the Choi and Okos equations.[Citation21] They developed mathematical models for predicting the thermal properties of food components as functions of temperature in the range of –40 to 150°C. They also developed models for predicting the thermal properties of water and ice, and (3) to determine thermal properties of foods by using the parallel model given by Murakami and Okos.[Citation22] The density of the sample was estimated by knowing the density of the
th component and
the mass fraction of the
th component using the formula:
where is the number of different components. The thermal conductivity for a food material with
components was calculated from the weighted average of the thermal conductivity of the
th component
:
where is the volume fraction of the
th component, which was calculated by:
The specific heat of food material with components can be estimated by the following equation:
where is the specific heat of the
th component in food matrix. In the case of frozen food, the thermal properties of the ice and liquid water mix are calculated first. In this study, the ratio of ice and water is 50:50 at a temperature of 0°C. The resulting thermal properties of ice or water mix are then combined successively with the thermal properties of each remaining food constituent to determine the thermal properties of the food product.
Results and discussion
In this study, the results are shown as a function of temperature over frozen temperature range to thawed state and performed on three different materials. Therefore, all properties are discussed in two periods: frozen state (–18 to 0°C) and thawed state (0 to 80°C). Measured values of dielectric constant and dielectric loss factor as function of temperature are shown in and . Calculated properties from dielectric properties data bases, namely, power reflected, power transmitted, and dielectric loss tangent, are shown in and the penetration depth is displayed . Other important properties for analysis microwave heating process as thermal properties (k, c) are displayed in . Finally, shows predictive equations for the dielectric properties of frozen meals as a function of temperature between 0 and 80°C at 2.45 GHz.
Table 1. The properties and parameter of frozen meals at 2.45 GHz.
Table 2. Thermal properties of frozen meals at 2.45 GHz.
Table 3. Predictive equations for the dielectric properties of frozen meals as a function of temperature between 0 and 80°C at 2.45 GHz.
Figure 2. Change of dielectric constant of frozen meals as a function of temperature at 2.45 GHz.
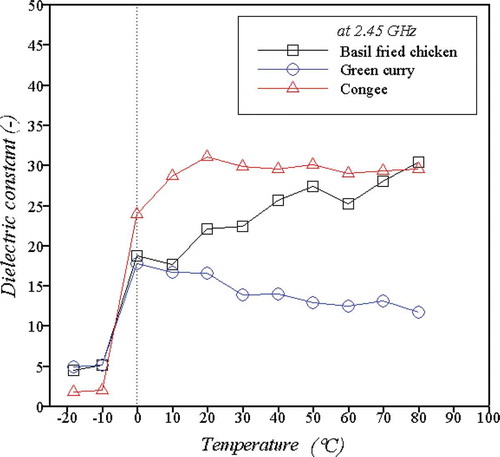
Figure 3. Change of dielectric loss factor of frozen meals as a function of temperature at 2.45 GHz.
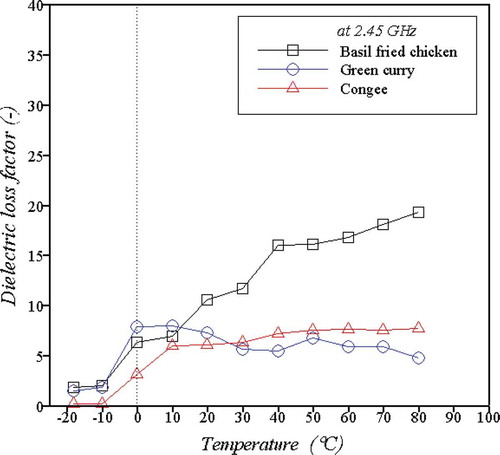
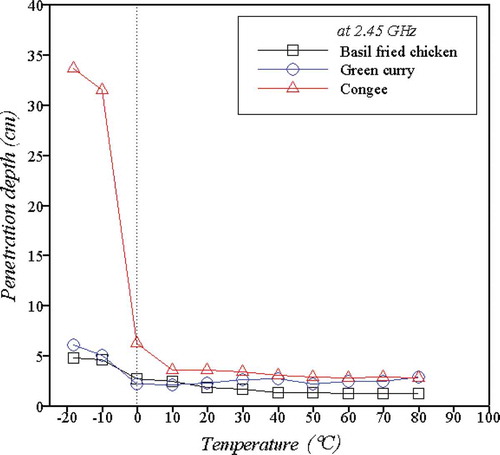
Figure 4. Penetration depths of frozen meals as a function of temperature at 2.45 GHz.
Dielectric properties (ε′ and ε″)
and show the changing of dielectric constant (ε′) and dielectric loss factor (ε″) of three Thai frozen foods between –18°C and 80°C at 2.45 GHz, respectively. In the region of –10 to 0°C, ε′ and ε″ both value were significantly higher in this region than at measured temperatures of –18 to –10°C for all sample. From 0 to 80°C, dielectric properties (ε′ and ε″) linearly increased for basil fried chicken and congee with minced pork but linearly decreased for green curry with chicken. In addition, it was observed that ε′ of congee with minced pork was a higher value than ε′ of basil fried chicken but ε″ of congee with minced pork was lower values than ε″ of basil fried chicken. In other words, congee with minced pork highly stored electrical energy but low changed into heat. This is because effect of higher ice and water content of congee.
For basil fried chicken, ε′ increased from 4.45 (at –18°C) to 30.33 (at 80°C) when there was the difference between the two temperatures about 26. While ε″ increased from 1.76 (at –18°C) to 19.24 (at 80°C). It can be concluded that the high salt content from seasoning, including soup stock powder, soy sauce, fish sauce made ε′ and ε″ increased due to ion polarization. Finally, a green curry with chicken, the dielectric properties steadily increased with increasing temperature in frozen stage (ε′ = 4.88; ε″ = 1.43 at –18°C) but moderately decreased in the unfrozen stage (ε′ = 17.67; ε″ = 7.84 at 0°C and ε′ = 11.69; ε″ = 4.72 at 80°C). The reduction in the observed dielectric properties of the green curry with chicken may have been caused by high fat or lipid products, such as coconut milk or cooking oil.[Citation23,Citation24]
Penetration depth (dp)
dp is an important parameter in characterizing temperature distribution in sample. It is related to the amount of power absorption passes through the product. In the other hand, the penetration depth is generally used to select approximate thickness of food inside packages to ensure a relatively uniform dielectric heating process. The dp values were calculated using the following equation;[Citation25]
where dp is the penetration depth (m); λ0 is free space microwave wavelength (m) and equals to 0.122 m at 2.45 GHz. shows microwave penetration depths for three frozen meals at 2.45 GHz. At frozen temperature (–18°C), the penetration depth was fairly large (4.74 cm for basil fried chicken, 6.05 cm for green curry with chicken, and 33.58 cm for congee with minced pork at 2.45 GHz), then it dramatically decreased at thawed temperature (2.71 cm for basil fried chicken, 2.13 cm for green curry with chicken, and 6.18 cm for congee with minced pork at 2.45 GHz and 0°C). The results of the penetration depth calculated in this research agreed reasonably well with the previous published literatures. In general, penetration depths were reduced by about one-half when the temperature was increased from –20 to 100°C at frequencies from 300 to 3000 MHz.[Citation26]
The dramatically changing in penetration depth between the frozen and thawed states of sample directly influenced the heating uniformity and caused thermal runaway. This is because of the low penetration depth at higher temperature, edge heating may be severe. Thus, the thickness of food products should be considered in food design. For example, the thickness of food materials in radio-frequency pasteurization process should be not more two or three time the penetration depth.[Citation27] For multi-compartment frozen foods, it is design to vary the thickness of the food in each compartment depending on the dielectric properties of the product in order to uniformity heating of foods in all compartments.
Percentage of microwave power (Pr, Pt)
Power reflected and power transmitted values for three frozen foods were shown in . The equations used for calculation these powers given by Buffer[Citation25] are, respectively, defined as:
Trends in the relationship between Pr and composition were largely in line with those reported for ε′ because the strong relationship between these values and measured of ε′.[Citation20] Over the range of –18 to 0°C, Pt was higher than Pr. While Pt and Pr values were no significant different at 0 to 80°C. This can explain the higher power reflected found for the sample with higher ε′ values.
Thermal conductivity (k)
The temperature-dependent thermal conductivities of all samples are showed and listed in . The k-values of all samples calculated at 80°C were higher than those at 10 to 70°C. However, values at –10°C were significantly higher than values at 80°C. In other words, in the frozen temperature range, the thermal conductivity decreased with increasing temperature due to the decreasing of ice fraction. After then, in the thawed temperature range, the thermal conductivities did not change considerably. This trend was similarly reported in many previous researches.[Citation27–Citation32] Basil fried chicken and green curry with chicken both have slightly lower thermal conductivity values than those of congee with minced pork due to low ice and water content.
The thermal conductivity difference between frozen and thawed materials will influence the temperature distribution in food during microwave heating process. The heating rate is lower at frozen state because the dielectric properties are low. Then, some part of frozen food is thawed, the heating rate increases due to higher dielectric loss factor. The low thermal conductivity of the thawed layer will delay the heat transfer between unfrozen and frozen materials. Therefore, these phenomena lead to hot spots in foods and results in greater non-uniform heating.
Specific heat capacity (c)
The specific heat capacities of all meals as a function of temperature from –18 to 80°C are shown in . All samples displayed the same trend. From –18 to –10°C, the c-values increased slightly from about 1.44 to 1.48 kJkg−1 C−1 for basil fried chicken, from 1.51 to 1.55 kJkg−1°C−1 for green curry with chicken, and from 1.93 to 1.97 kJkg−1 C−1 for congee with minced pork. From –10 to 10°C, the specific heat capacities of the three samples increased sharply and then (10 to 80°C) increased slightly. The c-values increased sharply represent the phase change from frozen to thawed state. After thawed state (0 to 80°C), the specific heat capacities of the three samples increased slowly until the temperature reached the second phase change of vaporization at around 100°C. This delay in rising temperature also affects to the non-uniformity of microwave thawing process.
The latent heat of fusion for basil fried chicken, green curry with chicken, and congee with minced pork was calculated as 201.4, 224.8, 295.3 kJkg−1, respectively. These properties are critical input parameters for a microwave heat transfer model, which can be used by food scientist in developing new product that minimize non uniform heating during heating in a domestic microwave oven.
Regression analysis
Polynomial equations were developed for dielectric properties (ε′,ε″) at 2.45 GHz over temperature range 0 to 80°C by using regression calculations. Three frozen meals also achieved by using this method. The results are listed in . The regression equations and all the predictors in the equations had a significance of p < 0.001 and the adjusted coefficients of determination, values, were used to indicate how well data fit a statistical model. From the table, significant polynomial relationships were found for all combinations and can be used to predict the raw dielectric properties data for frozen foods (including basil fried chicken, green curry with chicken, and congee with minced pork) and incorporated into computer simulation model needed to study the coupled dielectric heating and heat transfer process.
Conclusion
The temperature-dependent dielectric and thermal properties of the three frozen foods were studied at frequency 2.45 GHz and temperature from –18 to 80°C. In the frozen temperature range, dielectric, and thermal properties both rapidly changed with increasing temperature. And then, at thawed temperature range, those properties slightly varied with temperature. For these samples, the penetration depths at 2.45 GHz were about five times decreased for temperature between –18 and 80°C. The regression equations for predicting dielectric constant and dielectric loss factor at various temperatures of the three frozen foods were developed. These prediction equations fit well with experimental data. This work shows an important input parameters for a microwave heat transfer model. However, further work and measured thermal properties will need to be studied to confirm this.
Funding
The authors gratefully acknowledge the Thailand Research Fund under the project no. TRG5780223 and the National Research Universities Project of the Higher Education Commission for supporting this research.
Additional information
Funding
References
- Than, O. Frozen Food in Thailand for 2015; Thansettakij News: Bangkok, 2012.
- Poll, A. Consumer Behavior on Ready to Eat Frozen Meals in Bangkok; ABAC Poll Thailand: Bangkok, 2012.
- Ahlgren, M.K.; Gustafsson, I.; Hall, G. The Impact of the Meal Situation on the Consumption of Ready Meals. International Journal of Consumer Studies 2005, 29(6), 485–492.
- Ramaswamy, J.H.; Raghavan, V. Dielectric Properties of Indian Basmati Rice Flour Slurry. Journal of Food Engineering 2007, 80(4), 1125–1133.
- Calay, R.; Newborough, M.; Probert, D.; Calay, P. Predictive Equations for the Dielectric Properties of Foods. International Journal of Food Science & Technology 1994, 29(6), 699–713.
- Ayappa, G.; Davis, H.; Davis, E.; Gordon, J. Analysis of microwave heating of materials with temperature-dependent properties. AIChE Journal 1991, 37(3), 313–322.
- Basak, T.; Ayappa, K. Influence of Internal Convection During Microwave Thawing of Cylinders. AIChE Journal 2001, 47(4), 835–850.
- Guo, W.; Zhu, X.; Nelson, S.; Yue, R.; Liu, H.; Liu, Y. Maturity Effects on Dielectric Properties of Apples from 10 to 4500 MHz. LWT–Food Science and Technology 2011, 44(1), 224–230.
- Tran, V.; Stuchly, S.; Kraszewski, A. Dielectric Properties of Selected Vegetables and Fruits 0.1–10.0 GHz. Journal of Microwave Power and Electromagnetic Energy 1984, 19(4), 251–258.
- Zhuang, H.; Nelson, S.; Trabelsi, S.; Savage, E. Dielectric Properties of Uncooked Chicken Breast Muscles from Ten to One Thousand Eight Hundred Megahertz. Poultry Science 2007, 86(11), 2433–2440.
- Wang, Y.; Tang, J.; Rasco, B.; Kong, F.; Wang, S. Dielectric Properties of Salmon Fillets as a Function of Temperature and Composition. Journal of Food Engineering 2008, 87(2), 236–246.
- Nelson, S.; Bartley, P. Measuring Frequency and Temperature Dependent Dielectric Properties of Food Materials. Transactions of the ASAE 2000, 43(6), 1733–1736.
- Nelson, S.; Bartley, P. Frequency and Temperature Dependence of the Dielectric Properties of Food Materials. Transactions of the ASAE 2002, 45(4), 1223–1227.
- Garcia, A.; Torres, J.; Blas, M.; Francisco, A.; Illanes, R. Dielectric Characteristics of Grape Juice and Wine. Biosystems Engineering 2004, 88(3), 343–349.
- Wang, J.; Tang, J.; Wang, Y.; Swanson, B. Dielectric Properties of Egg Whites and Whole Eggs as Influenced by Thermal Treatments. LWT–Food Science and Technology 2009, 42(7), 1204–1212.
- Wang, Y.; Wig, T.; Tang, J.; Hallberg, L. Dielectric Properties of Foods Relevant to RF and Microwave Pasteurization and Sterilization. Journal of Food Engineering 2003, 57(3), 257–268.
- [Zhang, L.; Lyng, J.; Brunton, N.; Morgan, D.; McKenna, B. Dielectric and Thermophysical Properties of Meat Batters over a Temperature Range of 5–85°C. Meat Science 2004, 68(2), 173–184.
- Lyng, J.; Zhang, L.; Brunton, N. A Survey of the Dielectric Properties of Meats and Ingredients Used in Meat Product Manufacture. Meat Science 2005, 69(4), 589–602.
- Meléndez, R.; Morales, M.; Cervantes, J.; Chávez, A. Dielectric Properties of Beans at Different Temperatures and Moisture Content in the Microwave Range. International Journal of Food Properties 2016, 19(3), 564–577.
- Ngadi, M.; Dev, S.; Raghavan, V.; Kazemi, S. Dielectric Properties of Pork Muscle. International Journal of Food Properties 2015, 18(1), 12–20.
- Choi, Y.; Okos, M. Effects of Temperature and Composition on the Thermal Properties of Foods. Korean Journal of Food Science and Technology 1986, 18(5), 357–363.
- Murakami, E.G.; Okos, M.R. Measurement and Prediction of Thermal Properties of Foods. Food Properties and Computer-Aided Engineering of Food Processing Systems 1989, 168, 3–48.
- Ryynänen, S. The electromagnetic properties of food materials: a review of the basic principles. Journal of Food Engineering 1995, 26(4), 409–429.
- Lyng, J.; Scully, M.; McKenna, B.; Hunter, A.; Molloy, G. The Influence of Compositional Changes in Beef Burgers on Their Temperatures and Their Thermal and Dielectric Properties During Microwave Beating. Journal of Muscle Foods 2002, 13(2), 123–142.
- Buffler, C. Dielectric Properties of Foods and Microwave Materials. In Microwave Cooking and Processing; Van Nostrant Reinhold: New York, NY, 1993; 46–49.
- Chen, J.; Pitchai, K.; Birla, S.; Gonzalez, R.; Jones, D.; Subbiah, J. Temperature Dependent Dielectric and Thermal Properties of Whey Protein Gel and Mashed Potato. Transactions of the ASABE 2013, 56(6), 1457–1467.
- Schiffmann, R. Microwave and Dielectric Drying. In Handbook of Industrial Drying (3rd ed.); Mujumdar, A.S.; (Ed.); Marcel Decker, Inc.: New York, NY, 1995; 286–352.
- Miyawaki, O.; Pongsawatmanit, R. Mathematical Analysis of the Effective Thermal Conductivity of Food Materials in the Frozen State. Bioscience, Biotechnology, and Biochemistry 1994, 58(7), 1222–1225.
- Tuladhar, T.; Paterson, W.; Wilson, D. Thermal Conductivity of Whey Protein Films Undergoing Swelling: Measurement by Dynamic Gauging. Food and Bioproducts Processing 2002, 80(4), 332–339.
- Willix, J.; Lovatt, S.; Amos, N. Additional Thermal Conductivity Values of Foods Measured by a Guarded Hot Plate. Journal of Food Engineering 1998, 37(2), 159–174.
- Fasina, O.; Farkas, B.; Fleming, H. Thermal and Dielectric Properties of Sweetpotato Puree. International Journal of Food Properties 2003, 6(3), 461–472.
- Kumcuoglu, S.; Tavman, S.; Nesvadba, P.; Tavman, I. Thermal Conductivity Measurements of a Traditional Fermented Dough in the Frozen State. Journal of Food Engineering 2007, 78(3), 1079–1082.