
Abstract
In this article, Chinese quince (Cydonia oblonga Miller) freshness determination method was investigated using surface acoustic wave resonator, electronic nose, and surface acoustic wave resonator combined with electronic nose. Human sensory evaluation and weight loss index were examined as freshness reference. Results indicated that quince freshness decreased during storage procedure. Surface acoustic wave resonator output frequency and electronic nose measurement data stochastic resonance signal-to-noise ratio Eigen values characterized quince quality under different storage time. Freshness predictive models were developed using surface acoustic wave resonator frequency, electronic nose signal-to-noise ratio spectrum Eigen values, and their hybrid model. Validating experiments results demonstrated that the hybrid predictive model presented higher predicting accuracy (R2 = 0.987) than other two models. The proposed method is promising in fruit quality rapid analysis.
INTRODUCTION
Chinese quince (Cydonia oblonga Miller), is named Lingnan fruit king for its particular nutritional contents (such as sugars, crude fibers, organic amino acids, and minerals), attractive fragrance, and delicious taste.[Citation1,Citation2] Its unique functions, such as sweet taste, stomach nourishing, and spleen fortifying, have been confirmed.[Citation3,Citation4] Quince can also be used in drugs. It contributes to weight loss as well as promoting the secretions of breast hormones. However, it is highly perishable after harvest due to environmental factors (such as humidity, temperature, and respiratory metabolism).[Citation2,Citation5] Quality decline of quinces brings huge economic losses to farmers every year. Previous reports mainly focus on changes in antioxidant properties and storage stability,[Citation1] quality comparison between different cultivars,[Citation2] quality preservation after harvest,[Citation6] and other areas.[Citation7–Citation14] Little information about quince freshness rapid determination has been reported. A reliable quince freshness rapid determination technique is badly needed.
Non-destructive analysis techniques, such as visible/near infrared (VIS/NIR) spectroscopy, surface acoustic wave (SAW), and some electronic detection devices (electronic noise; EN, and electronic tongue [e-tongue]), have been applied in fruits and vegetables quality analysis.[Citation15–Citation19] Clark et al. proposed quality predictive models for kiwifruit dry matter, soluble solids content, and flesh color using VIS/NIR spectroscopy combined with canonical discriminant analysis (CDA).[Citation20] Russo et al. studied red onion ecotypes flavor evaluation by means of EN and discriminant function analysis (DFA).[Citation21] Campos et al. successfully discriminated grape ripeness in different cultivars using voltammetric e-tongue combined with principal component analysis (PCA). Besides, total acidity and sugar content predictive models were developed using e-tongue combined with partial least squares (PLS) regression.[Citation22] Hong et al. proposed a new method for adulteration of cherry tomato juices using EN and e-tongue. Meanwhile, pH and soluble solids content predictive models based on fusion approaches showed higher forecasting accuracy than the models using sole usage of EN or e-tongue.[Citation23]
However, not all these approaches are suitable for practical applications. VIS/NIR spectroscopy is suitable for laboratory analysis.[Citation24,Citation25] E-tongue is fast, simple, and reliable, but it is limited in sensitivity.[Citation23,Citation26] The detecting objective of EN technique is the gases emitted by the samples. This technique has diverse applications in chemical analysis,[Citation27–Citation29] food examination,[Citation30–Citation32] and clinical medicine.[Citation33,Citation34] SAW technique developed fast with the development of materials science and electrical engineering in recent years.[Citation35–Citation37] Previous reports with SAW mainly focus on physical research, odor sensing, and bacteria growth monitoring.[Citation38–Citation41]
In this article, Chinese quince freshness determination method using surface acoustic wave resonator (SAWR) combined with EN was investigated. Human sensory evaluation (HSE) and weight loss index were examined. SAWR output frequency and EN measurement data were measured. Freshness predictive models were developed using SAWR frequency, EN signal-to-noise ratio (SNR) Eigen values, and their hybrid model. Results indicated that the hybrid predictive model had higher predicting accuracy.
MATERIALS AND METHODS
Quince Samples
Fresh quince samples, in the same size and maturity degree, were bought from Gouzhuang fruit wholesale market (Hangzhou, Zhejiang). All samples were free of any pretreatment or any mechanical damage. After transporting to laboratory, samples were stored at 4℃. Each day, 20 samples were randomly taken for HSE, weight loss, SAWR, and EN measurement. Experiments lasted for 11 days. One hundred new samples were stored at the same storage condition for the validating experiments. All experiments were conducted under room temperature and standard atmospheric pressure.
HSE
HSE has been widely applied in food quality assessment. In this research, sensory evaluation is conducted by six experienced panelists. Voting number is set at k, k∈(1,10). The quality of quince is divided into m levels and the score of a specific level is set at h, j∈(1,m). Quince attributes are divided into n elements, and a specific element is set at u
, i∈(1, n). The contributory weight is determined by pairwise comparison of contribution weight of attributes is set at xi (∑xi=1). If there is a specific relationship between two objects of h
and u
, the relation set (matrix) of f is calculated as follows:
The overall acceptability of quince is calculated by the weight grade method as follows:
Sensory evaluation scheme for quince samples is displayed in . Each index is scored from 1 to 5. The higher preference score, the better quality of quince. Scores of three are set as the limit of overall acceptable freshness.
TABLE 1 Sensory evaluation scheme for quince samples
Weight Loss
Mettler Toledo AL104 electronic balance is utilized to measure quince weight. Weight loss percentage is expressed as the percentage weight decrease respecting to the initial weight.
SAWR System and Measurement
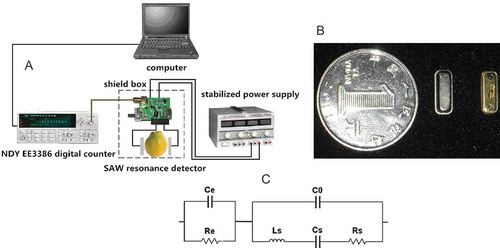
A 433 MHz SAWR is utilized for measurement. ST cut type quartz is used as the piezoelectric base material (see ). Detecting system consists of SAWR and its load circuit, DC power supply (DF1714SB3A, Ningbo CSI Electronics Co., Ltd), and universal digital counter (EE3386, Jiangsu New Union Technology Co., Ltd.; see ). Equivalent model of SAWR in serial with quince is displayed in , where Co is a static capacitor, Ls is the dynamic inductance, Cs is the dynamic capacitance, Rs is the dynamic resistance of SAWR. When quince is connected to SAWR, Ce is equivalent dynamic capacitor and Re is an equivalent dynamic resistance of sample. The frequency of SAWR loaded with quince sample can be calculated by following equation:
FIGURE 1 SAWR system: (a) schematic diagram of SAWR system; (b) detecting system; (c) equivalent model of SAWR in serial with quince sample.
In Eq. (3), SAWR’s unloaded frequency , amplification circuit phase parameter
, analyte’s conductivity
, electrode capacitance
, where
is a permittivity, and
is parasitic capacitance between wires. These parameters keep highly stable, so
,
, and
become decisive factors to oscillation frequency. So, if quinces of different quality are connected to the circuit, the changeable parameters (including
,
, and
) induce the changes in SAWR frequency. SAWR frequency measurement is performed by following procedure: Connect quince with SAWR, measure frequency value by universal digital counter, and measurement data is transferred to a desktop via RS-232 communication interface.
EN System and Measurement
EN system has three main parts: data acquisition, modulating and transmitting unit (U1), sensor array and chamber unit (U2) and power and gas supply unit (U3; see ). EN consists of eight metal oxide semiconductors (MOS) gas sensors with different sensitive species. The selectivity toward volatile compound classes of MOS sensors is indicated by the manufacturer: S1 (TGS-825, hydrogen sulfide), S2 (TGS-821, hydrogen), S3 (TGS-826, ammonia), S4 (TGS-822, ethanol, methylbenzene, xylene gas), S5 (TGS-842, hydrocarbon component gas), S6 (TGS-813, methane, and butane), S7 (TGS-2610, propane), and S8 (TGS-2201, nitrogen oxides). Sensor responses are sampled as voltage (V). The MOS sensors rely on changes in conductivity induced by the adsorption of molecules in the gas phase and on subsequent surface reactions. They consist of ceramic substrate coated by metal oxide semiconducting film, and heated by wire resistor. Due to the high temperature (250–500oC), the volatiles transferred to the surface of the sensors are totally combusted to carbon dioxide and water, leading to a change in the resistance. The high temperature avoids water interference and provides sensors fast response and rapid recovery time. Each sensor is installed in independent chamber to avoid cross-influence of gas flow. Polytetrafluoroethylene (PTFE) material is utilized to fabricate gas sensor chamber.
FIGURE 2 Schematic diagram of EN detecting system.
In EN measurement, quinces were placed into glass air-tight vials, and sealed with sealing membrane. When the power was on, washing pump and valve 2 were started, and sampling pump and valve 1 were close. The air was filtered by active carbon to obtain zero gas. Sensor S1~S8 were washed by zero gas. When the sensor’ response reached the baseline, the washing pump and valve 2 were closed. Then the sampling pump and valve 1 were started. The EN inhaled the headspace gases of samples through the sensor array at 400 mL/min for 40 s. The measurement interval of EN was 0.05 s. When measurement was finished, the sensors were washed by zero gas for 600 s at a flow rate of 1000 mL/min prior to the next sample measurement.
Stochastic Resonance (SR)
SR theory develops fast in recent years.[Citation18,Citation19,Citation25,Citation42–Citation44] This model realizes two functions: noise reduction and signal amplification. It has wide applications in signal processing,[Citation18,Citation19,Citation25] biochemistry research,[Citation45] and electrochemical studies.[Citation46,Citation47] SR model can be defined as following:
whereis the position of the Brownian particle,
is the time, M and C are adjustable parameters,
is an input signal
with an intrinsic noise
,
is the external noise, and
is the double-well potential with the constants
and
.
Equation (4) can be transformed as:
The minima of are located at
, where
. A potential barrier separates the minima with the height given by
. The barrier top is located at
. When three elements of SR interact coherently, the potential barrier can be reduced and the Brownian particle may surmount the energy barrier and enter another potential well. The intensity of signals will increase, which makes it possible that the weak signal can be detected from noise background. Suppose the input signal is
, where
is signal intensity,
is signal frequency.
is external noise intensity. SNR is the common quantifier for SR and it can be approximately described as:
Noise intensity is a parameter in SR model. This model is used for e-nose data analysis. denotes an input matrix. It has a sinusoid signal
, EN response data
, and intrinsic noise
. SNR between the output and input is calculated. This model has been successfully used in food analytical applications.[Citation32,Citation33] The schematic diagram of SR data analysis is displayed in .
RESULTS AND DISCUSSION
Sensory Evaluation
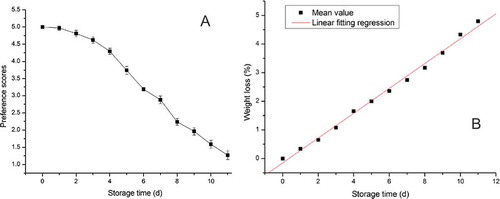
Preference scores of quince during storage are presented in . The initial score is 5, suggesting that the overall sensory acceptability of quinces is the best. With the increase of storage time, preference score decreases fast. It reaches 2.88 ± 0.11 on day 7, which is less than 3 and regarded as unacceptable. After that, it continuously decreases with the increase of storage time. Results indicate that quinces maintain acceptable freshness within 6 days. The sensory changes may be explained by the effect of enzymatic activities and storage environment (e.g., oxygen). Mirror results are reported by Legua et al.[Citation2] and Ali et al.[Citation6]
FIGURE 3 Quality examining results: (a) human sensory evaluation; (b) weight loss.
Weight Loss
displays the quince weight loss examination results during storage. With the increase of storage time, weight loss percentage of samples gradually increases, and it reached values of 5% on day 11. Linear fitting between weight loss index and storage time is conducted (). Results indicate that the weight of quinces continues to decline. The reason lies in the moisture loss and inner biochemical content changes of the samples.
Freshness Predictive Model Using SAWR
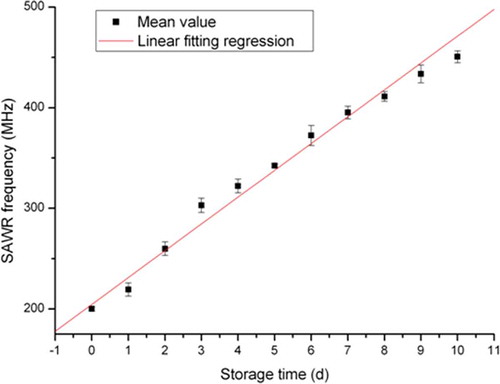
SAWR frequency measurement results are displayed in . The initial frequency is about 200 MHz. Then the frequency increases to 450 MHz on day 10. According to previous reports, quince physical/chemical indexes change fast after harvest, such as moisture loss, antioxidant capacity, and sugar/acid.[Citation2,Citation6] The changes alter the internal dielectric characteristics of samples. Due to the different dielectric characteristics of quinces under different freshness, SAWR frequency is significantly influenced when quince is in serial with SAWR circuit. According to Eq. (3), SAWR frequency increases due to a significant increase in Re and decrease in conductivity (). Although the dynamic capacitor parameter (Ce) also changes during storage, it has weak impact on SAWR frequency than Re. So change of Ce can be neglected. To evaluate relationship between SAWR frequency and quince quality, linear fitting regression between SAWR frequency and storage time are conducted. Results are displayed in and Eq. (8).
FIGURE 4 Freshness predictive model using SAWR frequency output values.
After one-step transform, Eq. (9) is used as quince freshness predictive model. The input is the frequency, and the output is the storage time.
Freshness Predictive Model Using EN
Before experiments, EN responses to blank sample are measured during the experiments to evaluate EN stability. Zero gas, obtained by filtering air using active carbon, is used as the blank sample. Results indicate that the responses of sensor array to blank sample are relatively weak (close to zero) and stable. So, sensors’ time drift has no impact on EN stability.
displays EN original responses to quinces on day 0. All sensors’ initiative responses are close to zero. Then the responses increase and reach their stable state. The sensors present different stable values. Sensor S4 has the maximal value (about 0.02 V). The volatile gases emitted by quinces are inhaled into EN gas chamber and sensed by the functional materials equipped within the sensors. The specific absorption from these materials for specific gas species induces materials’ changes in their electrical characteristics. And the responses increase with the increase of gas concentrations. EN sensor array forms different pattern signals toward samples under different storage time, and the stable responses are selected for the subsequent analysis.
FIGURE 5 EN analysis results and freshness predictive model based on EN system: (a) EN sensor array original responses to quince samples; (b) PCA score plot; (c) SR SNR spectrum; (d) freshness predictive model.
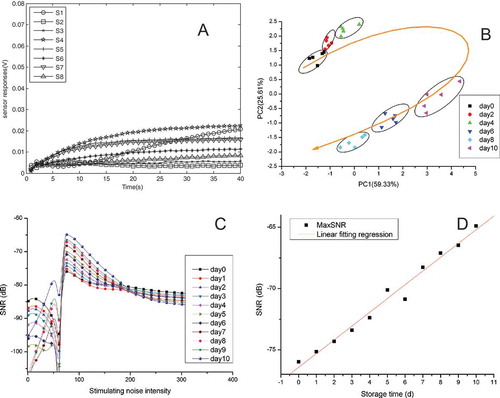
shows the projections of PCA results on a two-dimensional plane by the first two principal components. The first two principal components, PC1 and PC2, totally capture 84.94% of data variance. PC1 and PC2 first increases and then declines with the increase of storage time. The increase of storage time and day 6 was a transition point. Quinces under the same storage time gather together. Samples with different freshness can be discriminated by PCA. However, this method just provides a qualitative analysis method, not suitable for quantitative analysis. Changes in PCA score can be explained by the aroma variance from different quince samples.
Quince SR SNR spectrum as function of noise intensity is presented in . Noise intensity ranges from 0 to 400. SNR values of all curves first increase with the increase of noise intensity, and then derived vales and peaks appear before the formation of feature peaks. Feature peak located noise intensity is 80. Afterward, SNR values gradually decrease with the increase of noise intensity. Maximal SNR () values of quince samples range from –76.42 to –65.20 dB, and increase with the increase of storage time.
values discriminate all quinces under different storage time. Quince freshness predictive model is developed by linear fitting regression between
values and storage time (see and Eq. Citation10).
After one-step transform, Eq. (11) is used as the quince freshness predictive model. The input is the EN values, and the output is quinces’ storage time.
Freshness Predictive Model Using EN Combined with SAWR
SAWR characterizes quince internal quality and EN presents quince external aroma information. Whether a freshness predictive model using EN combined with SAWR presents better predicting accuracy than former two models, Eq. (12) displays the combination model. Two confidence coefficients ( and
) are used in the model. By inputting
,
, and
values into Eq. (12), the values of
and
are calculated as 0.4552 and 0.5623, respectively. Then the mixed freshness predictive model using fusion data is successfully developed after inputting the two values into Eq. (12), as displayed in Eq. (13). The input is
and
values, and the output is quinces’ storage time.
Validation Experimental Results
To evaluate the accuracy of developed freshness predictive models, validating experiments are conducted. Another 100 quinces are stored at 4°C for 11 days, and 50 samples are randomly taken out for the SAWR and EN measurements. The validation experimental results are displayed in . The regression coefficients () of the three developed models are 0.918, 0.950, and 0.987, respectively. Results demonstrate that the predictive model using EN combined with SAWR presents better forecasting accuracy.
FIGURE 6 Validation experimental results for the predictive model based on (a) SAWR system; (b) EN system; and (c) SAWR combined with EN, respectively.
CONCLUSIONS
In this article, quince freshness predicting method by using EN and SAWR was investigated. HSE and weight loss were examined to monitor the freshness change during storage. Results suggested that sample’s overall acceptability continuously decreased. Responses of SAWR and EN to quinces were synchronously measured. SAWR frequency and SR SNR spectrum feature values quantitatively discriminated quince freshness. Three freshness predicting models were developed using SAWR, EN, and EN combined with SAWR, respectively. Validation results demonstrated that the model using EN combined with SAWR exhibited better forecasting accuracy than other two models. The proposed method successfully predicted quince freshness with good accuracy. And it is promising in fruit quality rapid and non-destructive evaluation. We are carrying out a long-term plan to apply this technique to other fruit and vegetables.
FUNDING
This work is financially supported by National Natural Science Foundation of China (Grant No. 81000645, 61272313), China Postdoc Science Foundation (Grant No. 2014M551749), Natural Science Foundation of Zhejiang Province (Grant No. LQ13F030012), Scientific Research Development Project of Zhejiang A&F University (2015FR020, 2014FR071), and Young Academic Leaders Foundation in Zhejiang Province (pd2013243).
Additional information
Funding
Related Research Data
REFERENCES
- Wojdyło, A.; Teleszko, M.; Oszmiański, J. Antioxidant Property and Storage Stability of Quince Juice Phenolic Compounds. Food Chemistry 2014, 152, 261–270.
- Legua, P.; Serrano, M.; Melgarejo, P.; Valero, D.; Martínez, J.J.; Martínez, R.; Hernández, F. Quality Parameters, Biocompounds and Antioxidant Activity in Fruits of Nine Quince (Cydonia oblonga Miller) Accessions. Scientia Horticulturae 2013, 154, 61–65.
- Aneta, W.; Miroslawa, T.; Jan, O. Antioxidant Property and Storage Stability of Quince Juice Phenolic Compounds. Food Chemistry 2014, 152, 261–270.
- Przemyslaw, J.S.; Sandra, M.-P.; Antoni, S.; Ángel, A.C.-B.; Francisca, H. Quality Parameters, Bio-Compounds, Antioxidant Activity and Sensory Attributes of Spanish Quinces (Cydonia oblonga Miller). Scientla Horticulturae 2014, 165, 163–170.
- Nizar, T.; Houda, M.; Yassine, Y.; Ezzeddine, S.; Saloua, R.; Abdelhamid, K.; Nizar, N. Phytochemicals and Antioxidant Activities of Rhus Tripartitum (Ucria) Fruits Depending on Locality and Different Stages of Maturity. Food Chemistry 2014, 160, 98–103.
- Mohammad, N.; Mohebbat, F.; Seyed. A.M. Effect of Osmosis and Ultrasound Pretreatment on the Moisture Adsorption Isotherms of Quince. Food and Bioproducts Processing 2012, 90, 266–274.
- Tzempelikos, D.A.; Vouros, A.P.; Bardakas, A.V.; Filios, A.E.; Margaris, D.P. Case Studies on the Effect of the Air Drying Condictions on the Convective Drying of Quinces. Case Studies in Thermal Engineering 2014, 3, 79–85.
- Tzempelikos, D.A.; Mitrakos, D.; Vouros, A.P.; Bardakas, A.V.; Filios, A.E.; Margaris, D.P.; Numerical Modeling of Heat and Mass Transfer During Convective Drying of Cylindrical Quince Slices. Journal of Food Engineering 2015, 156, 10–21.
- Abbastabar, B.; Azizi, M.H.; Adnani, A.; Abbasi, S. Determining and Modeling Rheological Characteristics of Quince Seed Gum. Food Hydrocolloids 2015, 43, 259–264.
- Irisarri, P.; Binczycki, P.; Errea, P.; Martens, H.J.; Pina, A. Oxidative Stress Associated with Rootstock-Scion Interactions in Pear/Quince Combinations During Early Stages of Graft Development. Journal of Plant Physiology 2015, 176, 25–35.
- Ritzoulis, C.; Marini, E.; Aslanidou, A.; Georgiadis, N.; Karayannakidis, P.D.; Koukiotis, C.; Filotheou, A.; Lousinian, S.; Tzimpilis, E. Hydrocolloids from Quince Seed: Extraction, Characterization, and Study of Their Emulsifying/Stabilizing Capacity. Food Hydrocolloids 2014, 42( Part 1), 178–186.
- Jouki, M.; Yazdi, F.T.; Mortazavi, S.A.; Koocheki, A. Physical, Barrier and Antioxidant Properties of a Novel Plasticized Edible Film from Quince Seed Mucilage. International Journal of Biological Macromolecules 2013, 62, 500–507.
- Sayed, A.H.; Abdel-Tawab, H.S.; Abdel Hakeem, S.S.; Mekkawy, I.A. The Protective Role of Quince Leaf Extract Against the Adverse Impacts of Ultraviolet-A Radiation on Some Tissues of Clsrias gariepinus (Burchell, 1822). Journal of Photochemistry and Photobiology B: Biology 2013, 119, 9–14.
- Karar, M.G.E.; Pletzer, D.; Jaiswal, R.; Weingart, H.; Kuhnert, N. Identification, Characterization, Isolation and Activity Against Escherichia coli of Quince (Cydonia oblonga) Fruit Polyphenols. Food Research International 2014, 65( Part A), 121–129.
- Aboonajmi, M.; Najafabadi, T.A. Prediction of Poultry Egg Freshness Using VIS-NIR Spectroscopy with Maximum Likelihood Method. International Journal of Food Properties 2014, 17, 2166–2176.
- Giovenzana, V.; Beghi, R.; Buratti, S.; Civelli, R.; Guidetti, R. Monitoring of Fresh-Cut Valerianella locusta Laterr. Shelf Life by Electronic Nose and VIS-NIR Spectroscopy. Talanta 2014, 120, 368–375.
- Setarehdan, S.K.; Akram, A.; Nishizu, T.; Kondo, N. Prediction of Poultry Egg Freshness Using Ultrasound. International Journal of Food Properties 2014, 17, 1889–1899.
- Hui, G.H.; Wu, Y.L.; Ye, D.D.; Ding, W.W.; Zhu, L.S.; Wang, L.Y. Study of Peach Freshness Predictive Method Based on Electronic Nose. Food Control 2012, 28(1), 25–32.
- Liu, W.; Hui, G.H. Kiwi Fruit (Actinidia chinensis) Quality Determination Based on Surface Acoustic Wave Resonator Combined with Electronic Nose. Bioengineered 2015, 6(1), 53–61.
- Clark, C.J.; McGlone, V.A.; De Silva, H.N.; Manning, M.A.; Burdon, J.; Mowat, A.D. Prediction or Storage Disorders of Kiwifruit (Actinidia chinensis) Based on Visible-NIR Spectral Characteristics as Harvest. Postharvest Biology and Technology 2004, 32(2), 147–158.
- Russo, M.; di Sanzo, R.; Cefaly, V.; Carabetta, S.; Serra, D.; Fuda, S. Non-Destructive Flavour Evaluation of Red Onion (Allium cepa L.) Ecotypes: An Electronic-Nose-Based Approach. Food Chemistry 2013, 141, 896–899.
- Campos, I.; Bataller, R.; Armero, R.; Gandia, J.M.; Soto, J.; Martínez-Máñez, R.; Gil-Sánchez, L. Monitoring Grape Ripeness Using a Voltammetric Electronic Tongue. Food Research International 2013, 54, 1369–1375.
- Hong, X.Z.; Wang, J. Detection of Adulteration in Cherry Tomato Juices Based on Electronic Nose and Tongue: Comparison of Different Data Fusion Approaches. Journal of Food Engineering 2014, 126, 89–97.
- Ahmad, U.; Sutrisno, A. P. Y.; Budiastra, W.; Makino, Y.; Oshita, S.; Kawagoe, Y.; Kuroki, S.; Novita, D.D. Prediction of Hardness Development in Mangosteen Peel Using NIR Spectroscopy During Low Temperature Storage. Engineering in Agriculture, Environment and Food 2014, 7(2), 86–90.
- Liu, W.; Han, Y.Y.; Cai, Y.P.; Jin, J.J.; Hui, G.H. Penaeus orientolis Prawn Freshness Rapid Determination Method Based on Electronic Nose and Non-Linear Stochastic Resonance Technique. Bioengineered 2015, 6(1), 42–52.
- Peris, M.; Escuder-Gilabert, L. On-Line Monitoring of Food Fermentation Processes Using Electronic Noses and Electronic Tongues: A Review. Analytica Chimica Acta 2013, 804, 29–36.
- Wang, P.; Liu, Q.J.; Xu, Y.; Cai, H.; Li, Y. Olfactory and Taste Cell Sensor and Its Applications in Biomedicine. Sensors and Actuators A 2007, 139, 131–138.
- Singh, H.; Raj, V.B.; Kumar, J.; Mittal, U.; Mishra, M.; Nimal, A.T.; Sharma, M.U.; Gupta, V. Metal Oxide SAW E-Nose Employing PCA and ANN for the Identification of Binary Mixture of DMMP and Methanol. Sensors and Actuators B 2014, 200, 147–156.
- Dang, L.J.; Tian, F.C.; Zhang, L.; Kadri, C.; Yin, X.; Peng, X.W.; Liu, S.Q. A Novel Classifier Ensemble for Recognition of Multiple Indoor Air Contaminants by an Electronic Nose. Sensors and Actuators A 2014, 207, 67–74.
- Hui, G.H.; Wang, L.Y.; Mo, Y.H.; Zhang, L.X. Study of Grass Carp (Ctenopharyngodon idellus) Quality Predictive Model Based on Electronic Nose. Sensors and Actuators B 2012, 166–167, 301–308.
- Guan, B.B.; Zhao, J.W.; Lin, H.; Zou, X.B. Characterization of Volatile Organic Compounds of Vinegars with Novel Electronic Nose System Combined with Multivariate Analysis. Food Analytical Methods 2014, 7, 1073–1082.
- Huang, L.; Zhao, J.W.; Chen, Q.S.; Zhang, Y.H. Nondestructive Measurement of Total Volatile Basic Nitrogen (TVB-N) in Pork Meat by Integrating Near Infrared Spectroscopy, Computer Vision and Electronic Nose Techniques. Food Chemistry 2014, 145, 228–236.
- Wilson, A.D. Theoretical and Practical Considerations for Teaching Diagnostic Electronic-Nose Technologies to Clinical Laboratory. Procedia-Social and Behavioral Sciences 2012, 31, 262–274.
- Westenbrink, E.; Arasaradnam, R.P.; O’Connell, N.; Bailey, C.; Nwokolo, C.; Bardhan, K.D.; Covington, J.A. Development and Application of a New Electronic Nose Instrument for the Detection of Colorectal Cancer. Biosensors and Bioelectronics 2015, 67, 733–738.
- Luo, W.; Fu, Q.Y.; Deng, J.F.; Yan, G.P.; Zhou, D.X.; Gong, S.P.; Hu, Y.X. An Integrated Passive Impedance-Loaded SAW Sensor. Sensors and Actuatros B 2013, 187, 215–220.
- Yadava, R.D.S.; Verma, V.K. A Diffusion Limited Sorption–Desorption Noise Model for Polymer Coated SAW Chemical Sensors. Sensors and Actuatros B 2014, 195, 590–602.
- Rodríguez-Madrid, J.G.; Iriarte, G.F.; Araujo, D.; Villar, M.P.; Williams, O.A.; Müller-Sebert, W.; Calle, F. Optimization of AlN Thin Layers on Diamond Substrates for High Frequency SAW Resonators. Materials Letters 2012, 66, 339–342.
- Kim, J.-G.; Lee, T.-J.; Park, N.-C.; Park, Y.-P.; Park, K.-S. SAW Signal Conditioner-Based Dynamic Capacitive Sensor for High-Speed Gap Measurement. Sensors and Actuators A 2013, 189, 204–211.
- Wyszynski, B.; Sekine, M.; Nakamoto, T.; Nakaso, N.; Noguchi, K. Spherical SAW Devices with Self-Assembled Lipopolymers for Odor-Sensing. Sensors and Actuators B 2010, 144, 247–254.
- Raj, V.B.; Singh, H.; Nimal, A.T.; Tomar, M.; Sharma, M.U.; Gupta, V. Effect of Metal Oxide Sensing Layers on the Distinct Detection of Ammonia Using Surface Acoustic Wave (SAW) Sensors. Sensors and Actuators B 2013, 187, 563–573.
- Chang, K.-S.; Chang, C.-K.; Chen, C.-Y. A Surface Acoustic Wave Sensor Modified from a Wireless Transmitter for the Monitoring of the Growth of Bacteria. Sensors and Actuators B 2007, 125, 207–213.
- Benzi, R.; Sutera, A.; Vulpiana, A. The Mechanism of Stochastic Resonance. Journal of Physics A 1981, 14, L453–L456.
- Dutta, R.; Das, A.; Stocks, N.G.; Morgan, D. Stochastic Resonance-Based Electronic Nose: A Novel Way to Classify Bacteria. Sensors and Actuators B 2006, 115, 17–27.
- Gammaitoni, L.; Hanggi, P.; Jung, P.; Marchesoni, F. Stochastic Resonance. Review of Modern Physics 1998, 70, 223–287.
- Hui, G.H.; Mi, S.S.; Deng, S.P. Sweet and bitter tastants specific detection by the taste cell-based sensor. Biosensors and Bioelectronics 2012, 35, 429–438.
- Hui, G.H.; Ji, P.; Mi, S.S.; Deng, S.P. Electrochemical Impedance Spectrum Frequency Optimization of Bitter Taste Cell-Based Sensors. Biosensors and Bioelectronics 2013, 47, 164–170.
- Jin, J.J.; Zheng, G.Y.; Ge, Y.Y.; Deng, S.G.; Liu, W.; Hui, G.H. A Non-Enzyme Electrochemical Qualitative and Quantitative Analyzing Method for Glucose, D-Fructose, and Sucrose Utilizing Cu Foam Material. Electrochimica Acta 2015, 153, 594–601.