
ABSTRACT
Thermal properties of duck fatty liver (foie gras), foie gras emulsion and fatty liver fat, as well as regular duck fat, were determined as a function of temperature. Density of foie gras and foie gras fat and emulsion at 20°C was measured as 947, 836, and 928 kg/m3, respectively. Differential scanning calorimetry thermograms for foie gras fat resulted in melting points ranging from –20 to 40°C. Values for the specific heat at 65°C for the fatty liver, its emulsion and fat, and duck fat were 1.79, 2.38, 1.71, and 2.48 J/g°C, respectively. Thermal conductivity of foie gras (organ) and its emulsion at 40°C was determined as 0.330 and 0.428 W/m°C, respectively. Mathematical models based on composition and temperature were developed for all the thermal properties obtained in this work.
Introduction
Foie gras is a specialty product made from the fatty liver of ducks and geese that have been overly hand fed. This product can be consumed as a spread or sliced directly from the fatty liver organ, or else in an emulsion form (“bloc”) which is made of ground fatty liver, water, and spices. One of the main problems of the foie gras canned products during sterilization is the high amount of fat melting during heating. In France, where the product is quite popular and considered a cultural heritage, the quality of the product is paramount and thus it has been established that the fat loss during cooking or heat treatment must be less than 30% for the product to keep its denomination of “foie gras.”[Citation1]
Thermal properties play a major role in food process design, they are an important part in the process modeling and evaluation, especially those involving heat transfer. If more accurate heat transfer data is available, then more efficient processes can be developed, saving energy and, at the same time, assuring a better quality and safety of the product.[Citation2,Citation3] During sterilization, convection heat from the heating fluid in the retort penetrates the can and is transferred inside it by conduction. The typical equation representing thermal transfer inside the can during sterilization is based in Fourier’s law of heat conduction and includes three intrinsic properties: density, specific heat, and thermal conductivity of the product.[Citation4]
Sweat[Citation3] showed that water content has a marked impact on thermal conductivity of meat products, as well as of fats and oils, for which if the product is composed just by pure lipids, values reach only 0.2 W/m K, while when having 90% of water in an emulsion, these values can be as high as 0.6 W/m K. Pham and Willix[Citation5] studied the thermal conductivity of lamb fat, liver, meat, and other organs, being their thermal conductivity in the range from 0.390 to 0.497 W/mK for the muscles, while a lower value of 0.219 W/m K for lamb fat. In a work done on cheddar cheese, Marschoun et al.[Citation6] indicated that both thermal conductivity and specific heat increased with moisture and protein concentration but decreased with fat content. Marcotte et al.[Citation2] presented correlations with temperature for thermal properties of different processed poultry products with different moisture and fat contents. The thermal conductivity of these products increased with temperature, showing a linear behavior after 60°C. As well, Elansari and Hobani[Citation7] reported a linear increase of thermal conductivity of different types of meats with moisture content and temperature. For the specific heat of the processed meats, the relationship with temperature became linear only between 35 and 80°C with similar slope values for different types of meat.[Citation2]
Density values for duck foie gras or its derivative products were not found in the literature, but some data has been published for similar meat products. Marcotte et al.[Citation2] found that for several cooked poultry emulsions with a fat content of above 20%, density ranged from 967 to 1067 kg/m3. Michailidis et al.[Citation8] reported a review of several density values from different authors, where the density of animal fat presents values of 920–957 kg/m3 while the animal muscle presented higher density values, in the range of 984–1080 kg/m3. Mathematical models developed for specific heat of foods are simple due to the fact that a prediction with high accuracy can be made knowing just the proportion of water.[Citation3] Prediction of thermal conductivity, however, requires more complex models taking into account temperature, composition and, sometimes, other parameters such as fiber orientation and air volume fraction.[Citation8] Choi and Okos[Citation9] developed a general model that predicts with enough accuracy the most important thermal properties of foods involved in processing.[Citation3,Citation6,Citation10] On the principle that the average property can be calculated as the sum of the individual thermal properties of compounds present in the food (i.e., water, proteins, carbohydrates, lipids, fibers, and ashes) multiplied by its mass fraction, this model takes into account the effect of temperature from second degree polynomial correlations of the individual compounds as a function of temperature.[Citation9]
Thermal properties of foie gras are of capital interest in order to properly design a thermal process that keeps the quality of the product (e.g., does not over melt the fat) but at the same time ensures its safety. No published data for thermal properties were found for foie gras or their by-products. The main objective of this work is thus to determine the thermal properties such as density, specific heat, and thermal conductivity of foie gras (organ and by-products), and to develop simple mathematical relationships to represent them from already published models.
Materials and methods
Foie gras (fatty liver organ), foie gras emulsion, and duck fat samples were obtained from a Quebec (Canada) local producer. Barbary ducks were manually overfed by trained handlers. They were slaughtered in a provincially inspected establishment (Ministère de l’agriculture des pêcheries et de l’alimentation du Québec). Feathers were removed, one bird at a time, using a horizontal rotary system (Plumex 2005, Pujol, Mirande, France) to avoid damaging the liver. Liver was removed and chilled overnight at 4°C before being processed. Duck fat was industrially produced in large containers where the fat melted from overfed duck parts was collected. Products were randomly obtained from six to ten different lots; whole foie gras and foie gras emulsion were obtained raw.
Samples were maintained at 4°C until arrival to the laboratory, where they were divided in smaller sample sizes, placed in sterile plastic bags and stored in a freezer at –20°C until needed. In addition to the regular duck fat bought from a local producer as described above, fat from foie gras was separated from the fatty liver organ by placing a piece of it in a glass funnel over a beaker, and letting the fat to drain during heating in an oven at 80°C for 10 min. The frozen samples were thawed in a refrigerator at 4°C for 24 h before analysis; all the samples were analyzed at least in duplicate. Results in tables are presented as mean value ± standard deviation.
Product composition
For water content determination, samples to be freeze-dried were weighed and transferred to freeze-resistant sealable bags, and then subjected to freezing to –40°C for 24 h. Frozen samples were then placed in the chamber of a VirTis Advantage EL85 Freeze Dryer (SP Scientific, Warminster, PA) under vacuum at a pressure below 50 kPa, during 72 h. Samples were weighed after the process; the difference in weight before and after freeze-drying divided by the freeze-dried mass was taken as the water content in dry basis.
Fat content was analyzed with a Soxtec 2050 (Foss Analytical, Denmark) fat extraction system under the hood. Approximately 0.25 g of the freeze-dried sample was weighed into cellulose crucibles; the sample was then transferred to an oven at 100°C for at least 2 h to eliminate any residual water that could interfere with the results. Aluminum cups (previously dried) were also weighed; the fat was recuperated in these cups after the process. The magnetized crucibles were inserted in the support of the Soxtec, where 90 mL of ether was poured into the aluminum cup. Ether boiled in the apparatus for 30 min and then the sample was rinsed for another 30 min, until all the ether was evaporated. The fat was extracted with the ether phase, and at the end of the process was left in the aluminum cup. The aluminum cup was dried in an oven and cooled in desiccators before taking the final weight. The fat content was calculated using:
The quantity of proteins was determined by the Dumas combustion method as reported in bibliography;[Citation11] using a Tru Spec N apparatus (LECO, St. Joseph, MI, USA). For this analysis, the freeze dried, fat-free sample was used. The sample was totally combusted and the total nitrogen was determined, the protein content was then calculated multiplying the nitrogen amount in the sample by 6.25 (protein conversion factor).
Fatty acids profiles of foie gras and duck fats were obtained by a gas chromatography coupled to a flame ionization detector (GC-FID). Before the analysis, the sample was completely melted at 55°C and filtered through a No. 1 Whatman filter paper to remove other component traces. The filtered sample was placed in a freezer at –18°C until their preparation in form of methyl esters of fatty acids. The sample profile was compared to a standard that was composed of a mix of different methylic fatty acids #GLC-607 (Nu-Check Prep., Elysian, MN). The peak areas of methylic fatty acids were corrected to express the contents in fatty acids. The analysis was made in duplicate and the average variation coefficient was 1.2% (±0.02 g/100).
Density (ρ)
A density determination kit based on the “Archimedes principle” (weighing the sample in air and in a reference liquid) was used with a balance AT 250 (Metler Toledo). The sample was covered with a thin wax film to waterproof the sample when the weight was taken in the reference liquid (water). This also avoided air bubbles to get into the sample. The sample was first weighed in “air,” and then it was transferred to the density kit that helped to determine the weight in “water.” The temperature of the distilled water was also measured. The density was calculated at 20°C with Eq. (2):
Specific heat (Cp)
Differential scanning calorimetry (DSC) was performed with a Pyris 1 calorimeter (Perkin Elmer, Waltham, MA). Calibration was made with indium. Samples (30 to 50 mg) were placed in high-pressure stainless steel capsules and were tightly closed to avoid sample leakage during the test. The temperature range of the test was –50 to 70°C so all the melting peaks of the fats could be determined. Samples were heated at 5°C min−1. An empty capsule was used as reference (air). Thermal curves were analyzed to obtain the specific heat with Eq. (3):
Liquid fat fraction (LFF) is the amount of fat that has already melted at a certain temperature and thus, the solid fat fraction (SFF) is obtained by subtracting LFF to the unit. Miller et al.[Citation12] were among the first to integrate the area under the DSC scanning curves to obtain the solid fat percentage. In the present work, the solid-liquid fat ratio was calculated integrating the melting region of the duck and foie gras fats thermograms. The total melting area is defined as the area under the curve of heat flow versus temperature integrated from the onset of the first melting peak to the final melting temperature. This area was calculated with the trapezoid rule. The different fractions were calculated as the areas integrated up to different temperatures inside the total melting area. Thus, the fraction at different temperatures was then calculated dividing each area by the total melting area. A third order polynomial was fitted to calculated LFF and SFF values in order to predict them as a function of temperature.
Thermal conductivity (k)
Thermal conductivity measurements were performed with a probe KD2 Pro (Decagon Devices, Pullman, WA), which contains a heater and a temperature sensor. When the probe is inserted into the sample, an electrical current passes through the heater and the change of temperature close to the heat source is registered over time, the analysis of temperature change versus time data was used to determine thermal conductivity. The TR-1 probe (2.4 mm diameter × 100 mm long) was used for this particular measurement. The sample was transferred to a plastic tube (26 mm inner diameter × 115 mm long). Temperature of the sample was controlled putting the sample in a recirculating bath (Fisher Scientific, Pittsburg, PA) at 5 to 70°C. Samples were left at least 10 min to reach equilibrium temperature. The water recirculation was turned off while the measurement was being taken to avoid losing sensibility in the test. Three measurements were done at each temperature. Measurements with 0.01% (or more) of error were discarded.
Property modeling and prediction
The mathematical prediction of the thermal properties for the fatty liver (organ and by-products) was done as a function of composition and temperature using model proposed by Choi and Okos:[Citation9]
The individual models for prediction of water, protein, carbohydrates and lipids properties as a function of temperature, required for Eq. (4), were taken from.[Citation9] In the particular case of predictive models for individual properties of lipids, correlations as a function of temperature were also developed from the experimental data obtained in this work, through a second degree polynomial regression:
Results and discussion
Product composition
shows the composition of foie gras, foie gras emulsion, duck and foie gras fats. The 3–5% missing to complete 100% in the composition of foie gras and foie gras emulsion, is supposed to be composed of carbohydrates, and ashes to a lower extent.[Citation13] The difference between the values of foie gras and foie gras emulsion can be explained by the formulation of the latter, which has added water. The values obtained for foie gras in this study are within the ranges presented in Rukke et al.[Citation14] which are 41.90–64.80% of lipids, 5.39–15.07% of proteins, and 61.41–74.52% of dry matter. Theron et al.[Citation11] found for duck foie gras a percentage of protein of 7.49 ± 0.75 and values for lipids and water of 56.7 ± 3.7 and 30.1 ± 0.28, respectively, which are very close to the values in . In Tremoulet et al.,[Citation15] similar values for total lipids in foie gras were reported.
Table 1. Composition (w/w) of duck foie gras and sub-products.
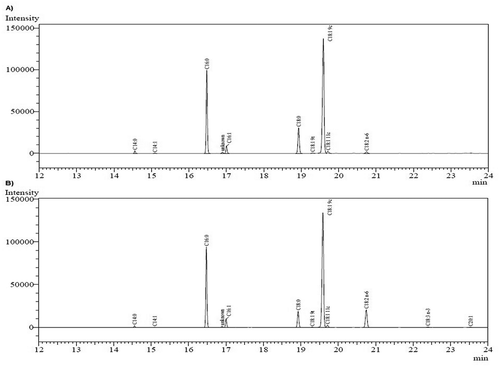
shows an example of fatty acid profiles obtained in this work. A compilation of the fatty acid compounds of foie gras and duck fats is presented in . The main fatty acids present in foie gras and duck fats are unsaturated. As shows, oleic acid is predominant in both profiles with more than 50% of the total fatty acids, followed by saturated palmitic acid that is 28.1% for foie gras fat and 26.1% for duck fat. One of the biggest differences in these profiles is the percentage of linoleic acid, being present only 0.9% in the foie gras fat while a total of 9% in the duck fat. An analogous comparison between fatty acid profiles in foie gras and other fatty tissues of duck and geese was found in Salichon et al.[Citation16] Rukke et al.[Citation14] presents a similar profile for foie gras fat, while Pereira et al.[Citation17] obtained similar results for the fatty acids in the duck fat. Cobos et al.[Citation18] characterized the fatty acid profile of leg, breast and liver of wild ducks, finding more (45.1% w/w) saturated fatty acids in liver than in the breast (35.1% w/w) and leg (31.1% w/w). The USDA National Nutrient Database[Citation19] reported for duck fat, a total value of 33.2 g/100 g for saturated fats, 49.3 g/100 g of monounsaturated fats and 12.9 g/100 g of polyunsaturated lipids (in our studies, values of 33.2 g/100 g for saturated fats, 57.6 g/100 g of monounsaturated, and 9.3 g/100 g of polyunsaturated lipids were obtained).
Table 2. Fatty acid profile for fat of foie gras and duck fat.
Figure 1. Fatty acid profile of lipids; A: Fat obtained from foie gras; B: duck fat.
Density
Density values for foie gras (organ), foie gras emulsion, and the fats of duck and foie gras at 20°C, from experimental data (calculated with Eq. [Citation2]), are presented in . From it can be noted that pure fats (duck or foie gras) have, as expected, lower density than foie gras (organ or emulsion). Duck fat density presents a slightly higher value than foie gras fat; this could be explained because density is higher if the lipid is composed of unsaturated fatty acids (see ). The complexity of the fatty acids (i.e., chain size of fatty acid) also plays a role in the density of the lipid.[Citation20] The high content of fat in foie gras products makes their density lower than for poultry products such as cooked emulsions or animal muscle, for which density ranged from 967 to 1067 kg/m3 and 984 to 1080 kg/m3, respectively.[Citation2]
Table 3. Density ρ (kg/m 3) of foie gras and their by-products at 20°C.
Predicted density values using Eq. (4) and composition fractions from , where lipid individual density at 20°C was estimated from general correlations found in Choi and Okos[Citation9] or directly taken from experimental data for fatty liver lipid density obtained in this study. The use of the experimental value of foie gras lipid density (836 kg/m3) improved the predictions for foie gras (organ and emulsion) density values, decreasing the error in the prediction from 6–7% to less than 2.5%.
Specific heat and DSC
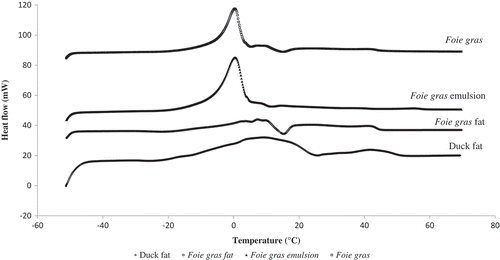
A sample of the thermograms for foie gras and its by-products from –50 to 70°C is shown in . It can be noted that thermograms of foie gras (organ and emulsion) present a similar thermal behavior showing important peak approximately at 0°C, which is the melting point of ice. In , four to five melting peaks were observed in the thermal histories of both fat types, melting starting approximately between –30 to –25°C, but finishing at 55 and 45°C for duck and foie gras fats, respectively. It should be noted that oleic acid, the main fatty acid found in duck and foie gras fats (), has a melting point of 13.3°C.[Citation21]
Figure 2. DSC for foie gras and by-products in the temperature range of –50 to 70°C.
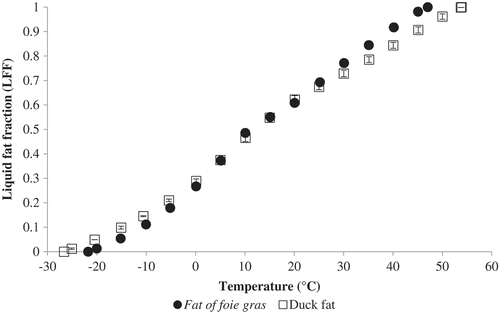
LFF was calculated as a function of temperature for both fat products (). Melting for duck fat occurs in a larger spectrum of temperatures than the foie gras fat. A third order polynomial was fitted to the calculated data values to predict these fractions at different temperatures; Eqs. (6) and (7) represent these relationships (R2 = 0.9983 for foie gras fat and 0.9985, for duck fat):
Figure 3. Liquid fat fraction (LFF) at different temperatures for foie gras fat and duck fat.
From the thermograms shown in , the specific heat of foie gras and by-products was calculated by using Eq. (3) before any sign of lipid melting appeared in the thermogram, and when the heat flow was again constant (this is after melting peaks disappeared from the graph). shows the Cp values of foie gras and by-products at different temperatures. As can be seen from this figure, Cp values of foie gras emulsion are higher than those for whole foie gras. For instance, at temperatures higher than the melting values, Cp of foie gras was in the range of 1.90–2.0 J/g°C, while for the emulsion, between 2 and 2.25 J/g°C. Marschoun et al.[Citation6] showed that specific heat of Cheddar cheese increased with moisture and protein concentration but decreased with fat content. The higher values found for the Cp of foie gras emulsion, were probably due to the 10% higher water content than the value for foie gras (organ; ), although its lipid content was lower by 6%.
Figure 4. Cp at different temperatures for foie gras and by-products; A: Foie gras; B: Foie gras emulsion; C: Foie gras fat; and D: duck fat.
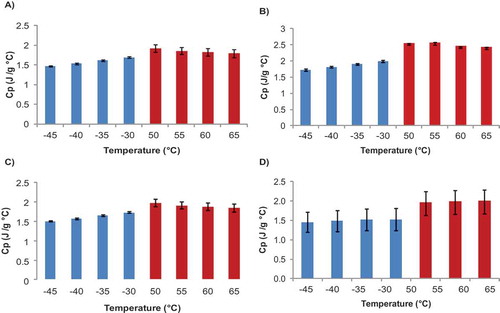
Cp for foie gras fat ranged from 1.57 to 1.71 J/g°C, while the values for duck fat covered a wider range from 1.46 to 1.98 J/g°C. Kasprzycka-Guttman and Odzeniak[Citation22] reported Cp values for several oils and fats. They found that the specific heat of olive oil (whose main constituent is oleic acid, the same as foie gras and duck fats) had a value of 2.079 J/g°C at 70°C which is in agreement to values found in this work.
In order to develop a mathematical relationship for the Cp of foie gras (liquid and solid fat), Eq. (5) was fitted to experimental data before the melting peaks start (solid fat) and after the last melting (liquid fat). shows the regression constants obtained from this fitting, together with regression constants values for the other compounds.[Citation9]
Table 4. Regression terms for the heat capacity of individual components.
Specific heat for foie gras (organ and emulsion) was then predicted at different temperatures (before and after melting of lipids), from the Choi and Okos[Citation9] model (Eq. [Citation4]), using regression constants for individual compounds from Choi and Okos[Citation9] or obtained in this work (compiled in ) and the composition values presented in . Cp values for foie gras (organ) predicted from the model are higher than those obtained from experiments. When compared both the predicted and experimental values, predicted values show an estimated error higher than 20%. The differences found between predicted and experimental values may be due to the sample of foie gras taken for experimental measurement for DSC was small (0.05 g), thus homogeneity of sample may not be representative of the whole product. Composition required to use in Eq. (4), on the other hand, has been determined in a bigger sample size.
For the foie gras emulsion Cp values estimation, predicted and experimental values show an experimental error less than 7%. It can be inferred that the model proposed by Choi and Okos[Citation9] can predict more precisely the values of specific heat for the foie gras emulsion. Unlike foie gras (organ), the emulsion is a homogeneous product, for which a small sample is representative of the entire product.
Thermal conductivity
Thermal conductivity values from 5 to 70°C for foie gras (organ and by-products) were determined experimentally, results shown in . From these values, it can be concluded that thermal conductivity for the foie gras emulsion () is slightly higher compared to that of the whole foie gras (), this is because thermal conductivity of foods increases proportionally as water content increases.[Citation3] Poppendiek et al.[Citation23] reported values of thermal conductivity for different animal tissues, where values of bovine and rabbit liver were 0.488 and 0.377 W m−1°C−1, respectively, at 23°C, bovine liver has a greater thermal conductivity compared to that of foie gras but for rabbit liver k is closer to the values presented in this study (0.287 to 0.323 W m−1°C−1 at 18–20°C). Difference in values can be related to higher amount of fat in foie gras than in other types of liver products.
Figure 5. Thermal conductivity as a function of temperature, for A: duck fat and foie gras emulsion; B: foie gras fat and foie gras (organ).
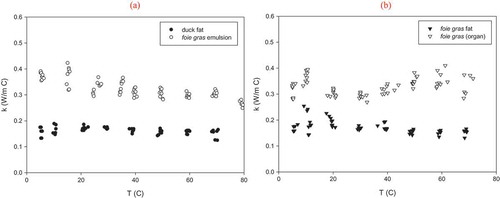
Pham and Willix[Citation5] reported that thermal conductivity of lamb fat decreases at temperatures higher than ice melting point (from 0 to 40°C), as Turgut et al.[Citation24] observed for vegetable oils between 20 and 80°C. In the present work, the same tendency was observed for foie gras and duck fats. Poppendiek et al.[Citation23] presented values for bovine fat and other animal fat (source not specified), which were 0.230 and 0.190 W m−1°C−1 at 23°C, respectively. These measurements are comparable to those presented for the foie gras fat (0.172–0.195 W m−1°C−1 for 19.5–20.7°C) and duck fat (0.162–0.185 W m−1°C−1 at 20.5°C 21.8°C). Sweat[Citation3] proposed constant values for thermal conductivity for meats and fats, as 0.46 and 0.18 W m−1°C−1, respectively, which are close to the values obtained in this study. For temperatures lower than 15°C (when almost 50% of the fat has not yet melted); a higher value of thermal conductivity is noted, this could be explained because thermal conductivity of solids is higher with respect of that of the liquids. It can also be noted that at temperatures of 50°C or higher there is a linear tendency of this thermal property with temperature.
As a first attempt to model thermal conductivity data, both quadratic and linear regression relationships were obtained as a function of temperature from experimental data which are presented in . The quadratic function for pure compounds (foie gras or duck fats) has been proposed to predict individual compound properties in the model given by Choi and Okos.[Citation9] Thermal conductivity from foie gras and duck fat present a linear tendency with a slight negative slope meaning that the thermal conductivity for this products is very similar through the range of temperatures tested in this study.
Table 5. Thermal conductivity (W m−1 °C−1) linear and quadratic models for foie gras and its by-products.
The complete model proposed by Choi and Okos,[Citation9] Eq. (4), was then used to predict thermal conductivity values from individual compounds at different temperatures for foie gras (organ and emulsion). For the individual foie gras fat equation, the quadratic relationship developed in this work (shown in ) was used. Predictions using this model were calculated for foie gras organ and emulsion. A comparison between Choi and Okos[Citation9] model and the quadratic and linear models proposed in was also determined.
The model developed by Choi and Okos[Citation9] based on composition of individual compounds does not predict thermal conductivity with great accuracy (% error from 2.4 to 16.0 for foie gras organ and 2.9 to 26.6 for foie gras emulsion), probably since product structure has a marked impact on heat transfer by conduction, which is not taken into account in this model. From calculations made by the regressions, it can also be noted that quadratic regression predicts better (%error from 0.5 to 11.9 for foie gras organ and 1.0 to 8.8 for foie gras emulsion) thermal conductivity of foie gras products than linear regression (% error from 0.8 to 13.4 for foie gras organ and 1.3 to 9.54 for foie gras emulsion). Thus, it can be concluded that for both foie gras products (organ and emulsion), the quadratic model proposed can be used to predict the thermal conductivity of the product, having a lower percentage error when compared to experimental data.
Thermal diffusivity (α)
Thermal diffusivity was calculated from experimental data with the following relationship:[Citation3,Citation8,Citation10]
Results of these calculations at different temperatures and for the different foie gras products are shown in . As shown with thermal conductivity results, thermal diffusivity of high fat foods is lower compared to water, having a value of 1.45 × 10⁻⁷ m2 s−1 at 50°C.[Citation25] The values of duck fat are the lowest presented, it can be due to the composition of fatty acid presented in , which differs in the unsaturated acid content of foie gras fat.
TABLE 6 Thermal diffusivity at different temperatures, α (m2 s−1) × 10−7
Conclusions
Thermal properties for different foie gras products were determined. Values for the specific heat at 65°C for the organ, emulsion, foie gras fat and duck fat were 1.79, 2.38, 1.71, and 2.48 J/g°C, respectively. Thermal conductivity of foie gras organ and the emulsion at 40°C were determined as 0.33 and 0.428 W/m°C, respectively. These values were almost double of those of duck and foie gras fats. The results generally show good agreement with published data for similar food types. Simple mathematical models for prediction of these properties as a function of temperature and/or composition were developed. The knowledge of thermal properties of foie gras products will allow a more precise mathematical prediction of sterilization times.
Acknowledgment
The authors thank Mr. Ronan Corcuff for the fatty acid profile determinations and fruitful discussions.
Funding
The research team working in this project acknowledges the financial support of the Programme de soutien à l’innovation en agroalimentaire, a program derived from the Growing Forward agreement between the Ministère de l’agriculture des pêcheries et de l’alimentation du Québec (MAPAQ) and Agriculture and Agri-Food Canada. The Association des éleveurs de canards et d’oies du Québec is also a partner in this project.
Additional information
Funding
References
- Decree no. 93-999. Relative to Preparations with Foie Gras Base. Official Journal of the French Republic 1993, 187, 11477.
- Marcotte, M.; Taherian, A.R.; Karimi, Y. Thermophysical Properties of Processes Meat and Poultry Products. Journal of Food Engineering 2008, 88 (3), 315–322.
- Sweat, V. Thermal Properties of Foods. In Engineering Properties of Foods, 2nd Ed, Chapter 3; Rao, M.A.; Rizvi S.S.H.; Eds.; Marcel Dekker Inc.: New York, 1995.
- Baik, O.-D.; Mittal, G.S. Determination and Modelling of Thermal Properties of Tofu. International Journal of Food Properties 2003, 6 (1), 9–24.
- Pham, Q.T.; Willix, J. Thermal Conductivity of Fresh Lamb Meat, Offals and Fat in the Range –40 to 30°C: Measurements and Correlations. Journal of Food Science 1989, 54, 508–515.
- Marschoun, L.T.; Muthukumarappan, K.; Gunasekaram, S. Thermal Properties of Cheddar Cheese: Experimental and Modeling. International Journal of Food Properties 2001, 4 (3), 383–403.
- Elansari, A.M.; Hobani, A.I. Effect of Temperature and Moisture Content on Thermal Conductivity of Four Types of Meat. International Journal of Food Properties 2009, 12, 308–315.
- Michailidis, P.; Krokida, M.; Bisharatat, G.; Marinos-Kouris, D.; Rahman, M. Measurement of Density, Shinkage and Porosity. In Food Properties Handbook, Chapter 13; Rahman, M.; Ed.; Taylor & Francis Group: Boca Raton, FL, 2009.
- Choi, Y.; Okos, M. Effects of Temperature and Composition on the Thermal Properties of Foods. In Food Engineering and Process Applications, Volume 1, Chapter 9; Lemaguer, M.; Jelen, P.; Eds.; Elsevier Applied Science Publishers LTD, Crown House: Essex, England, 1986.
- Santana, F.; Augusto, P.; Cristianini, M. Thermal Process Characterization of Moist Pet Food: Proximate Analysis and Thermo-Physical Properties and Thermal Resistance of Clostridium Sporogenes. Journal of Food Processing and Preservation 2013, 37, 126–132.
- Theron, L.; Venien, A.; Jamme, F.; Fernandez, X.; Peyrin, F.; Molette, C.; Dumas, P.; Réfrégiers, M.; Astruc, T. Protein Matrix Involved in the Lipid Retention of Foie Gras During Cooking: A Multimodal Hyperspectral Imaging Study. Journal of Agricultural and Food Chemistry 2014, 62 (25), 5954–5962.
- Miller, W.J.; Koester, W.H.; Freeberg, F.E. The Measurement of Fatty Solids by Differential Scanning Calorimetry. Journal of the American Oil Chemists’ Society 1969, 46 (7), 341–343.
- Brault Dubuc, M.; Caron Lahaie, L. Valeur Nutritive des Aliments; Éditions Société Brault-Lahaie: St-Lambert, Québec, 1998.
- Rukke, E.O.; Fernandez, X.; Schuller, R.B. Comparison of Rheological Properties in Fatty Liver from Duck and Goose by Oscillatory Plate-Plate Rheometer Measurements. Annual Transactions of the Nordic Rheology Society 2008, 16, 57–62.
- Tremoulet, F.; Rabier, P.; Gas, G. Inhibition of Bacillus Stearothermophilus Spores in a Liquid Medium by Free Fatty Acids with and Without Heat: Possible Mechanisms for the Microbiological Stability of Canned Fat-Duck Liver. Journal of Food Science 2002, 67, 1144–1148.
- Salichon, M.R.; Guy, G.; Rousselot, D.; Blum, J.C. Composition des 3 Types de Foie Gras: Oie, Canard Mulard et Canard de Barbarie. Annales de Zootechnie 1994, 43, 213–220.
- Pereira, A.S.; Stadelman, W.J. Total Fatty Acid Composition of Duck Fatty Tissues. Poultry Science 1976, 55 (4), 1464–1466.
- Cobos, Á.; Vega, A.; Díaz, O. Chemical and Fatty Acid Composition of Meat and Liver Of Wild Ducks (Anas Platyrhynchos). Food Chemistry 2000, 68, 77–79.
- USDA National Nutrient Database for Standard Reference. http://ndb.nal.usda.gov/index.html. Accessed January 2014.
- Nichols, D.; Jordan, T.B.; Kerr, N. Chemical and Physical Properties of Lipids. In Chemical, Biological, and Functional Aspects of Food Lipids, 2nd Ed; Kolakowska, A.; Ed.; CRC Press, Taylor & Francis Group: Boca Raton, FL 2010.
- Suzuki, M.; Ogaki, T.; Sato, K. Crystallization and Transformation Mechanisms of α, β- and γ-Polymorphs of Ultra-Pure Oleic Acid. Journal of the American Oil Chemists’ Society 1985, 62 (11), 1600–1604.
- Kasprzycka-Guttman, T.; Odzeniak, D. Specific Heat of Some Oils and a Fat. Thermochimica Acta 1991, 191, 41–45.
- Poppendiek, H.F.; Randall, R.; Breeden, J.; Chamber, J.E.; Murphy, J.R. Conductivity Measurements and Predictions for Biological Fluids and Tissues. Cryobiology 1966, 3 (4), 318–327.
- Turgut, A.; Tavman, I.; Tavman, S. Measurement of Thermal Conductivity of Edible Oils Using Transient Hot Wire Method. International Journal of Food Properties 2009, 12, 741–747.
- James, D.W. The Thermal Diffusivity of Ice and Water Between −40 and +60°C. Journal of Materials Science 1968, 3 (5), 540–543.