
ABSTRACT
Native corn and potato starches were mixed in different proportions. Blends presented similar values to potato starch at onset temperature and at ending temperature to corn starch. CS20PS80 blend had the highest values for hardness between blends due to the formation of a three-dimensional network with corn starch granules that act as composite material. Some blends exhibited higher recovery viscosity than native starches, possibly due to interactions. Gelatinization temperature, swelling power, phosphorous content, granule size, and x-ray pattern played an important role in the resulting properties, however, the amylose content did not show influence due to both starches having a similar content.
Introduction
Plants use starch to store energy. Starch consists of the polysaccharides amylose and amylopectin; the first causes gelation and the second retrogradation.[Citation1,Citation2] These biopolymers are produced and packed as granules, which vary in shape and size depending on the botanical source.[Citation3,Citation4] Commercial starches are extracted mainly from cereals, particularly corn, cereal corn, amylose-rich corn, wheat, different types of rice, as well as roots and tubers such as potatoes, yams, and cassava. The various uses of starches depend on their source since this dictates physicochemical and functional properties which, in turn, depend on granule morphology; gelatinization temperature; crystallinity; swelling power (SP); amylose/amylopectin ratio; chain length; and the presence of phospholipids and monoesters, among others.[Citation2,Citation5–Citation7]
Starch granules are widely used in industrial processes as gelling agents, water retainers, stabilizers, thickeners, adhesives, etc.[Citation8,Citation9] The physicochemical and functional properties of native starches are not always uniform and stable, but industrial processes normally require uniformity and stability. As a result, a native starches’ molecular structure is often modified using physical, enzymatic, and/or chemical methods to allow them to meet industrial needs.[Citation4,Citation5,Citation10]
Mixing of native starches with different physicochemical properties has been proposed as a way of producing starches with more homogeneous properties. This would allow for their use in industrial applications without structural modification of the native starches.[Citation1,Citation6,Citation11] Starch blends can exhibit more uniform properties in response to granular or/and molecular interactions between starches, which can be facilitate for differences in intrinsic properties such as gelatinization temperature, SP, carbohydrate lixiviation, molecular structure, and granule size of starches in a blend that can facilitate specific interactions that produce properties that would not occur separately in the source starches.[Citation4,Citation12,Citation13]
Potato and normal corn starches (CSs) are widely used in commercial applications. Potato starch (PS) exhibits a B-type x-ray diffraction (XRD) pattern and contains phosphate monoester groups covalently bonded to amylopectin, which increases paste clarity and viscosity.[Citation14,Citation15] Normal CS exhibits an A-type diffraction pattern[Citation16] and forms hard, strong gels.[Citation9] Both have an amylose content classified as normal.[Citation8] The objective of present study was to evaluate the effect of each starch properties on their interactions when were blended and the changes produced in the resulting physicochemical and functional properties.
Materials and methods
Starches and blend formulation
PS and normal CS were purchased from Sigma-Aldrich (Bornem, Belgium). Blends of CS and PS were prepared in four proportions (CS/PS): 20:80, 40:60, 60:40, and 80:20. Control treatments using CS or PS alone were also analyzed. Each blend was thoroughly shaken prior to analysis.
Chemical analysis
Amylose and amylopectin content were measured following Gibson et al.[Citation17] using the Megazyme commercial kit (Megazyme International, Ireland Ltd., Ireland). Quantification is based on formation of an inclusion complex between concavalin A and amylopectin. Measurements were done in triplicate. Phosphorous was measured following a standard method (995.11; AOAC, 1998). Samples were dried-incinerated to remove organic matter and the inorganic residue solubilized in hydrochloric acid. This solution was used in a color reaction based on formation of a blue complex between phosphate and sodium molybdate [(MoO2 4MoO3)2 H3PO4] in the presence of ascorbic acid as a reducing agent. Triplicate analyses were run for each starch and calculations done as follows:
where, V1: solution volume used in the color reaction (mL); V2: volume of matrass containing the incinerated sample (mL); P: amount of phosphorous from the standard curve corresponding to simple absorbance (mg); and W: weighed sample amount (mg).
Scanning electron microscopy (SEM) and XRD
Native PS and CS were analyzed using SEM (JEOL JSM-5600, Akishima, Tokyo, Japan). Completely dry samples were placed on a stand using double-faced electroconductive carbon tape and then covered with gold. Analyses were run at 15 A and 20 KV and 20 measurements taken of different granules from each native starch.
Diffraction patterns of the native starches were measured with a diffractometer (D-5000, Siemens, Wittelsbacherplatz, Munich, Germany), at 35 KV, 15 mA current density and using a copper monochromatic radiation line with λ = 1.5406. Data were collected at a 2Ө angle interval of 4 to 80°, a 0.1°/s rate and a 5 s angle step count time. In the diffractograms, crystalline and amorphous regions were determined using the Fytik software (Version 0.9.8), and the crystalline percentage of PS and CS calculated following Rodríguez et al.[Citation18]
SP
This parameter was measured in triplicate following Anderson et al.,[Citation19] with modifications. One gram of each mixture was placed in 35 mL centrifuge tubes, 10 mL distilled water added, the tubes agitated in a vortex for 30 s and heated to 60, 70, 80, and 90°C in a water bath for 30 min. The tubes were then cooled to room temperature in an ice water bath and centrifuged at 8000 rpm for 25 min (Sorvall Thermo Fischer Scientific, Germany). The same procedure was followed for the samples at room temperature. The supernatant was decanted and the sediment weighed. Calculation of SP, expressed in grams (g/g), was done using this formula:
Thermal properties
Starch blends and native starches onset (To), peak (Tp), and ending (Te) temperatures and gelatinization enthalpy (ΔH) were measured with a differential scanning calorimeter (DSC; Model 822E, Mettler Toledo, Griefensee, Zurich, Switzerland). The sample (4 mg) was placed in a standard 40 µL aluminum crucible and a Hamilton microsyringe used to add distilled water at a 1:4 (starch:water) ratio. Samples were hermetically sealed and evaluated within 25 to 95°C interval at a 5°C/min heating rate. Measurements were done in triplicate.
Polarized light microscopy
Starch granules were suspended in distilled water (20% w/v), a drop of this starch suspension placed on a slide and the slide placed on a heating plate. The suspensions were heated from 25 to 80°C at a 5°C/min rate. Samples were observed with a polarized light microscope (Olympus BX41).
Rheological properties (dynamic rheometry)
Measurements were done with a controlled force rheometer (AR2000, TA-Instruments) in oscillatory mode in a parallel plate geometry, 60 mm diameter with rugose texture plates with a 1 mm gap and a solvent trap. Starch suspensions at 20% w/v were heated (5°C/min at 1 Hz) from 25 to 95°C, kept at 95°C for 1 min, and then cooled (5°C/min at 1 Hz) to 25°C (storage module [G’], loss module [G’’], and loss angle tangent [δ] were evaluated). Water evaporation from samples during measurement was prevented by using a geometry cover that generated a humidity saturated environment (relative humidity = 100%). Before viscoelastic measurements, the linear viscoelasticity zone was calculated for the evaluated temperature interval (25 to 95°C) following Toro-Vázquez et al.[Citation20] Once the starch blends were cooled, the viscoelastic properties of the formed gels were evaluated: storage module (G’), loss module (G’’), and loss angle tangent (δ) at 25°C and 1% deformation, and a 0.1–100 s−1 sweep frequency.
Texture profile
Native starches and blends at 20% w/v were heated in the presence of water at 70°C in test tubes in a water bath for 30 min. They were then placed in refrigeration (4°C) for 24 h to allow for gel formation. The gels were cut into cubes (2.5 cm diameter × 1 cm height). Using a texturometer (Universal tester, EZ Test, Shimadzu, Tokyo), the cubes were compressed twice at 200 mm/min until reaching 30% deformation. Each sample was tested in triplicate and the results averaged. The texture curve profile was used to calculate hardness (H), adhesiveness (A), and cohesiveness (C).
Viscosity profiles
Viscosity profiles were generated with a rheometer (AR1500, TA-Instruments) equipped with a starch cell (aluminum cell insulated to control temperature). Samples were prepared in suspensions of 8% starch (dry base, db) in 25 g distilled water and processed as follows: Paddle speed was set at 78.53 rad/s from 25 to 50°C, then heating from 50 to 90°C; 2.5 min at 90°C; cooling to 50°C; 2 min at 50°C (12.2°C/min heating and cooling rates; 16.75 rad/s angle speed). The viscosity profiles were used to calculate peak viscosity (PV); viscosity after 2.5 min at 90°C (T); viscosity after 2 min at 50°C (E); PV-T and setback viscosity (E-T). Each sample was tested in triplicate.
Statistical analysis
Results were analyzed with a one-way, completely random, multi-factorial analysis of variance (ANOVA) and means compared with a Tukey test (p < 0.05). All analyses were run with the SigmaPlot program (Version 11.0).
Results and discussion
Chemical characterization
Amylose content was 26.1% ± 0.57 for CS and 26.7% ± 0.66 for PS. These values classified them as normal starches since their amylose contents were between 20 and 30%.[Citation2,Citation8] PS had a phosphorous content of 75.61 mg P/100 g ± 2.67. This starch is known for having the highest phosphorous content (in the form of phosphate monoester) among botanical starch sources.[Citation2,Citation21] CS had a content of 15.32 mg P/100 g ± 0.65. In this source, the phosphorous occurs in inclusion complexes with amylose and in a free form. Phosphorous content and form modifies starch physicochemical properties.[Citation3]
SEM and XRD
Starch granule structures varied significantly in size in both PS () and CS (). Granule size ranged from 8.6 to 33.6 µm in PS and from 5.4 to 15.9 µm in CS; these values coincide with previous reports.[Citation2,Citation4] Average granule size was 27.1 µm in PS and 10.8 µm in CS. Crystallinity percentage in native starches was 19.3% in PS and 19.5% in CS. Percentages like those observed here are normal in native starches because the entire amylopectin fraction cannot form double helices.[Citation22]
Figure 1. Micrographs (2000x) of native starches: (a) potato; (b) normal corn.
SP
All samples exhibited increased SP from room temperature to 60°C (), as the hydrogen bridges between amylopectin chains began to break, allowing bonding to water molecules and granule swelling.[Citation3,Citation22] PS SP at 60°C was higher than all the evaluated blends and CS at this temperature. Hydration in PS is increased by its high content of phosphate groups covalently bonded to amylopectin, which weakens bonds in crystalline zones. It is also promoted by granule size and the way amylopectin molecules are packed, as shown in its B-type diffraction pattern,[Citation3,Citation22] facilitating increased water absorption at this temperature over CS.
Figure 2. Swelling power of native potato and normal corn starches and blends of them (CS/PS), at different temperatures.
Maximum SP occurred at lower temperatures in PS than in CS, perhaps because CS amylopectin chains have a greater degree of polymerization. This allows them to interact with larger amounts of water, providing it greater granule rigidity than in PS, and meaning it can continue absorbing water as temperature increases without its structure collapsing.[Citation3,Citation12,Citation22] It’s A-type diffraction pattern indicates that CS amylopectin crystals are more densely packed than in a B-type diffraction pattern, allowing have greater stability at lower temperatures.[Citation3,Citation22]
These differences in SP between both starches allowed that blends presented different behaviors according to the proportion of each starch at each temperature resulting. At 60°C, the lower values presented by the blends in comparison to PS, allowed a modification in the SP of this starch, which results in a delay for the granules swelling. At 70, 80 and 90°C, CS20PS80 and CS40PS60 presented lower or similar values than PS and CS alone, due to the restriction in SP for both starches, as a consequence of CS granules surrounding PS granules, causing a competition for water between these, depending of starches proportion and their characteristics, this behavior has been also reported for other starches blends.[Citation13,Citation23] CS60PS40 and CS80PS20 blends increased SP with respect to the other two blends, due to the CS characteristics (stability, SP, and x-ray pattern), but in lower level compared to CS, as a consequence of PS granules and their competition for water. The modification of SP through of the starches blend, allows to increase the possible uses of the native starches without the use of chemical and physical modifications.
Thermal properties
Native starch thermal properties observed here agreed with those reported in the literature.[Citation15,Citation24] Gelatinization temperatures () vary as a function of the amylose/amylopectin ratio, crystalline structure (chain length and type of polymorphic shape), phosphorous content and form and granule size for native starches.[Citation3,Citation4,Citation15] Blends presented onset temperatures (To) values similar to PS and ending temperature (Te) values similar to CS, which is explained by the values of the individual starches and its proportion, where PS gelatinized first and then CS according to their native starches transition temperatures, affecting the gelatinization range (), where blends showed higher values than native starches, this could explain the fact that natives starches had a delay in the SP and need a higher temperature range due to differences in the crystalline quality between both starches.[Citation25] WCS40PS40 and WCS60PS40 blends presented the highest values in the temperature range related with a major competition between starches as a result of its proportion.
Table 1. Thermal and textural properties of CS, PS, and blends of them.
The highest ΔH value (14.87 J/g) was in PS, followed by CS20PS80 (14.09 J/g). In blends, ΔH values decreased as a function of CS incremented its content, all blends have higher values than CS and less than PS, which is related with an incomplete and delay gelatinization in starches, this may have occurred in response to the starch proportions in each blend creating greater competition for water content and limit the available water for both starches.[Citation13,Citation23] The blends were able to increase the gelatinization range and reduce ΔH values with respect to PS.
Polarized light microscopy
Polarized light images of the native starches and the blends at the studied temperatures showed that PS granules were larger than CS granules (). This coincides with the SEM results. In PS, initial swelling of some granules began at 56.2°C and increased with temperature, which is related with granules size increasing with the heating (expressed as increase in area) and the loss of birefringence.[Citation26] At ending temperature (Te; 66°C) as measured by DSC, some granules had still not been completely destroyed, which is related with water competition and the fact within a given starch granule population, the temperature of individual granules may span between 10–15°C, and the differences in heat transfer between DSC and the hot stage.[Citation26]
Figure 3. Polarized light microscope images of native starches and blends of them (CS/PS), taken within a 25 to 80°C interval, at a 5°C/min heating rate.
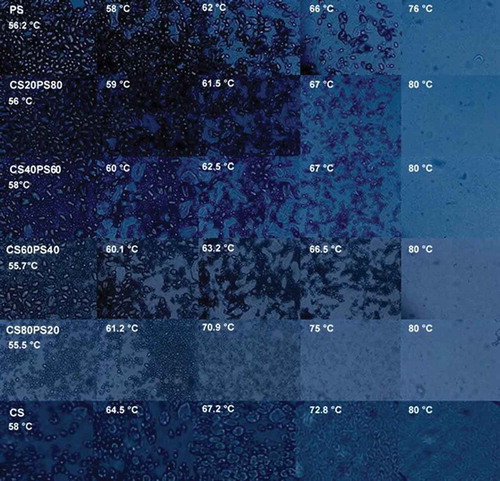
In all the blends, swelling began at lower temperatures in PS than in CS, which agrees with the DSC and SP results. As the CS proportion increased, CS granules exhibited greater swelling (increase in area). Perhaps this was due to PS granules surrounding CS granules, which causes a physical limitation in water absorption. The smaller amount of PS, facilitated swelling since a greater quantity of water would be available for CS.
In the 66 to 75°C range CS granules still appeared whole and with a lower degree of swelling, largely due to low water availability, in comparison when CS is alone. In this range of temperature, PS granules birefringence was lost and are observed like a “ghosts.” Above 76°C, no whole PS granules were observed. At 80°C, blends exhibited gelatinized CS granules that were smaller (less size) than gelatinized granules in the pure CS, suggesting that remanent granules can be structurally reinforced the matrix.[Citation24] This is to be expected since in the pure CS the granules have all the water and space they need to increase in size. This has been reported previously in potato-canna, canna-mung bean, and canna-rice starches blends, where granule starches presented restriction in their swelling due to the presence of other starch.[Citation4]
Starch with higher transition temperatures (CS) is limited in its gelatinization and for this reason is trapped in the network formed for the leaching molecules of the starch with lower transition temperatures (PS). Due to the blends of both starches, blends could formed a continue network with a discontinuous phase of granules, that could be reinforcing the formation of a three-dimensional network.[Citation13,Citation24]
Rheological properties
In the rheological properties the storage module (G’) and loss module (G”) was evaluated, in the native starches and their blends during heating () and cooling () kinetics. G’, increased during heating until reaching a maximum value at between 70 and 72°C in the blends. It then decreased, reaching a minimum at 95°C, and increased again during cooling. This pattern is associated with initial swelling and gelatinization of starch granules, later the solubilization of amylose, and the formation of a gel by amylose (gelation) in general, regardless of their botanical source.[Citation5,Citation25] Although no differences were observed between the temperature values at G’ maximum at which these transitions occurred, PS rheological properties tended to dominate in the blends, probably due to its larger granule size, SP and phosphate monoester content, exhibiting the highest G’ values during heating () and cooling (). The lack of differences between treatments may be related to both starches being classified as normal due to their amylose content (approximately 26%). This is why no significant differences (p > 0.05) in the storage module was identified between the blends. As PS proportion diminished, G’ slightly varied. Similar behavior has been reported in potato and barley starch blends, where both exhibit similar heating and cooling kinetics, a phenomenon attributed to their amylose contents.[Citation5] In contrast, the lower G’ and G” values of CS may be due to the presence of lipids, phospholipids (forming inclusion complexes with the amylose), and granule stability (diffraction pattern, type A), which restrict granule swelling and result in less strong gels[Citation2,Citation25] than PS. At 95°C, G’ decreased in value versus maximum G’ in all blends (). This occurred because as temperature increases the granules are destroyed due to shearing and swelling.[Citation5,Citation16]
Figure 4. Gelification kinetics of native starches, and blends of them (CS/PS), during (a) heating and (b) cooling at a 5°C/min rate and 1 Hz frequency.
The highest value being in CS60PS40, between all samples at G’ maxim (), this behavior could be for the swelling restriction for PS granules, causing an increase in the rigidity and stability of its granules due to the presence of CS granules. Slight variations were observed between blends in terms of G’ during cooling when native starches proportion was changed. The general increase of G’ during cooling in the blends and native starches, is a result of the network formation by amylose and the presence of fragmented granules inside reinforced it.
In the mechanical spectra () produced at 25°C and 1% deformation, native starches and blends exhibited similar behavior. Weak gels were formed at low frequencies while over short periods (high frequencies), the curve shows a linearity behavior and in the range studied can not observed the crossover, indicating formation of gels, due to G’ >> G” although G showed a little frequency dependence. In terms of G’, the different starch proportions in the blends did not change their respective G’ patterns.
Figure 5. Frequency sweep for native starches and blends of them at 1% deformation and 25°C.
Texture profile
Gel hardness is mainly caused by formation of a stable three-dimensional network like that formed by amylose molecules with swelling granules that act as composite materials.[Citation24] Given the nature of both starches, granule size and gelatinization temperature would also have had an effect. PS has a larger granule size and lower gelatinization temperature, which would allow it to form gels with composite materials (fragmented granules of CS) with smaller, disperse particles within the three-dimensional network; this was exactly what was observed in the polarized light microscope images (). Hardness (H) was highest in CS (13.29 N), followed by CS20PS80 (12.25 N) and CS80PS20 (6.96 N; ). A higher hardness values for CS could be for the formation of inclusion complexes between amylose and phospholipids.[Citation2] Blends could presented a higher values than PS, due to the formation of reinforced matrix and the CS properties (granule rigidity, phospholipids content, type A pattern).
Cohesiveness (C) was highest in the native starches (CS = 0.88; PS = 0.86), and differed between the CS/PS blends (). This property is related to interactions between the amylose molecules in both starches. Values were lower in blends than in native starches, most probably due to the restriction in the gelatinization and molecules lixiviation for both starches. Amylose is known to be responsible for starch gelation during hydrothermal treatment.[Citation13,Citation25] Adhesiveness in blends not showed significant differences to native starches, this could be explained for amylopectin content and its relationship with this parameter, where both starches presented similar values.
Viscosity profiles
Starch viscosity is related with swelling, size granule, stability, and rigidity of granule and phosphate monoester content.[Citation27,Citation28] Viscosity values were higher in PS related with its SP and granule size, lower in CS and intermediate in the starch blends. This was reflected in the viscosity profiles, which showed PS to peak even before maximum temperature (90°C) was reached, and CS to peak slowly and remain stable thereafter (). Blends responded according to their proportions of PS and CS, which agrees with previous reports.[Citation6,Citation13] PS granules swell rapidly, generating high viscosity that quickly declines.[Citation6] As the CS proportion increased, the initial peak diminished and the subsequent fall was less drastic, because its granules were more stable since each starch inhibited swelling of the other, thus maintaining granule rigidity.[Citation6] Due to the difference in swelling, gelatinization process, and internal organization between native starches, allows to modify the resulting viscosity during heating and cooling stages in the blends.
Figure 6. Viscosity curves of native starches and blends of them (CS/PS).
Viscosity recovery (C-H) was higher in CS20PS80, CS40PS60, and CS60PS40, which agrees with other reports for these same blends.[Citation29] This behavior could be probably for molecular interactions and granules between PS and CS in blends raised the recovery values through formation of a matrix with composites of swollen granules (), which provides the gel more stability.[Citation4,Citation13,Citation24]
Conclusion
The blends of normal corn and PSs exhibited physicochemical, texture, and viscosity characteristics that differed from those of the source native starches. These properties varied according to the proportions of each starch in the blends. No differences in rheological properties were observed between the studied starch blends. Blends hardness values were higher than PS, due to the formation of a reinforced matrix, similar results were observed in polarized light. Mixing of PS with normal CS created blends that mitigated some of the more extreme properties (SP, gel hardness, gelatinization enthalpy, and storage module) of the two native starches, resulting in different functionalities and potential applications where each native starches cannot be used, due to its less stability in processing conditions. Blends starches allow the modification of native starches without the use of chemical, physical, and enzymatic treatments, reducing costs, production times, and the impact on the environment and the use of alternative source for the industry requirements.
References
- Karam, L.; Grossmann, M.; Silva, R.; Ferrero, C.; Zaritzky, N. Gel Textural Characteristics of Corn, Cassava and Yam Starch Blends: A Blend Surface Response Methodology Approach. Starch/Starke 2005, 57, 62–70.
- Singh, N.; Singh, J.; Lovedeep, K.; Singh, N.; Singh, B. Morphological, Thermal and Rheological Properties of Starches from Different Botanical Sources. Journal of Food Chemistry 2003, 81, 219–231.
- Pérez, S.; Bertoft, E. The Molecular Structures of Starch Components and Their Contribution to the Architecture of Starch Granules: A Comprehensive Review. Starch/Stärke 2010, 62, 389–420.
- Puncha-arnon, S.; Pathipanawat, W.; Puttanlek, C.; Rungsardthong, V.; Uttapap, D. Effects of Relative Granule Size and Gelatinization Temperature on Paste and Gel Properties of Starch Blends. Journal of Food Research International 2008, 41, 552–561.
- Ortega-Ojeda, F.F.; Eliasson, A.C. Gelatinization and Retrogradation Behavior of Some Starch Blends. Starch/Starke 2001, 53, 520–529.
- Park, E.; Kim, H.; Kim, J.; Lim, S. Pasting Properties of Potato Starch and Waxy Maize Starch Blends. Starch/Stärke 2009, 61, 352–357.
- Srichuwong, S.; Sunarti, T.C.; Mishima, T.; Isono, N.; Hisamatsu, M. Starches from Different Botanical Sources II: Contribution of Starch Structure to Swelling and Pasting Properties. Journal of Carbohydrate Polymers 2005, 62, 25–34.
- BeMiller, J.; Whistler, R. Starch: Chemistry and Technology, 3rd Ed.; Elsevier: Oxford, 2009.
- Elliason, A.C. Starch in Food. Structure, Function and Applications; CRC Press: Cambridge, England, 2004.
- Kaur, G.; Sharma, S.; Singh, B.; Dar, B.N. Comparative Study on Functional, Rheological, Thermal and Morphological Properties of Native and Modified Cereal Flours. International Journal of Food Properties 2015, 19, 1949–1961.
- Ortega-Ojeda, F.; Larsson, H.; Eliasson, A. Gel Formation in Blends of High Amylopectin Potato and Potato Starch. Journal of Carbohydrate Polymers 2004, 56, 505–514.
- Chen, J.; Lai, V.; Lii, C. Effects of Compositional and Granular Properties on the Pasting Viscosity of Rice Starch Blends. Starch/Stärke 2003, 55, 203–212.
- Waterschoot, J.; Gomand, S.; Fierens, E.; Delcour, J. Starch Blends and Their Physicochemical Properties. Starch/Stärke 2014, 66, 1–13.
- Noda, T.; Fujikami, S.; Mura, H.; Takigawa, S.; Endo, C.; Fukushima, M. Effect of Potato Starch Characteristics on the Textural Properties of Korean-Style Cold Noodles Made from Wheat Flour and Potato Starch Blends. Journal of Food Science Technology Research 2006, 12, 278–283.
- Singh, N.; Isono, N.; Srichuwong, S.; Noda, T.; Nishinari, K. Structural, Thermal and Viscoelastic Properties of Potato Starches. Journal of Food Hydrocolloids 2008, 22, 979–288.
- Singh, N.; Inouchi, N.; Nishinari, K. Structural, Thermal and Viscoelastic Characteristics of Starches Separated from Normal, Sugary and Waxy Maize. Journal of Food Hydrocolloids 2006, 20, 923–935.
- Gibson, T.; Solah, V.; McCleary, B. A Procedure to Measure Amylose in Cereal Starches And Flours with Con A. Journal of Cereal Science 1997, 25, 111–119.
- Rodríguez, M.E.; Yañez-Limón, J.M.; Alvarado, J.P.; Vargas, H.; Sanchez-Sinencio, F.; Figueroa, M.; Martínez, V.F.; González-Hernández, J.; Silva, M.D.; Miranda, L.C. Influence of Structural Changes During Alkaline Cooking on the Thermal, Rheological and Dielectric Properties of Maize Tortillas. Journal of Cereal Chemistry 1996, 73, 593–600.
- Anderson, A.; Conway, H.; Pfeifer, V.; Griffin, E. Gelatinization of Corn Grits by Roll and Extrusion Cooking. Journal of Cereal Science 1969, 14, 4–12.
- Toro-Vásquez, J.; Gómez-Aldapa, C.; Aragon-Piña, A.; Brito-de la Fuente, E.; Dibildox-Alvarado, E.; Charó-Alonso, M. Interaction of Granular Maize Starch with Lysophosphatidylcholine Evaluated by Calorimetry, Mechanical and Microscopy Analysis. Journal of Cereal Science 2003, 38, 269–279.
- Noda, T.; Kottearachchi, N.S.; Tsuda, S.; Motoyuki, M.; Takigawa, S.; Endo, C.M.; Kim, S.J.; Hashimoto, N.; Yamauchi, H. Starch Phosphorous Content in Potato (Solanum Tuberosum L.) Cultivars and Its Effect on Other Starch Properties. Journal of Carbohydrate Polymers 2007, 68, 793–796.
- Tester, R.; Karkalas, J.; Qi, X. Starch-Composition, Fine Structure and Architecture. Journal of Cereal Science 2004, 39, 151–165.
- Lin, J.; Kao, W.; Tsai, Y.; Chang, Y. Effect of Granular Characteristics on Pasting Properties of Starch Blends. Carbohydrate Polymers 2013, 98, 1553–1560.
- Karam, L.; Ferrero, C.; Martino, M.; Zaritzky, N.; Grossmann, M. Thermal, Microstructural and Textural Characterization of Gelatinized Corn, Cassava and Yam Starch Blends. International Journal of Food Science Technology 2006, 41, 805–812.
- Hagenimana, A.; Pu, P.; Ding, X. Study on Thermal and Rheological Properties of Native Rice Starches and Their Corresponding Blends. Journal of Food Research International 2005, 38, 257–266.
- Muñoz, L.; Pedreschi, F.; Leiva, A.; Aguilera, J. Loss of Birefringence and Swelling Behavior in Native Starch Granules: Microstructural and Thermal Properties. Journal of Food Engineering 2015, 152, 65–71.
- Crosbie, G.; Ross, A. The RVA Handbook; AACC International: St. Paul, MN, 2007, 152 pages.
- Kaur, M.; Singh, S. Physicochemical, Morphological, Pasting and Rheological Properties of Tamarind (Tamarindus Indica L.) Kernel Starch. International Journal of Food Properties 2015, 19, 2432–2442.
- Zhang, Y.; Gu, Z.; Hong, Y.; Li, Z.; Cheng, L. Pasting and Rheological Properties of Potato Starch and Maize Starch Blends. Starch/Stärke 2011, 63, 11–16.