
ABSTRACT
The aim of this study was to determine the permeability of water and oil through porous potato discs by developing an engineering model using Darcy’s law relation, mass balance equation, and poroelasticity relations at temperatures between 25–80°C. A finite element package was used to solve these equations in order to obtain the flow velocity at different pressure levels. The water permeability values were in the range of (2 to 4) × for the temperature range from 70–80°C, and the oil permeability values were in the range of (2 to 12) ×
for the temperature range from 25–70°C under the applied pressure range of 138 to 345 kPa. The moisture and oil content of the potato discs were measured experimentally both before and after each permeability experiment. An Arrhenius model was used to represent permeability as a function of water or oil content, and temperature. The velocity-pressure gradient data of oil and water through the potato discs exhibited a threshold pressure gradient, which needed to be overcome to initiate fluid flow.
Introduction
Food processes, like frying, drying, solvent extraction, microwave heating, baking, membrane separation, and reverse osmosis, have a significant pressure development. Permeability is an important physical property for studying the transport mechanism of porous foods when pressure driven flow is involved. Permeability is a property that indicates the ability of a fluid to flow through a material as a result of pressure gradient. High permeability of a material will allow fluid to move rapidly. Permeability is affected by the nature of porous material and flowing fluid, and factors like temperature, oil content, moisture content, gas content, etc. A porous food matrix consists of interconnected pores through which fluid can move.[Citation1] During frying of a porous food matrix, like potatoes, moisture, oil, and heat transport occur with the temperature and pressure changing spatially and temporally. Initially, the pressure increases rapidly after immersing the potato samples into the hot oil for frying. As potato discs contain higher moisture content in the beginning, the pressure rise is higher initially due to rapid evaporation and build-up of pressure.[Citation2] This prevents the oil from entering the pores of potatoes in the beginning of frying. As vapors escape the matrix, a negative pore pressure is developed inside the potato structure due to its suction potential and capillary effects. The negative pressure causes increase of oil uptake when the pore space becomes available due to loss of moisture. After frying, when the cooling starts, the pressure further decreases. The negative pressure aids in absorption of oil at the surface during both frying and post-process cooling. Therefore, oil uptake and pressure development during frying are correlated.[Citation2] In other applications, such as microwave heating and baking, pressure is generated due to evaporation.[Citation3,Citation4] During oil extraction from a porous food matrix, the applied pressure squeezes out the fluid.[Citation5] In the later stages of drying, water moves due to negative capillary pressure in an unsaturated solid.[Citation5]
Despite of its importance, the permeability of foods has not been widely measured. For extensive research in the field of transport mechanisms in food materials, permeability values are needed. For example, permeability values for fried foods are needed for modeling oil uptake during frying. Datta[Citation5] first measured the permeability of water in potato and muscle tissues to be in the range of 10−17–0−19 m2 at room temperature. Hence, for numerous applications, permeability is an important property, which plays a role in transport of oil and water in the porous food matrix in the presence of pressure gradient.
Permeability is also a key parameter in tissue engineering, petroleum engineering, soil science, and in biomedical applications. Different methods are adopted for different samples in different fields. In bone tissue engineering, the permeability of porous scaffold or tissue was measured by perfusion system in several studies, either by constant or the falling head method.[Citation6–Citation8] Computational fluid dynamics (CFD) and semi-empirical Kozeny equations have also been used to predict the permeability of scaffolds.[Citation9] The permeation test is another common method used for measuring permeability of biological soft tissues and gels. In a permeation test, the permeability can be determined directly by measuring the amount of fluid flow through the porous material in a given time under an external applied pressure, as obtained by Darcy’s law:[Citation1,Citation10]
where, is the apparent fluid flow velocity (
),
is the permeability of potato (
),
is the dynamic viscosity of flowing fluid
(
), and
is the pressure gradient vector (
). The objectives of this study were to determine both oil and water permeability of potato discs at different temperatures. The change of thickness and weight was also investigated in each case.
Methodology
Sample preparation
The potatoes, of Russet variety, were obtained from a local grocery store. The samples were stored at room temperature for approximately 1–3 days before using them for experiments. The potatoes were peeled using a stainless steel potato peeler and were cut into circular discs using a slicer and a core cutter. The diameter of each disc was about 45 mm and the thickness was about 1.45–1.80 mm. In this study, tap water and soybean cooking oil (Crisco brand, The J. M. Smucker Co., Orville, OH, USA) were used to measure their flow rate as a function of pressure gradient through the potato discs.
Experimental set-up
For each experimental run, a potato disc was placed in the sealed steel column of membrane cell, immersed in water or oil (Fig. 1A). A schematic diagram of the experimental setup is shown in Fig. 1A. A high-pressure resistant with porous membrane disc, SEPA ST membrane cell (Osmonic Inc., Minnetonka, MN, USA) was used to flow the water or oil through potato disc under applied pressure. The maximum withstanding pressure of this cell is 5500 kPa at 121°C. For each experimental run, a potato disc was placed on top of the porous membrane disc of the cell. Next, the cell column was filled with fluid (water or oil) and placed in a water bath for attaining the desired temperature. After the column had been equilibrated at a desired temperature, it was sealed with the help of couplings and O-rings. A nitrogen gas cylinder was connected to the top of the cell for providing a constant pressure, which caused fluid flow through the membrane. The permeated liquid was collected in a beaker placed in a weighing balance at atmospheric pressure. The fluid was collected continuously under applied pressure, and its weight was recorded by using a weighing scale connected to a data logger. The steady fluid velocity for both water and oil flow through potato disc was determined for each applied pressure. In case of pressure-driven oil flow, the fluid velocity was measured for the temperature range of 25–70°C and during the pressure-driven water flow, the fluid velocity was recorded for the temperature range of 70–80°C because below 50°C, there was no initiation of water flow. The design of our experimental apparatus did not allow conducting experiments at the frying temperatures. It is expected that the permeability relation developed in this study would provide estimated values upon extrapolation to the frying temperatures. An important precaution for this setup was that it had to be sealed properly at various joints for maintaining the applied pressure drop during an experiment. After initial trials, the applied pressure was selected not to be too high to prevent detachment of particles from the potato matrix. The maximum applied pressure drop was 345 kPa. In some experimental runs, for which the flow rate through the duration was not steady, were discarded. Also, the change in thickness and weight of potato disc were recorded for each experimental run by measuring the thickness and weight before applying pressure, and after releasing the pressure. For each treatment, three potato discs were evaluated for these experiments.
Determination of moisture content and oil content
The moisture content of the potato discs was measured from the crushed samples. The samples that were precooled in liquid nitrogen were grinded into powder using a coffee grinder to obtain homogenous powder mixture. The powdered samples were then analyzed for moisture content using an automatic moisture analyzer (Model: OHAUS MB35, Ohaus, Switzerland). The moisture analyzer was calibrated against,[Citation11] method no. 934.01 (“Official Method of Analysis of AOAC International”). The prepared powdered samples of 0.5 g were spread on the aluminum pans and placed inside the moisture meter. The samples were heated at 105°C inside the moisture meter until their weight became constant. The moisture content values measured by the moisture meter were converted to the equivalent AOAC method No. 934.01 based values using the calibration curve.
Oil content measurement was performed using the SOXTEC apparatus (Soxtec 1043 HT6, Tecator, USA) based upon,[Citation12] method No. 991.36 (“Official Method of Analysis of AOAC International”). For the oil extraction, the powdered dry samples were used, which were prepared by crushing them in the coffee grinder followed by dipping in liquid nitrogen and drying in a convection oven for about 2 h. After drying, 1 g of the powdered sample was placed in a cellulose thimble, which was later inserted in the Soxtec extraction unit for oil extraction. Oil from the samples was extracted in an aluminum cup with petroleum ether.
Engineering model for permeability measurement
Permeability value was obtained from the predicted velocity-pressure gradient curves by using a commercial finite elements software package (COMSOL Multiphysics 5.0; Comsol Inc., Burlington, MA). During pressure driven flow through the porous media, fluid velocity depends on the fluid permeability of the matrix. Under the applied pressure fluid flow also affects the structural deformation that causes structural displacement. The model takes into account both pressure driven flow and structure deformation to predict the appropriate fluid velocity and obtain corresponding permeability values.
Assumptions
The mechanism of pressure driven flow was assumed to follow Darcy’s law. The system was taken as steady state and the deformation of potato discs during experiments was assumed to have poroelasticity relations because the steady state part of pressure and flow rate data was used for estimating permeability. The potato sample was also assumed to be isotropic and constant values for density, porosity, and Young’s modulus were used in the model. The gravitational forces were disregarded due to their negligible value in comparison to the forces applied by nitrogen gas under high pressure.
Governing equations
The permeability model solved the equations of Darcy’s physics and poroelasticity relations to determine the fluid velocity and displacement of the sample structure under applied pressure. Darcy’s law defines the velocity () of fluid phase (
= w,o) driven by pressure gradient through interstices in a porous medium. The model performed the mass balance on fluid phase flowing with velocity governed by Darcy’s law. The Darcy’s law Eq. (1) was combined with continuity Eq. (2) to provide a complete mathematical model for predicting porous media flows. The equations are:[Citation13]
Here, is the velocity (m
),
is the permeability of the porous medium (
),
is the dynamic viscosity (Pa.s) of fluid
and
(Pa) is the pressure,
is the fluid density (
),
is the porosity, and
is the mass source term (kg
). Since the experiments were conducted steady state,
can be taken as zero in eqn. (2).
was also taken as zero, since there was no source or sink of fluid in the matrix.
For predicting the structure displacement of potato disc under the applied pressure, an equilibrium momentum balance equation, a constitutive equation relating stress and strain, and a kinematic equation relating displacement to strain were taken into account.[Citation14] The tensor form of momentum balance equation from Newton’s second law is (assuming the system is steady-state):
where, is the stress and
is the body force per unit volume.
The stress–strain constitutive equation is obtained from Hooke’s law:
where, is the coefficient of elasticity and
is the strain tensor. The kinematic relation between the linear strain (
) and displacement (
) are:
The predicted fluid velocity from the fluid flow model determined the appropriate permeability values, and the structural displacement elucidated the structural deformation under the applied pressure.
Initial and boundary equations
Since the problem was solved as stationary, initial conditions were not needed. There was no flow on the right side (boundary 2) of the sample disc, attached with the column (). The upper side (boundary 1) of potato slice was at the applied pressure () used in an experimental run and the bottom side (boundary 3) was at the atmospheric pressure (
). While determining the structural displacement of a disc, the pressure applied to the top and bottom were considered as boundary loads. Therefore, from momentum balance equation:
where, is the applied force per unit area and P is the pressure. The roller boundary condition was used for the bottom and right sides, i.e., boundary 2 and 3 of the disc because the right side was attached with the column and bottom side was attached with the porous membrane disc. Roller boundary condition implies that there was no displacement in the direction perpendicular to these two boundaries ():
The initial displacement value for the potato disc was also taken as zero because the material points in the matrix were stationary at time, t = 0. Hence,
Material properties
The material properties used in the model are listed in . In this study oil and water flowed through the potato disc under applied pressure. Hence, the properties of oil, water, and potato were used in the model to solve the porous media flow and structural displacement equations.
Table 1. Material properties.
Numerical solution
The equations for porous media flow and solid mechanics were solved using a commercial finite element software package (Comsol Multiphysics, Comsol Inc., Burlington, MA). A mapped mesh was used with predefined distribution type and 50 elements with an element ratio of 0.5. The solution was obtained using the Multifrontal Massively Parallel Sparse direct Solver. The relationship between the permeability and velocity was predicted by the parametric sweep of permeability values. The permeability values were varied in the range from 1 × 10⁻¹⁴ to 1 × 10⁻¹⁷. The predicted velocities for different permeability values at each pressure point were obtained from the mathematical model. Three-four sets of velocity-pressure gradient data from model were acquired by varying the permeability values. The obtained velocitypressure gradient curves for different permeability values are presented in and . The permeability value was determined from predicted velocity-pressure drop curves that exhibited least mean squared error (MSE) with experimental data points. The MSE was calculated as,
Figure 1. (a) A schematic of experimental setup for oil and water permeability measurement for potato discs. (b) Boundary conditions for Darcy’s law equation and structural displacement (P1 = applied pressure, Patm = atmospheric pressure).
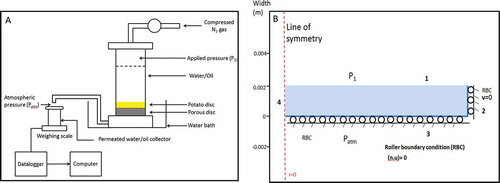
Figure 2. Oil permeability of potatoes at (a) 25°C, (b) 40°C, (c) 50°C, and (d) 70°C.
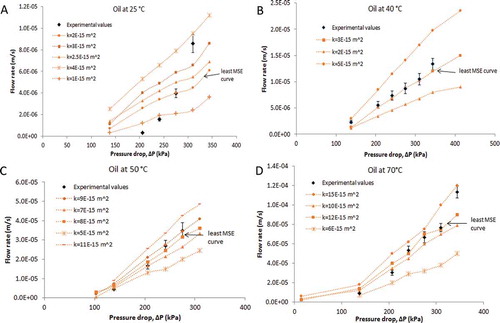
Figure 3. Water permeability of potatoes at (a) 70°C, (b) 75°C, and (c) 80°C.
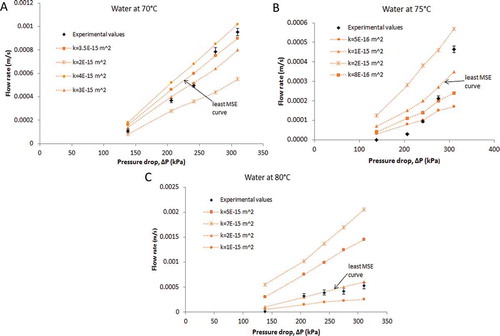
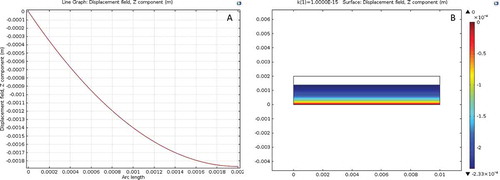
Figure 4. (a) The displacement of a raw potato idsc as a function of thickness under the applied pressure of 345 kPa. (b) The 2D view of compression of a raw potato disc under the applied pressure of 345 kPa.
where n is the number of experimental data points, is an experimental value of velocity, and
is the predicted value of velocity for a given pressure drop.
Data analysis
The experimental velocity data of pressure-driven oil and water flow were analyzed based on three replications (n = 3). For each replication, the flow rate was collected at 5 sec intervals. Fifty data points of flow rate were used to calculate the average value for each pressure drop after it reached steady state flow. Two-way analysis of variance (ANOVA; time × pressure) at a significance level of 0.05 was performed using statistical analysis tool (R version 3.1.1, 2014, The R Foundation for Statistical Computing) to analyze the effect of time and pressure on the fluid velocity. The analysis indicated that the fluid velocities at a given pressure did not change significantly (p > 0.1) with time during constant flow period, which implies that the steady state assumption was valid. However, the pressure effect on fluid velocity was found to be significant (p < 0.0001). The error bars representing the standard error were used in and , to show the variability of the experimental data for each pressure level.
Results and discussion
The velocity-pressure gradient graphs from engineering model and experiments are presented to compare and investigate the flow trends under applied pressure at different temperatures. The permeability values of oil and water through potato discs obtained from graphs were analyzed as a function of temperature, and an Arrhenius equation-based model was also established correlating permeability values with fluid content (moisture/oil) and temperature.
Graphical analysis and comparison between engineering model and experiments
The graphical analysis of fluid velocity-pressure gradient curves revealed the trend of fluid velocities at different applied pressures in comparison to the experimental data. The predicted velocity-pressure gradient curves obtained by varying and
from the model are shown in and . In general, all the flow rate-pressure gradient plots show an x-axis intercept. There is a threshold pressure gradient
in each curve, below which there is no flow. After the threshold gradient is crossed, the curves follow Darcy’s law. By applying generalized Darcy’s law equation, the fluid velocity can be obtained:
The purpose of comparison between model and experimental flow rate-pressure gradient curves was to determine the permeability values using parametric sweep. The permeability values causing least mean squared error (MSE) for a given flow rate versus pressure-drop data set were selected to represent Darcy’s flow behavior at a given temperature. The MSE for selected parameter values (permeability) were in the range of 4 × 10⁻⁷ to 6 × 10⁻¹¹ m2/s2. The calculated flow rate versus pressure-drop curves did not pass through the origin.
Oil and water permeability data and structural changes of potato disc
The oil permeability values of potato discs, obtained from , for four temperatures (25–80°C) are shown in . As can be seen the oil permeability values increased with temperature and were found in the range of (2 to 12) × . To our knowledge, the oil permeability values of potatoes have not been measured experimentally in the past. Datta[Citation5] found the water permeability of potato and meat tissues to be in the range of 10−17–10−19m2 at room temperature.
Table 2. Oil permeability data and fluid content of potato at different temperatures.
The reason for the increase of oil permeability with temperature is expected to be the breaking of hydrogen bonds of potato starch granules with increasing temperature. The potato structure consists of starch granules that are bonded together by hydrogen bonds. The hydrogen bonding provides rigidity to the potato matrix.[Citation15] However, when the gelatinization process initiates, hydrogen bonds break and make the structure compact and soft.[Citation16,Citation17] During gelatinization, heat vibrates the starch molecules and promotes the disruption of hydrogen bonds that cause plasticization of starch molecules.[Citation18] This phenomenon is expected to enhance the fluid mobility and increase the permeability value. Aguilera et al.[Citation19] observed that the onset gelatinization temperature of potatoes was above 65°C In our study, the maximum permeability of oil (12 × 10−15m2 at 70°C) is expected to have been caused by gelatinization above 65°C. The threshold pressure gradient, J was obtained from the velocity-pressure gradient curves for these temperatures and were found to be in the range of 103–248 kPa (). J is the minimum pressure gradient to initiate the flow. At 70°C, the J-value was smaller compared to that at 25°C. It elucidated that the threshold pressure gradient decreased at higher temperature due to increase of matrix mobility.
In comparison with the raw potato, the moisture content of the sample was observed to decrease after each experimental run with oil flow at four temperatures (). This could have occurred because the moisture in the matrix is expected to have been swept away by the penetrating oil and the pores previously occupied by water were partially replaced by oil. Moreover, oil was partially absorbed into the potato matrix during flow. The final absorbed (residual) oil content of potato discs was observed to decrease with the increase in temperature. Since the oil permeability values increased as a function of temperature, the oil drainage is also expected to have increased, which reduced the residual oil content.
In case of water, the permeability values were obtained in the range of (2 to 4) ×10−15m2 for the temperature range of 70–80°C (). During the experiments there was no initiation of water flow between 25–50°C under the applied pressure of 138–345 kPa due to impermeability of the potato matrix to water at lower temperatures. The middle portion of raw potato disc was ruptured at the higher pressure (>350 kPa) because of its impermeable behavior. When the raw potato disc was immersed in water under applied pressure at temperature below 50°C, water might create hydrogen bonding with starch granules, which increased the stiffness and prevented the water flow. In our study, the water flow occurred at 70°C, which is expected to be due to loss of crystallinity and acceleration of gelatinization process.[Citation20] Liu et al.[Citation21] also discussed about the loss of crystallinity in the starch granules in presence of water. In that study, the loss of birefringence of potato starch was found to begin at 50°C, which implied that there was a loss of molecular orientation in the granules initiated at this temperature. The authors postulated that the disruption of intermolecular hydrogen bonds in swollen granules was responsible for the disappearance of crystalline regions above this temperature. Due to this phenomenon, we observed water flow at 70°C and above, and thus measured permeability at 70,75, and 80°C. The water permeability values did not change significantly under the applied pressure of 138 to 345 kPa with increase in temperature between 70 and 80°C and the threshold pressure gradient, J-values were found in the range of 118–172 kPa for these three temperatures (). The moisture content of a sample was observed to increase, after the pressure-driven water flow at these three temperatures () compared to the raw potato. During flow, water might diffuse partially into the structure. Hence, the pressure-driven flow influenced the moisture content of the potato matrix.
Table 3. Water permeability data and fluid content of potato at different temperatures.
Both pressure-driven oil and water flow caused structural deformation during the experiments. The pressure-driven oil flow compressed the disc, which increased as a function of temperature (). This phenomenon is associated with the loss of rigidity of the sample and decrease of the Young’s modulus value with increase of temperature.[Citation22] The pressure-driven water flow caused swelling at 25 and 40°C () and compression in the temperature range of 50–80°C under the applied pressure of 138 to 345 kPa. The swelling of the potato disc might be caused by the hydrogen bonding and swelling of starch granules[Citation23] in the matrix. Water flow above 50°C is expected to have caused disruption of hydrogen bonds,[Citation21] change in physio-chemical properties, and softening of the potato disc, which caused compression at these temperatures. This potato–water interaction is a somewhat similar phenomena as clay–water interaction. In the clay–water system, a rearrangement of water molecules takes place due to the surface induced hydrogen bonding.[Citation24,Citation25] As a result, water into the clay system exhibits quasi-crystalline behavior. This behavior attributes greater rigidity and viscosity to the water near the surface. Since similar phenomena were also observed in the potato–water system, which prevented water flow at lower temperatures (≤50°C) the porous biopolymer potato may be compared with fine-grained clay. The structural deformation was also calculated from the finite element model under the applied pressure. The compression of the raw potato disc was observed to be 49% from the model at applied pressure of 345 kPa (maximum pressure used in this experiment). Figure 4A presents the displacement of the raw potato disc as a function of thickness and Fig. 4B shows the complete compression at this pressure.
Table 4. Change of thickness and weight of potato disc at different temperatures after pressure-driven oil flow.
Table 5. Change of thickness and weight of potato disc at different temperatures after pressure-driven water flow.
The deformation data from both model and experiments might have some errors because of limitations of both methods. During the experiments, the measurement of deformation was obtained by measuring the thickness of potato discs before and after applying pressure. The measurement of thickness after releasing the pressure is expected to cause additional displacement that would affect the measured values. In the model, the displacement was recorded when flow was in progress. However, the model used constant Young’s modulus (E) that may introduce error because during fluid flow, moisture content changes, which is expected to change E.
Oil and water permeability equation model for potato
The water permeability () values of the potato disc were correlated with moisture content of potato sample and water temperature using the Arrhenius type exponential relationship:
where, is the moisture content (g water/g solids),
is the temperature (
), and
and
are the constants. The Arrhenius type exponential relationship for oil permeability (
) was also established, where the
-values through potato disc were dependent on the final oil content of potato sample and oil temperature.
where is the oil content (g oil/g solids), T is the temperature (
) and B and
are the constants. A linear regression procedure was used to estimate the constants for Eqs. (13) and (14). The constants calculated for oil and water permeability equation are shown in . Therefore, oil and water permeability value through the potato disc can be calculated from the permeability equations as a function of temperature and fluid content (oil or water).
Table 6. Estimated constant values of oil and water permeability from 13 and 14.
Conclusions
The permeability values of oil and water flow through potato discs at different temperatures were estimated by solving Darcy’s law and comparing the model predictions with experimental data on flow rate versus pressure gradient. The parametric sweep of permeability values was performed to calculate the mean square errors of calculated versus experimental flow rates for a given pressure drop. The water permeability values were found in the range of (2 to 4) ×10−15m2 for the temperature range from 70–80°C and the oil permeability values were in the range of (3 to 13) ×10−15m2 for the temperature range from 25–70°C the applied pressure of 345 kPa. During experiments, pressure-driven water, and oil flow compressed the discs at these temperatures. However, during water flow under the applied pressure of (138–345 kPa), below 50°C, the potato disc swelled and there was almost no flow through the potato disc due to the hydrogen bonding of starch granules with entrapped water. Water flow initiated after 50°C, which was expected to have been caused by loss of crystallinity and disruption of hydrogen bonds among starch granules. This also caused compression and loss of stiffness of the potato discs. The deviation of Darcy’s law was observed in velocity versus pressure gradient curves due to threshold pressure gradient. The pressure-driven fluid flow changed the moisture and oil content of potato disc as a function of temperature. An Arrhenius model was established correlating the water and oil permeability of potatoes with experimentally obtained moisture and oil content, respectively. Therefore, the permeability equation obtained from this study can be used with other mathematical models to work with various fluid transport applications.
Nomenclature
Table
Acknowledgments
The authors are grateful to Professor Munir Cheryan for providing the membrane cell column and guidance on its initial setup. The authors would also like to thank Dr. Chris J. Koh for providing valuable suggestions for helping to improve this manuscript.
Funding
This work was partially funded by Pepsi Co. Inc.; however, the views and statements included in this manuscript are those of the authors and do not necessarily represent position or policy of Pepsi Co. Inc.
Additional information
Funding
Related Research Data
References
- Datta, A. Porous Media Approaches to Studying Simultaneous Heat and Mass Transfer in Food Processes. I: Problem Formulations. Journal of Food Engineering 2007, 80, 80–95.
- Sandhu, J.; Bansal, H.; Takhar, P.S. Experimental Measurement of Physical Pressure in Foods During Frying. Journal of Food Engineering 2013, 115, 272–277.
- Ni, H.; Datta, A.K. Moisture, Oil and Energy Transport During Deep Fat Frying of Food Materials. Food and Bioproducts Processing 1999, 77, 194–204.
- Ni, H.; Datta, A. Heat and Moisture Transfer in Baking of Potato Slabs. Drying Technology 1999, 17, 2069–2092.
- Datta, A. Hydraulic Permeability of Food Tissues. International Journal of Food Properties 2006, 9, 767–780.
- Haugen, H.; Will, J.; Köhler, A.; Hopfner, U.; Aigner, J.; Wintermantel, E. Ceramic Tio 2-Foams: Characterisation of a Potential Scaffold. Journal of the European Ceramic Society 2004, 24, 661–668.
- Kohles, S.S.; Roberts, J.B.; Upton, M.L.; Wilson, C.G.; Bonassar, L.J.; Schlichting, A.L. Direct Perfusion Measurements of Cancellous Bone Anisotropic Permeability. Journal of Biomechanics 2001, 34, 1197–1202.
- Jeong, C.G.; Zhang, H.; Hollister, S.J. Three-Dimensional Poly (1, 8-Octanediol-Co-Citrate) Scaffold Pore Shape and Permeability Effects on Sub-Cutaneous in Vivo Chondrogenesis Using Primary Chondrocytes. Acta Biomaterialia 2011, 7, 505–514.
- Truscello, S.; Kerckhofs, G.; Van Bael, S.; Pyka, G.; Schrooten, J.; Van Oosterwyck, H. Prediction of Permeability of Regular Scaffolds for Skeletal Tissue Engineering: A Combined Computational and Experimental Study. Acta Biomaterialia 2012, 8, 1648–1658.
- Bear, J. Dynamics of Fluid in Porous Media; Elsevier: New York, NY, 1972.
- AOAC. Official Method of Analysis of AOAC International; Journal of AOAC International, Gaithersberg, MD, Official Method 934.01, 1995.
- AOAC. Official Method of Analysis of AOAC International. Journal of AOAC International, Gaithersberg, MD, Official Method 991.36, 2000; 17.
- Takhar, P.S. Unsaturated Fluid Transport in Swelling Poroviscoelastic Biopolymers. Chemical Engineering Science 2014, 109, 98–110.
- Marchidan, A.; Sullivan, T.N.; Palladino, J.L. Load Cell Design Using Comsol Multi-Physics, In Excerpt from the Proceedings of the 2012 COMSOL Conference in Boston, MA, October 3–5 2012.
- Olkku, J.; Rha, C. Gelatinisation of Starch and Wheat Flour Starch—A Review. Food Chemistry 1978, 3, 293–317.
- Reeve, R.; Neel, E. Microscopic Structure of Potato Chips. American Potato Journal 1960, 37, 45–52.
- Spiruta, S.L.; Mackey, A. French-Fried Potatoes: Palatability as Related to Microscopic Structure of Frozen Par-Fries. Journal of Food Science 1961, 26, 656–662.
- Biliaderis, C.G. The Structure and Interactions of Starch with Food Constituents. Canadian Journal of Physiology and Pharmacology 1991, 69, 60–78.
- Aguilera, J.M.; Cadoche, L.; López, C.; Gutierrez, G. Microstructural Changes of Potato Cells and Starch Granules Heated in Oil. Food Research International 2001, 34, 939–947.
- Jenkins, P.J.; Donald, A.M. Gelatinisation of Starch: A Combined Saxs/Waxs/Dsc and Sans Study. Carbohydrate Research 1998, 308, 133–147.
- Liu, Q.; Charlet, G.; Yelle, S.; Arul, J. Phase Transition in Potato Starch-Water System I. Starch Gelatinization at High Moisture Level. Food Research International 2002, 35, 397–407.
- Thussu, S.; Datta, A.K. Texture Prediction During Deep Frying: A Mechanistic Approach. Journal of Food Engineering 2012, 108, 111–121.
- Da Silva, C.M.; Ciacco, C.; Barberis, G.; Solano, W.; Rettori, C. Starch Gelatinization Measured by Pulsed Nuclear Magnetic Resonance. Cereal Chemistry 1996, 73, 297.
- Low, P.F. Effect of Quasi-Crystalline Water on Rate Processes Involved in Plant Nutrition. Soil Science 1962, 93, 6–15.
- Miller, R.J.; Low, P.F. Threshold Gradient for Water Flow in Clay Systems. Soil Science Society of America Journal 1963, 27, 605–609.
- Poling, B.E.; Prausnitz, J.M.; O’Connell, J.P. The Properties of Gases and Liquids, Vol. 5.; McGraw-Hill: New York, NY, 2001.
- Esteban, B.; Riba, J.-R.; Baquero, G.; Rius, A.; Puig, R. Temperature Dependence of Density and Viscosity of Vegetable Oils. Biomass and Bioenergy 2012, 42, 164–171.
- Santos, J.; Santos, I.; Souza, A. Effect of Heating and Cooling on Rheological Parameters of Edible Vegetable Oils. Journal of food Engineering 2005, 67, 401–405.
- Wang, N.; Brennan, J. Changes in Structure, Density and Porosity of Potato During Dehydration. Journal of Food Engineering 1995, 24, 61–76.
- Thussu, S.; Datta, A.K. Texture Prediction During Deep Frying: A Mechanistic Approach. Journal of Food Engineering 2012, 108, 111–121.
- Welti-Chanes, J.; Aguilera, J.M. Engineering and Food for the 21st Century; CRC Press: Boca Raton, FL, 2002.
- Bourne, M. Food Texture and Viscosity: Concept and Measurement. Academic Press: San Diego, CA, 2002.