
ABSTRACT
Honey crystallization is a natural phenomenon commonly found in honey products. To better understand the characteristics of honey crystallization, the concentrations of the four major compositions (namely glucose, fructose, sucrose, and maltose) were determined in the liquid, crystal, and mixed forms of honey. Our study revealed the contents of glucose and fructose in three forms varied significantly (p < 0.05). Molecular dynamics simulation was performed to investigate honey crystallization process. All the simulation systems had a tendency to form a cubic crystal. When the ratio of glucose/fructose is 2.5:1, which is the same as the crystal found in honey, a shorter time and lower root-mean-square deviation were found compared to the ratios at 2:1, 1:1, and pure glucose. It infers that glucose/fructose at 2.5:1 is the most stable honey crystallization, relatively. The morphology of crystals found in honey, which was observed under an environment scanning electron microscope, looked like sticky balls with indistinct edges, different from that plates or granule of glucose crystal with flattened edges. These results indicated that the relative content of glucose and fructose had a significant effect on the crystallization of honey. The glucose/fructose at 2.5:1 probably is the critical ratio of honey crystallization, at which honey can form stable crystalline deposit speedily.
Introduction
Honey, a highly viscous sugar solution, is a natural sweet substance produced by bees.[Citation1] Honey has been gaining increasing attention due to its nutritive compositions such as fructose, glucose, sucrose, maltose, enzyme, amino acids, vitamins, and minerals.[Citation2–Citation4] For instance, fructose, which is abundant in honey, was reported to improve constipation due to its laxative function.[Citation5]
The freshly harvested honey is usually in the form of liquid. It is frequently supersaturated and susceptible of crystallization, at a rate mainly affected by the presence of nucleation seeds, the degree of super-saturation, and viscosity, which are associated with environmental temperature.[Citation6,Citation7] Some monofloral honeys (e.g., citrus) are naturally finely and homogeneously crystallized, while for most commercial honeys, undesired coarse crystal caused by spontaneous granulation is considered to be low quality attributing to phase separation, sedimentation or water activity increase up to levels which may be suitable for microbial growth.[Citation8,Citation9] In addition, sugars, particular glucose and fructose, as the primary ingredients in honey play a critical role in the crystallization.[Citation10] Because of the lower solubility, the glucose is believed to be the crystallizing sugar.[Citation11] It has been reported that pure glucose may crystallize as α-D-glucose monohydrate with the stable crystalline form below 50°C, as stable α-D-glucose anhydrous form between 50 to 80°C, and as stable β-D-glucose anhydrous form more than 80°C.[Citation12,Citation13] Dobre et al.[Citation14] also found that the phenomenon of crystallization was close related with the ratio of glucose to fructose in honey. But it is not clear what critical ratio of glucose to fructose results in the honey crystallization. Although the honey crystallization has been studied experimentally by many research groups, no suitable experimental methods are available for elucidating this crystallization mechanism at an in-depth molecular level.
Molecular dynamics (MD) simulation is a powerful computational tool, which has been reported to be a critical stratage to theoretically investigate such phenomenon at a molecular level. Computational MD simulations can help to explain the observations in experimentation, not only provide available information amendable to experimentation, but also even accurate predictions of physical properties of realistic systems. Therefore, it has been widely employed by many researchers as a valuable adjunct to their existing studies.[Citation15–Citation17] Yao et al.[Citation18] investigated the interaction between beta-cyclodextrin and starch molecular by using MD simulation method. They concluded that beta-cyclodextrin can inhibit the starch retrogradation in rice by interacting with starch molecular via non-covalent bond. In the present study, MD simulation was performed to understand the crystallization of a typical Chinese honey based on the sugar compositions determined in the different forms of honey. To our knowledge, this is the first study on MD simulations was used for investigation of honey crystallization.
Materials and methods
Honey samples
Wild, raw liquid honey was provided by Tong Xin Zi Chao Bio-Engineering Co., Ltd., Nanchang, China. The wild honey was freshly collected and then stored in a glass bottle for 7 days at room temperature until crystals appeared. Honeys in the forms of liquid, crystal, and mixed were selected for the following study. The liquid form was taken out from honey. Honey crystallized on the wall of the bottle and just above the surface of liquid form, was collected as crystal sample. The mixed form was collected from well-distributed honey with a glass rod.
Chemicals and reagents
Glucose and fructose standards were purchased from Aladdin (Internet Aladdin Chemical Reagent Co.), sucrose standard was obtained from the Food and Drug Verification Research Institute of China, maltose standard was purchased from Shanghai Blue Technology Development Co., Ltd. High-performance liquid chromatography (HPLC)-grade solvents including methanol and acetonitrile were purchased from Merck (Darmstadt, Germany). All other chemical reagents were of analytical grade.
Determination of sugar composition
Sugar composition in honey was analyzed following a published procedure with slight modification.[Citation19–Citation22] Agilent Technology 1100 series HPLC system equipped with a quaternary pump, a degasser, a thermostatic auto-sampler, an evaporative light scattering detector (ELSD) was used for the analysis of sugar composition in the selected honeys. A Hypersil NH2 (4.6mm × 250mm, 5 μm, Elite, Dalian, China) column was used for separation. The mobile phase was acetonitrile /water (80:20) and the flow rate was kept constant at 1.0 mL/min. Sixty milligrams of mixed, crystal, and liquid honey samples were, respectively, dissolved in 3 mL of distilled water and then filtered through a 0.45 μm filter. The injection volume of the sample was 10 µL. All individual sugars (glucose, fructose, sucrose, and maltose) were quantified based on the corresponding curves of the sugar standards.
Microscopy
The morphological studies of both honey and pure glucose crystal (control) were performed by using an environment scanning electron microscope (ESEM). Microscopic morphological images were taken using FEI Quanta200F.[Citation23]
MD simulation
MD simulation of honey crystals growth were carried out by employing the GROMACS 4.0.4 utilities.[Citation24,Citation25] GROMACS is a commonly used engine to perform MD simulations and energy minimization. The structures of four main sugars including glucose, fructose, sucrose, and maltose were obtained from the program-Materials Studio 4.4 which were saved as PDB (Program Database File) documents. For the water molecules, the simple point charge model (SPC) was applied. Approximately 25 g/100 g water content in honey was determined for simulation. Therefore, the reaction system was formed by a total of 480 molecules including fixed 120 water molecules, 20 sucrose molecules, and 60 maltose molecules. In order to investigate the effects of glucose and fructose on the crystal formation, the ratio of glucose/fructose at 1:1, 2:1, and 2.5:1, respectively, were employed in this system. GROMOS96 53a6 force field in was adopted for energy calculations. The equations of motion were integrated using the leapfrog method with a 2 fs time stop. The bond lengths in the sugar molecules were constrained using the LINCS31 algorithm. To start the simulation, the potential energy of the system was minimized by using steepest descent algorithm. After that, the system was equilibrated at 300 K by a full MD simulation. Coordinates were stored every 2 ps to the trajectory for analysis. The quantitative evaluation of the honey crystal conformation was provided by the root-mean-square deviation (RMSD), radius of gyration (Rg) and solvent accessible surface area (SASA) which was computed using g_rms, g_gyrate, and g_sas program in GROMACS, respectively. The electrostatic interaction energy (ΔEele) was computed using the Particle Mesh Ewald (PME) method. The cutoff radii for coulomb and van der Waals’ interactions energy were set to 10.0 and 14.0 Å, respectively. RMSD, which represents the structure changes of the honey crystal at time t, is defined by the equation:
where t is the time instant, N is the number of atoms, mi is the mass of atom i, M is the mass of all the atoms, ri(0) and ri(t) are the coordinates of atom i at time 0 and t, respectively. Rg, which represents the compactness of the honey crystal conformation, is defined by the equation:
where mi is the mass of atom i, ri is the coordinate of atom i with respect to the center of the molecule mass.
Results and discussion
Sugar composition
The HPLC chromatographs of mixed sugar standards (glucose, fructose, sucrose, and maltose) and honeys in the forms of liquid, crystal, and mixed are shown in . Four sugar compositions including glucose, fructose, sucrose, and maltose were detected in all three forms of honey. Glucose and fructose, which were identified as the two major sugars in honeys, accounted for about equal concentrations, while sucrose and maltose were present in very small amounts. The individual sugar contents in honeys are shown in . The glucose and fructose content ranged from 26.4 to 43.3 g/100 g and 18.4 to 27.2 g/100 g, respectively, and showed significantly difference (p < 0.05) among different forms of honey. Crystal honey was found to have the greatest amount of glucose (43.3 g/100 g) and the lowest concentration of fructose (18.4 g/100 g), while the liquid honey had highest concentration of fructose (27.2 g/100 g) and lowest concentration of glucose (26.4 g/100 g). These results indicated that the concentration of both glucose and fructose could significantly affect the crystallization of honey. According to the literature, some indexes based on sugars contents have also been associated with the crystallization tendency. Tosi et al.[Citation26] observed that the fructose/glucose ratio of 1.14 or less in honey would indicate fast crystallization in European honeys, while ratio value more than 1.58 indicated no tendency to crystallize. Generally, the glucose/fructose ratio in honey can be significantly influenced by the honey varieties and place of origin. For example, Marisol et al. found that the glucose/fructose ratio of acacia honeys was 1:1.5 in Spain, 1:1.7 in Romania, and 1:1.59 in Czech Republic, whereas the glucose/fructose ratio of sunflower honeys was 1:1.3 in Spain, 1:1.7 in Romania, and 1:1.1 in Czech Republic.[Citation27] In the present study, the ratio of glucose/fructose showed significant difference among liquid, mixed, and crystal forms of typical Chinese honey, which were determined as 1:1, 2:1 and 2.5:1, respectively. This result further proves that the ratio of glucose/fructose is an important indicator for crystallization among different honey samples.
Table 1. Sugar composition (g/100 g) in the forms of mixed, liquid, and crystal honey.A
Figure 1. HPLC chromatograms of mixed standards of sugars (glucose, fructose, sucrose and maltose) and honeys in the forms of liquid, crystal and mixed . Peak 1, 2, 3 and 4 represents fructose, glucose, sucrose and maltose, respectively .
Analysis of crystal morphology by ESEM
To better understand their microstructure, the crystals of honey and pure glucose were visualized using ESEM. and clearly showed that the morphology of honey crystal was irregular shaped with smooth edge. However, glucose crystal had a plate-like morphology with flattened edge ( and ). These results indicate that it is highly possible that sugar composition plays an important role in forming stable honey crystal.
Figure 2. SEM images of crystal of honey (a and b) and glucose (c and d). The magnification of a, c and b, d was 1500 and 3000 times, respectively.
MD simulation
To better understand the potential molecular mechanism of crystallization in honey, we conducted MD simulation to examine the phenomenon at molecular level. The above ratios (1:1, 2:1, and 2.5:1) indicated that sugars were the major part of the honey in , and the concentrations of glucose and fructose are believed to significantly affect the crystallization process of honey. Therefore, the glucose/fructose ratios at 1:1, 2:1, and 2.5:1 were adopted for the MD simulation. The MD simulation of pure glucose crystal was used as control. Then we investigated RMSD, Rg, SDSA, and ΔEele variations among honey crystals with different glucose/fructose ratios.
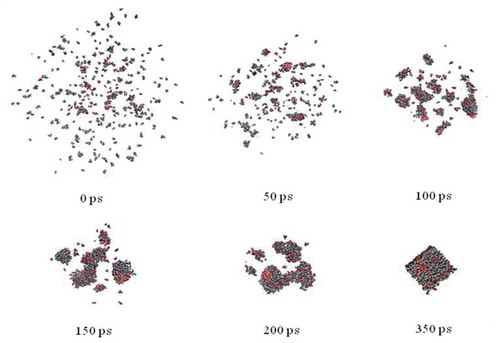
MD simulation was performed to analyze the conformational change of crystal growth. exhibits the snapshots of molecular configuration during honey crystallization with glucose/fructose ratio at 2.5:1. The disordered sugar molecules initially distributed in the system, and some crystal nuclei were gradually formed in the amorphous phase nucleate from the amorphous phase. The grain coarsening can be clearly observed. After crystal embryos growing, the ordered crystalline structure, which was in a cubic morphology, was finally formed. In our study, all of the four simulation models including glucose/fructose ratio at 1:1, 2:1, 2.5:1 and pure glucose can form stable crystals at the end of the simulation, but differ in the time for the formation of stable crystal phase. In , the minus in electrostatic interaction energy (ΔEele) and van der Waals’ interaction energy (ΔEvdw) represents attraction energy. The glucose/fructose ratio at 2:1 has highest ΔEvdw absolute value among all four models (p < 0.05), followed by glucose/fructose ratio at 1:1, which is significant bigger than that of glucose/fructose ratio at 2.5:1 and pure glucose crystal (p < 0.05). However, the pure glucose crystal has the highest electrostatic interaction energy (ΔEele) absolute value (–9297.20 kcal/mol, p < 0.05) among all four models, followed by honey crystal with glucose/fructose ratio at 2.5:1 (–6170.56 kcal/mol), 2:1 (–6120.64 kcal/mol), and 1:1 (–5944.04 kcal/mol). As the decrease of ΔEele absolute value, the Rg and SASA value correlatively increased, which meant the compactness of the honey crystal decreased. We can infer that it was electrostatic interaction energy gathering the sugar molecules to form the ordered configuration of crystal in . Therefore, this issue supports that glucose has relatively notable contribution for electrostatic interaction energy in the honey crystallization process. Giving the electrostatic interaction energy (ΔEele) was important for gathering the sugar molecules to form the ordered configuration of crystal, we further analyzed the ΔEele plot of sugar molecules of the crystal versus time at 300 K, which is shown in . It was observed that ΔEele value plot remain stable among all simulation models between the time period of 0 and 1000 ps. Consistent with the those results observed in , the ΔEele absolute value of pure glucose crystal was significantly higher than that of other honey models. This result indicated that the pure glucose crystal differed from honey crystal, which was agreement with the result of crystal morphology observed by ESEM. The van der Waals’ interaction energy (ΔEvdw) and the forming crystal time were also calculated in this study. As shown in , the model c with 2.5:1 of glucose/fructose ratio formed stable crystal at 350 ps, which was significantly shorter than that other simulation models (p < 0.05). In addition, the ratio at 2.5:1 RMSD value (5.29 ± 0.02) was lower than the other three models (p < 0.05) significantly, which meant the honey model at 2.5:1 was the most stable honey crystallization, relatively. Therefore, ratio 2.5:1 probably was a critical ratio of honey crystallization.
Table 2. RMSD, Rg, SASA, ΔEele, ΔEVdw and time value for models a, b, c, and d at the end of MD simulation.
Figure 3. Snapshots of crystallization process of honey with glucose/fructose ratio at 2.5:1 (model a) obtained from the MD simulation runs in water.
The MD simulation led to the generation of various plots, among which is the RMSD plot (). We calculated the RMSD for all sugar molecules from the initial to the final configuration, which were considered as a central criterion to measure the convergence of the crystal found in honey. The backbone RMSD value exhibited an abrupt rise at initial phase and then had a fluctuating decrease till stable for the trajectories of four simulation models (). In , the simulation with the glucose/fructose ratio at 1:1 fluctuated remarkably and showed greatest RMSD value up to 23 nm after 100 ps. The observations on the RMSD value plot in suggested that on average, the crystal structure formed by glucose/fructose ratio at 2.5:1 possess the strongest stability significantly, when compared to the other three models. Meanwhile, the results that the RMSD values reach stable at the end of simulation for all simulation models indicated that the simulation conducted in the present study can produce stable trajectory, thus providing a suitable basis for further analysis.
Figure 4. Plot curves of simulation systems of honey crystal with glucose/fructose ratio at 2.5:1, 2:1, 1:1 and pure glucose crystal versus time at 300 K; (a) Root mean square deviations (RMSD) change of simulation systems; (b) Radius of gyration (Rg) change of simulation systems; (c) Solvent-accessible surface area (SASA) change of simulation systems; (d) Electrostatic interaction (ΔEele) of simulation systems.
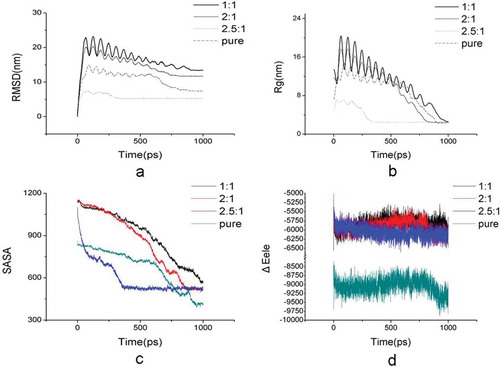
The Rg is known to be defined as the mass-weighted root mean square distance of collection of molecules from their common center of mass, which is calculated to analyze the compactness of the honey crystal conformation after simulation, thus providing an insight into the overall dimensions of the crystal formed. The Rg plot of sugar molecules of the crystal versus time at 300 K is shown in . The major fluctuation was observed among all the simulation models between a time period of 0 and 1000 ps (). In , simulation model with glucose/fructose ratio at 2.5:1 reached minimum Rg value at earlier simulation time than other simulation models, which indicated highest tendency to crystallization. The pure glucose simulation showed lowest Rg value at the end of simulation, which indicated more compactness of glucose crystal. These results indicated that the crystallization process of honey is differ from that of pure glucose, as well as further supported our hypothesis that glucose has relatively notable contribution for the stability of honey crystal. SASA is defined as bimolecular surface area that is accessible to solvent molecules, which is employed to assess the relative expansion of crystal structure. The change of SASA of all simulation models with time is shown in . The pure glucose crystal (model d) has the lowest SASA value among all four models (), followed by crystal with glucose/fructose ratio at 2.5:1 (model c), 2:1 (model b), and 1:1 (model a) in honey, which was agreement with the Rg results. Hence, we can say that relatively higher glucose concentration will facilitate in forming stable crystals in honey.
Conclusion
As far as we know, this was the first report to study honey crystallization by MD simulation at an in-depth molecular level. Our study found that the glucose/fructose ratios among liquid, crystal, and mixed forms of honey were different. The MD simulation further revealed that the crystallization of honey was different from that pure glucose in terms of morphology and conformational stability. At a 2.5:1, the glucose/fructose ratio formed crystals in a significantly shorter amount of time than that of other simulation models, and was the most stable honey crystallization, which probably means that ratio 2.5:1 is a critical ratio of honey crystallization.
Funding
This study was supported by the National Natural Science Foundation of China (31460427; 31560464), and Jiangxi Provincial Natural Science Foundation of China (20132BAB204001), and the Research Program of State Key Laboratory of Food Science and Technology (SKLF-ZZA-201610), China Postdoctoral Science Foundation funded project (Grant No.2014T70618)
Additional information
Funding
References
- Lazarević, K.B.; Andrić, F.; Trifković, J.; Tešić, Ž.; Milojković-Opsenica, D. Characterisation of Serbian Unifloral Honeys According to Their Physicochemical Parameters. Food Chemistry 2012, 132, 2060–2064.
- Escuredo, O.; Míguez, M.; Fernández-González, M.; Carmen, S.M. Nutritional Value and Antioxidant Activity of Honeys Produced in a European Atlantic Area. Food Chemistry 2013, 138, 851–856.
- Arvanitoyannis, I.; Krystallis, A. An Empirical Examination of the Determinants of Honey Consumption in Romania. International Journal of Food Science and Technology 2006, 41, 1164–1176.
- Escuredo, O.; González-Martín, M.I.; Rodríguez-Flores, M.S.; Seijo, M.C. Near Infrared Spectroscopy Applied to the Rapid Prediction of the Floral Origin and Mineral Content of Honeys. Food Chemistry 2015, 170, 47–54.
- Spiros, D.L.; Dionisios, N.H.; Sotirios, A.R. Honey May Have a Laxative Effect on Normal Subjects Because of Incomplete Fructose. American Society for Clinical Nutrition 1995, 62, 1212–1215.
- Cecilia, E.L. DSC Study of Honey Granulation Stored at Various Temperatures. Food Research International 1997, 30, 683–688.
- Zhang, L.J.; Zeng, Z.J.; Zheng, Y.L.; Wu, X.B. Composition Analysis of Honey from Cinnamomum Obtusifolium (Roxb.) Flowers Grown in Jiangxi. Food Science 2012, 10, 195–199.
- Saxena, S.; Gautam, S.; Sharma, A. Physical Biochemical and Antioxidant Properties of Some Indian Honeys. Food Chemistry 2010, 118, 391–397.
- Venir, E.; Spaziani, M.; Maltini, E. Crystallization in “Tarassaco” Italian Honey Studied by DSC. Food Chemistry 2010, 122, 410–415.
- Escuredo, O.; Dobre, I.; Fernández-González, M.; Seijo, M.C. Contribution of Botanical Origin and Sugar Composition of Honeys on the Crystallization Phenomenon. Food Chemistry 2014, 149, 84–90.
- Zhang, J.Z. Honey Crystal. Apiculture of China (in Chinese) 2013, 64, 52–53.
- Young, F.E. D-Glucose-Water Phase Diagram. Journal of Physical Chemistry 1957, 61, 616–619.
- Zhao, Y.Z.; Tian, W.L.; Guo, Z.B.; Peng, W.J. The Influence Factors and Evaluation Standard of Honey Crystallization. Agricultural Science and Technology of China (in Chinese) 2010, 3, 50–55.
- Dobre, I.; Georgescu, L.A.; Alexe, P.; Escuredo, O.; Seijo, M.C. Rheological Behavior of Different Honey Types from Romania. Food Research International 2012, 49, 126–132.
- Chen, Y.; Yang, X.Z.; Xu, X.; Xu, M. Single Chain Polyethylene Crystallization by Molecular Dynamics. Computers and Applied Chemistry 1999, 16, 81–88.
- Okada, I.; Namiki, Y.; Uchida, H.; Aizawa, M.; Itatani K. MD Simulation of Crystal Growth of NaCl from Its Supersaturated Aqueous Solution. Journal of Molecular Liquids 2005, 118, 131–139.
- Lee, B.M.; Baik, H.K.; Seong, B.S.; Munetoh, S.; Motooka, T. Molecular-Dynamics Analysis of the Nucleation and Crystallization Process of Si. Physica B: Condensed Matter 2007, 392, 266–271.
- Yaoqi, T.; Yin, L.; Frank, A. Manthey. Influence of β-Cyclodextrin on the Short-Term Retrogradation of Rice Starch. Food Chemistry 2009, 116, 54–58.
- Kamal, M.A.; Klein, P. Determination of Sugars in Honey by Liquid Chromatography. Saudi Journal of Biological Sciences 2011, 18, 17–21.
- Li, J.C.; Ding, T.H. High-Performance Liquid Chromatography (HPLC) Analysis of Sugar in the Honey. Journal of Analytical 1995, 14(05), 62–65.
- Ouchemoukh, S.; Schweitzer, P.; Bachir, B.M.; Djoudad-Kadji, H.; Louaileche, H. HPLC Sugar Profiles of Algerian Honeys. Food Chemistry 2010, 121, 561–568.
- Tornuk, F.; Karaman, S.; Ozturk, I.; Toker, O.S.; Tastemur, B.; Sagdic, O.; Dogan, M.; Kayacier, A. Quality Characterization of Artisanal and Retail Turkish Blossom Honeys: Determination of Physicochemical, Microbiological, Bioactive Properties and Aroma Profile. Industrial Crops and Products 2013, 46, 124–131.
- Tang, Y.; Zhang, F.; Cao, Z.; Jing, W.; Chen, Y. Crystallization of CaCO3 in the Presence of Sulfate and Additives: Experimental and Molecular Dynamics Simulation Studies. Journal of Colloid and Interface Science 2012, 377, 430–437.
- Gholami, S.; Bordbar, A. Exploring Binding Properties of Naringenin with Bovine β-Lactoglobulin: A Fluorescence, Molecular Docking and Molecular Dynamics Simulation Study. Biophysical Chemistry 2014, 187, 33–42.
- Jiao, A.; Zhou, X.; Xu, X.; Jin, Z. Molecular Dynamics Simulations of Cyclodextrin–Cumene Hydroperoxide Complexes in Water. Computational and Theoretical Chemistry 2013, 1013, 1–6.
- Tosi, E.A.; Ré, E.; Lucero, H.; Bulacio, L. Effect of Honey High-Temperature Short-Time Heating on Parameters Related to Quality, Crystallisation Phenomena and Fungal Inhibition. Lebensmittel Wissenschaft und Technologie 2004, 37, 669–678.
- Juan-Borrás, M.; Domenech, E.; Hellebrandova, M.; Escriche, I. Effect of Country Origin on Physicochemical, Sugar and Volatile Composition of Acacia, Sunflower and Tilia Honeys. Food Research International 2014, 60, 86–94.