
ABSTRACT
A procedure for in situ analysis of rice cooking was developed in this study. Grain softening during soaking and cooking of selected rice varieties (fresh and aged TDK8, TDK11, and Doongara) were subjected to in situ analysis by using a thermally controlled sample block (thermal mechanical compression test) attached to a texture analyzer. This technique measures the changes in the mechanical properties of intact rice grain during cooking continuously. The results obtained from the thermal mechanical compression test technique were validated against two standard and conventional procedures viz; analyzing the pasting properties of rice flours by rapid visco analyzer and microscopic observations during the cooking of rice grains. The technique developed in this study was found valid for in situ analysis of rice cooking. This technique can be used for a sample size as small as 0.50 g.
Introduction
Rice is one of the most popular staple cereals consumed around the globe. There are diverse varieties of rice and their aromatic and textural properties can be very distinct. Consumer preferences for cooked rice vary from region to region, Laotian people like sticky glutinous rice as staple and the Japanese like it on special occasions,[Citation1,Citation2] while Italians consume short grain varieties Baldo and Arborio rices with high amylopectin-content, which release starch during cooking making a creamy and smooth risotto.[Citation3] Therefore, it is very difficult to find out a standard procedure for rice cooking. For example traditionally, cooked waxy glutinous rice is produced by soaking overnight prior to steaming the rice. Prolonged soaking is required to soften the grains and increase the water content to accelerate the starch gelatinization in order to reduce the steaming (cooking) time. In some population freshly harvested rice grain is preferred while other population may prefer the aged rice due to the difference in the texture of the cooked rice with ageing.[Citation4]
Many studies have reported the effect of various cooking conditions such as temperature and pressure,[Citation5,Citation6] water-to-rice ratio,[Citation7] steam cooking, and stir-frying[Citation8] on the texture of cooked rice. A significant number of researches describing rate and effect of water infusion into non-glutinous rice grains on their cooking quality have been carried out in the past.[Citation6,Citation9–Citation12] The cooking quality of these rice is analyzed after the final cooking. This is mainly done by measuring the hardness of the cooked rice using a texture analyzer.[Citation13] Similarly, although the information about glutinous rice hydration and cooking are very limited, its soaking and softening properties are characterized by some researchers.[Citation14–Citation16] Moreover, considerable research has been conducted to find out the mechanism of water movement and final cooking qualities of cereal grains to develop kinetics model.[Citation17]
Major changes in the physical and chemical properties of starch are initiated by gelatinization. Therefore, it is important to get information on the evolution of cooking of rice during the cooking period. Rapid visco analyzer (RVA) analysis of the rice has been reported to interpret the pasting properties to cooking qualities of rice.[Citation18] However, during RVA analysis the grain needs to be ground to flour. The rate of moisture diffusion and gelatinization of starch during cooking can be different between flour and whole rice kernel. The cooking behavior and grain characteristic changes with time have also been analyzed by microscopic observation such as presence of ungelatinized white belly at the interior of the cereal grains undergoing cooking.[Citation19,Citation20] This analysis requires periodical sampling, slicing and microscopic observation during the cooking. The disappearance of white belly is the indication of cooking time requirement. The cooking quality of the rice is analyzed by determining the texture (mainly hardness) of the cooked grain by the texture analyzer. There are no methods which analyze the rate of cooking and texture of the whole grain rice as a one-step analysis.
In this study, a new in situ method is introduced to study the textural properties of rice using the thermal mechanical compression test (TMCT) device attached to a texture analyzer. The TMCT has been used previously for analyzing the stickiness and glass-rubber transition temperature of various food materials,[Citation21] including spray-dried orange juice powder, milk powders, spaghetti, and rice.[Citation22–Citation25] This method is based on the measurement of the displacement of a probe compressing the rice grain under a constant force while cooking in a temperature controlled TMCT device. During hydration and gelatinization, the softening of the grain will cause probe movement to maintain a set constant force. This study aims at the establishment of a standard procedure for in situ cooking analysis by using TMCT. This novel method will also allow development of kinetic models of cooking and also determine the final cooking time of different rice varieties.
Materials and methods
Two Oryza sativa Indica cultivars of glutinous rice from Lao PDR viz; TDK8 and TDK11 having 3.77 and 3.72% apparent amylose contents (AACs), respectively, and one O. sativa Japonica non-glutinous rice from Australia (Doongara, 19.71% [AAC]) were used in this study. The milled TDK8 was provided by National Agriculture and Forestry Research Institute (NAFRI), Lao PDR, while TDK11 and Doongara were provided by Rice Research Australia Pty Ltd (RRAPL), Mackay, Qld, Australia.
Moisture content of rice grains
The moisture content of rice grain was measured according to the AACC International Method 44-40.01[Citation26] by using modified vacuum-oven method. Two grams of a well-mixed sample was accurately weighed in a covered dish, which was previously dried at 98–100°C and, cooled in a desiccator to room temperature. The samples were heated at 98–100°C to a constant weight (for about 5 h) in partial vacuum having pressure equivalent to 25 mm Hg or less. The dried dishes with sample were cooled in desiccator, and weighed soon after it reached room temperature.
Moisture uptake by rice grains
Rice grains (10 ± 2 g, known initial moisture contents) were taken in a sieve (a tea filter). The sieve with sample was fully immersed in water maintained at 22 ± 1, 40 ± 1, and 50 ± 1°C. After every 5 min of soaking, the sample was taken out from sieve and wiped carefully with blotting paper to remove the surface moisture. The sample was weighed carefully and weight gained by the sample was recorded. The sample was again soaked in water for 5 min. The weight gained by the sample for 45 min was recorded.
Measurement of grain softening during hydration and cooking by TMCT device
The TMCT device used in this work is shown in . This device is made-up of temperature controlled aluminium block (50 × 50 × 25 mm) and attached to a texture analyzer. A single layer of 1 g of rice kernels was soaked in 1 mL of deionized water in a thermally controlled (TMCT) aluminium block. The soaked samples were compressed by a 35 mm Teflon probe at steady force of 0.10 and 0.15 N. The hydration and gelatinization of the starch will cause the softening of the grain resulting into the displacement of the probe to maintain the constant force. At a compression force of 0.10 N, the force was unstable so the probe displacement was distorted (). In the preliminary experiment a load of 0.15 N was found appropriate as the compression of the sample was low (10% of the grain height at the highest hydration level) and the probe movement signal was found stable (). Thus, the sample deformation at 0.15 N during the measurement was not high. The change in distance of probe during soaking was recorded by the texture analyzer TA-XTplus (Stable Microsystems, UK) for 1.5 h.
Figure 1. Illustration of grain softening during soaking and cooking, A: Overall experiment assembly; and B: Pictorial representation of measurement process.
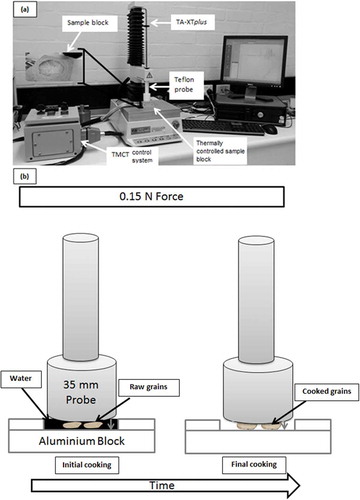
Figure 2. Probe displacement during in situ soaking of rice in a TMCT device at two compression forces, A: 0.10 N; and B: 0.15 N.
Similar experiment was conducted during cooking of rice. The sample block was heated to a rice cooking temperature of 95 ± 1°C and held it at this temperature. In the preliminary trials various rice to water ratios, such as 1:2 and 1:3, were used to streamline the in situ TMCT cooking process. It was observed that 1:2 rice-to-water ratio was not stable and probe distortion was started within the initial 14 min due to evaporation of water from sample container. However, it was found that 1:3 provided stable results () with the compression of the sample less than 20%. The amount of water required to cook the rice is higher due to loss of water from the annulus space between the probe and the sample block, although the gap was very small (<1 mm). Therefore, a single layer of 0.5 g of rice kernels and 1.5 mL of deionized water (rice:water ratio = 1:3) was put on the sample block. The change in distance of probe was recorded by the texture analyzer until rice sample has taken up all available water and fully cooked (indicated by the vibration in probe due to the evaporation of water from the cooked grain). The cooking rate of the grains was estimated by measuring the slope of the initial linear part of the in situ TMCT cooking curves.
Figure 3. The in situ TMCT cooking of rice at 95 ± 1°C with two different rice to water ratios (1:2 and 1:3).
Pasting properties
Pasting properties of rice flour (particle size ~ 750 µm) were determined according to the AACC International Method 61-02.01[Citation27] using a rapid visco analyzer (RVA-3D model Thermocline Windows Control and analysis software, Version 1.2 (New Port Scientific, Sydney, Australia). Rice flour (3.01 g, 12.4% moisture basis) was mixed with 25.0 g MilliQ water in the RVA canister. A programmed heating and cooling cycle was used, the samples were held at 50°C for 1 min, heated to 95°C in 3.45 min, held at 95°C for 2.7 min before cooling to 50°C in 3.91 min and holding at 50°C for 1.24 min. The peak time (PT), peak temperature (Ptemp), and peak viscosity (Vp) were recorded.
Light microscopy of rice kernels during cooking
Recorded time required for cooking in the grain softening experiment was cross-verified by light microscopy using a Zeiss Axio microscope (Oberkochen, Germany). Five grams of the rice sample was added in 15 mL of deionized water (rice:water ratio = 1:3) in a 50 mL glass beaker. The beaker was placed in water bath at 95 ± 1°C. After every 5 min, about 0.5 g of the sample was taken out. Cross-sections of rice kernel were studied under light microscope to see the extent of gelatinization by observing the non-gelatinized white belly. Cooking was continued until there was no white belly observed in rice kernel cross-section.
Statistical analysis
The reported data was analyzed by analysis of variance using Minitab R17 (Minitab® for Windows Release 17, Minitab Inc., Chicago) in order to determine significant differences. The data was then analyzed using Tukey’s pair-wise comparison of different treatments, at 5% level of significance.
Results and discussion
Comparison of grain softening and moisture uptake during hydration
The grain softening and moisture uptake curves of fresh TDK8 soaked at various temperatures (22 ± 1, 40 ± 1, and 50 ± 1°C) are shown in and , respectively. As expected, the uptake of moisture caused the softening of the grain which was measured by the displacement of the compression probe in the TMCT device attached to a texture analyser (). Results revealed that grains absorbed moisture quickly and became softer with increase in soaking temperature. The rate of water absorption and grain softening was higher in the initial 20 min of soaking. The probe displacement due to grain softening and moisture uptake results corresponded very well (). The results showed that most of the water was taken up in 45 min and showed slow rate of moisture adsorption and also probe displacement beyond this time () might be due to moisture distribution change within a grain. A similar experiment was undertaken for the aged (6 months) of the same variety (TDK 8) and other varieties of rice. The results also showed the similar trend for aged () and other rice varieties; Doongara and TDK11 ( and , respectively). The rate of infusion of water into the kernels was increased by increasing the soaking temperature resulting in faster softening of grains. The higher water diffusivity at higher soaking temperature is well understood,[Citation11,Citation28] and this can also be reflected by the softening of the grain using in situ measurement by TMCT device. Just to note that the variability of the results was evident in both methods, therefore, the statistical significance (p < 0.05) only existed between 22 and 50°C temperature of rehydration. But the average trend of probe displacement or moisture adsorption as a function of temperature and time was very consistent at all three hydration temperatures. The large error seen in the results are probably originated by the loss of solids during rehydration and variation during blotting the moisture before weighing. This type of variability has been reported in the previous studies with rice.[Citation17] It should also be noted that the water adsorption rate by aged samples was more affected by temperature of rehydration than the fresh sample. Slow rate of water adsorption by aged rice is well-known.[Citation29]
Figure 4. Comparison of A: grain softening measured as probe displacement by using TMCT; and B: moisture uptake during hydration of fresh TDK8 at different soaking temperatures (22, 40, and 50°C).
Figure 5. Comparison of A: grain softening measured by the displacement of probe by using TMCT; and B: moisture uptake during hydration of aged TDK8 at different soaking temperatures (22, 40, and 50°C).
Figure 6. Grain softening measured by probe displacement using TMCT for A: Doongara; and B: TDK11 rice varieties during hydration at different soaking temperatures (22, 40, and 50°C).
The in situ TMCT analysis of cooking properties
The cooking curves of various rice varieties (fresh and aged TDK8, TDK11, and Doongara) are shown in . Results revealed that the fresh and aged TDK8, TDK11, and Doongara grains took 31.5, 53.8, 26.2, and 19.8 min, respectively, to absorb all added moisture and completely gelatinize (cooked). It was observed that the rice grains were fully gelatinized and the later part of probe displacement () curve was distorted possibly due to evaporation of moisture from cooked grains as no free water was visible on the sample holder aluminium block when this distortion was observed. In aged rice, the rate of water uptake and gelatinization were slower than the fresh grains possibly due to age-induced physicochemical changes. Therefore, the probe displaced at much slower rate after 40 min and distortion started at 53.8 min. This assumption was validated by using excess water (rice:water ratio = 1:10) by cooking 0.5 g of grains in 5 mL of deionized water. Grains were covered with water even after the gelatinization was complete. Indication of completion was done during preliminary trials; samples were taken out of sample block at different time intervals to check the ungelatinized white belly. It was observed that when the samples were completely gelatinized and there was no free water available, “probe distortion” started. So the start of probe distortion was the cooking time of respective samples. No probe distortion was observed in excess water as depicted in .
Figure 7. The in situ TMCT cooking curves for various rice varieties (Fresh TDK8, Doongara, TDK11 and aged TDK8) cooked at 95 ± 1°C using rice to water ratios of 1:3. Black arrows and numbers correspond to cooking time.
Figure 8. The in situ TMCT cooking of rice at 95 ± 1°C with two different rice to water ratios (1:10 and 1:3).
Estimation of rate of cooking by using the in situ TMCT cooking method
The cooking proceeds from outside the grain to the center. This process is time dependent. In general, the initial 20 min of in situ TMCT cooking curves were linear in all rice samples used in the study. Therefore, only initial cooking curves were used to establish the rate of cooking. The rate of cooking will thus signify the rate of softening of the grain. In general, it was observed that higher the cooking rate lower would be the cooking time except for TDK11 ().
Table 1. The rate of cooking indicated by the rate of probe displacement during in situ cooking of selected rice varieties (fresh and aged TDK8, TDK11, and Doongara). Higher rate signifies faster cooking rate.
Pasting properties
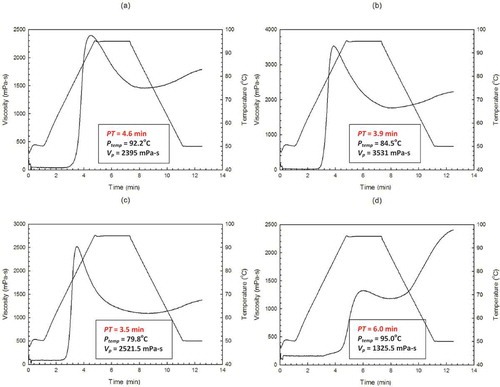
The peak time (PT) estimated by RVA can indicate the cooking characteristics of rice.[Citation30,Citation31] The RVA viscographs of all rice varieties (fresh and aged TDK8, TDK11, and Doongara) are shown in –, respectively. The time required by rice flours to reach the peak viscosity (Vp) is known as peak time (PT). It is the indication of complete gelatinization of starch. Results showed that the fresh and aged TDK8 rice flours took 4.6 and 3.9 min to reach Vp ( and ), while TDK11 and Doongara took 3.5 and 6.0 min, respectively ( and ). The PTs of all rice flours used in this study were significantly (p < 0.05) less than the cooking time estimated by the in situ TMCT cooking method. The grains are ground to millimeter size prior to RVA analysis. The reduction in particle size enhances the gelatinization due to increased heat and mass transfer rate.[Citation32] Therefore, PT of ground rice flour is not the same as cooking time of whole grains.
Figure 9. The RVA viscographs of various rice varieties, A: Fresh TDK8; B: Aged TDK8; C: TDK11; and D: Doongara.
Estimation of cooking time by using light microscopy
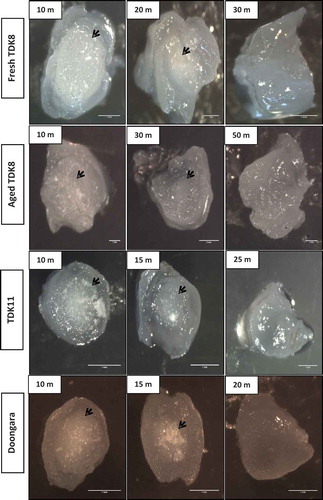
The extent of gelatinization of starch while cooking of fresh and aged TDK8, TDK11, and Doongara rice samples was observed over the time by using light microscopy. The non-gelatinized starch was observed by the presence of white belly in the cooking grain (). Fresh TDK8 took 30 min at 95 ± 1°C of cooking temperature to completely gelatinize the starch to the core of the kernel. Moreover, aged TDK8, TDK11, and Doongara took 50, 25, and 20 min, respectively, to be completely cooked. This method gives actual cooking time,[Citation33] but it is tedious to draw the sample periodically and does not provide the quantitative value.
Figure 10. The light microscopy of fresh and aged TDK8, TDK11, and Doongara rice kernels during cooking at 95 ± 1°C (The non-gelatinized white belly areas are indicated by black arrows).
Comparison of in situ TMCT cooking, RVA, and light microscopy
It was interesting to note that the in situ TMCT cooking has a possible correspondence to peak viscosity (Vp) of RVA findings. The in situ TMCT cooking time decreased with decreasing Vp in all rice varieties used except TDK11. Such as Vp of aged TDK8 is significantly (p < 0.05) higher than fresh TDK8 ( and ). Similar trend was found in in situ TMCT analysis. The cooking time of aged grains was significantly (p < 0.05) higher than fresh grains (). Doongara had the lowest in situ TMCT cooking time and Vp among all the rice varieties used in the study. Therefore, the RVA results indicated the swelling and integrity of swollen particles, but did not indicate the actual cooking time due to the limitation of flour usage instead of whole grains. The findings of in situ TMCT cooking analysis correlated well with microscopic observation. The in situ TMCT cooking analysis was well-correlated with the conventional microscopic analysis of cooking process with the minor variation of 4 to 7% in all selected rice samples. The in situ TMCT results showed that aged TDK8 gelatinized at a very slow rate after 30 min (). A similar trend was observed in the microscopic observation; around 70% area of the kernel was gelatinized in first 30 min while the remaining 30% took 20 min (). Microscopic observations were found to be very tedious, time consuming, requiring a large sample size (at least 3 to 5 g), and providing only subjective observations. The in situ TMCT cooking is very feasible and easy method and provides detailed information about the rate of water absorption during soaking and gelatinization or cooking. This technique can be used for sample size as small as 0.50 g. The only limitation in this method is the large standard deviation possibly due to the variation in multiple kernel dimensions of the sample taken for the analysis. Further work will be undertaken to relate the in situ TMCT cooking data with the sensory properties of the rice.
Conclusion
Knowledge of water uptake and cooking behavior of rice is key indicator in predicting the quality of rice. In the present study, three different cooking methods (in situ TMCT cooking, RVA, and light microscopy) were used to analyze the cooking behavior of selected rice (fresh and aged TDK8, TDK11, and Doongara) varieties. Results showed that the new in situ TMCT cooking method can provide information on the softening of the grain due to water uptake during soaking at various rehydration temperatures. Rate of cooking can also be calculated from slope of in situ TMCT cooking curve. This work represents the starting point of a new and rapid approach for evaluating rice-cooking behavior. The current work focused on representative glutinous and non-glutinous rice varieties and the set-up of the test conditions. A wide range of rice verities showing different cooking behavior needs to be further tested to validate the method. This provides a new opportunity of analysis of rice cooking quality.
Acknowledgment
The authors would like to thank Dr. Jaquie Mitchell (Research Fellow, the University of Queensland), Andrew Barfield, Russell Ford (Research Manager, Sunrice, RRAPL), Peter Snell (NSW DPI), and NAFRI (Lao PDR) for providing the paddy and milled rice samples for this research.
Funding
The authors would like to thank Australian Centre for International Agricultural Research (ACIAR) for providing financial support to undertake this research,
Additional information
Funding
References
- Mohapatra, D.; Bal, S. Cooking Quality and Instrumental Textural Attributes of Cooked Rice for Different Milling Fractions. Journal of Food Engineering 2006, 73, 253–259.
- Boualaphanh, C.; Calingacion, M.; Cuevas, R.P.; Jothityangkoon, D.; Sanitchon, J.; Fitzerald, M. Yield and Quality of Traditional and Improved Lao Varieties of Rice. ScienceAsia 2011, 37, 89–97.
- Puri, S.; Dhillon, B.; Sodhi, N.S. Effect of Degree of Milling (DOM) on Overall Quality of Rice: A Review. International Journal of Advanced Biotechnology and Research 2013, 5, 474–489.
- Tananuwong, K.; Malila, Y. Changes in Physicochemical Properties of Organic Hulled Rice During Storage Under Different Conditions. Food Chemistry 2011, 125, 179–185.
- Leelayuthsoontorn, P.; Thipayarat, A. Textural and Morphological Changes of Jasmine Rice Under Various Elevated Cooking Conditions. Food Chemistry 2006, 96(4), 606–613.
- Tian, Y.; Zhao, J.; Xie, Z.; Wang, J.; Xu, X.; Jin, Z. Effect of Different Pressure-Soaking Treatments on Color, Texture, Morphology and Retrogradation Properties of Cooked Rice. LWT–Food Science and Technology 2014, 55(1), 368–373.
- Srisawas, W.; Jindal, V.K. Sensory Evaluation of Cooked Rice in Relation to Water-to-Rice Ratio and Physicochemical Properties. Journal of Textural Studies 2007, 38, 21–41.
- Reed, M.O.; Ai, Y.; Leutcher, J.L.; Jane, J. Effects of Cooking Methods and Starch Structures on Hydrolysis Rates of Rice. Journal of Food Science 2013, 78(7), 1076–1081.
- Bakshi, A.S.; Singh, R.P. Kinetics of Water Diffusion and Starch Gelatinization During Rice Parboiling. Journal of Food Science 1980, 45, 1387–1392.
- Hendricks, M.; Engels, C.; Tobback, P. Three-Dimensional TLM Models for Water Diffusion in White Rice. Journal of Food Engineering 1987, 6, 187–197.
- Miah, M.A.K.; Haque, A.; Douglass, M.P.; Clarke, B. Parboiling of Rice. Part I: Effect of Hot Soaking Time on Quality of Milled Rice. International Journal of Food Science and Technology 2002, 37(5), 527–537.
- Rafiq, A.; Chowdhary, J.; Hazarika, M.K.; Makroo, H.A. Temperature Dependence on Hydration Kinetics Model Parameters During Rehydration of Parboiled Rice. Journal of Food Science and Technology 2015, 52(9), 6090–6094.
- Bello, M.; Baeza, R.; Tolaba, M.P. Quality Characteristics of Milled and Cooked Rice Affected by Hydrothermal Treatment. Journal of Food Engineering 2006, 72(2), 124–133.
- Singh, V.; Okadome, H.; Toyoshima, H.; Isobe, S.; Ohtsubo, K. Thermal and Physicochemical Properties of Rice Grain, Flour and Starch. Journal of Agriculture and Food Chemistry 2000, 48(7), 2639–2647.
- Ahromrit, A.; Ledward, D.A.; Niranjan, K. High Pressure Induced Water Uptake Characteristics of Thai Glutinous Rice. Journal of Food Engineering 2006, 72(3), 225–233.
- Peerapattana, J.; Phuvarit, P.; Srijesdaruk, V.; Preechagoon, D.; Tattawasart, A. Pregelatinized Glutinous Rice Starch as a Sustained Release Agent for Tablet Preparations. Carbohydrate Polymers 2010, 80(2), 453–459.
- Bello, M.; Tolaba, M.P.; Aguerre, R.J.; Suarez, C. Modeling Water Uptake in a Cereal Grain During Soaking. Journal of Food Engineering 2010, 97, 95–100.
- Nawaz, M.A.; Fukai, S.; Bhandari, B. Effect of Different Cooking Conditions on the Pasting Properties of Flours of Glutinous Rice Varieties from Lao PDR. International Journal of Food Properties 2016, 19, 2026–2040.
- Lund, D.; Lorenz, K.J. Influence of Time, Temperature, Moisture, Ingredients, and Processing Conditions on Starch Gelatinization. CRC Critical Reviews in Food Science and Nutrition 1984, 20(4), 249–273.
- Srikaeo, K.; Furst, J.E.; Ashton, J.F.; Hosken, R.W. Microstructural Changes of Starch in Cooked Wheat Grains as Affected by Cooking Temperatures and Times. LWT–Food Science and Technology 2006, 39(5), 528–533.
- Liu, Y.; Intipunya, P.; Truong, T.T.; Zhou, W.; Bhandari, B. Development of a Noval Phase Transition Measurement Device for Solid Food Materials: Thermal Mechanical Compression Test (TMCT). In: Water Properties in Food, Health, Pharmaceutical and Biological Systems: ISOPOW 10; Reid, D.S.; Sajjaanantakul, T.; Lillford, P.J.; Charoenrein, S.; Eds.; Wiley-Blackwell: Maitland, Florida, USA, 2010; 429–436 pp.
- Shrestha, A.K.; Ua-arak, T.; Adhikari, B.P.; Howes, T.; Bhandari, B.R. Glass Transition Behaviour of Spray Dried Orange Juice Powder Measured by Differential Scanning Calorimetry (DSC) and Thermal Mechanical Compression Test (TMCT). International Journal of Food Properties 2007, 10(3), 661–673.
- Boonyai, P.; Howes, T.; Bhandari, B. Instrumentation and Testing of a Thermal Mechanical Compression Test for Glass-Rubber Transition Analysis of Food Powders. Journal of Food Engineering 2007, 78(4), 1333–1342.
- Rahman, M.S.; Senadeera, W.; Al-Alawi, A.; Truong, T.; Bhandari, B.; Al-Saidi, G. Thermal Transition Properties of Spaghetti Measured by Differential Scanning Calorimetry (DSC) and Thermal Mechanical Compression Test (TMCT). Food Bioprocess Technology 2011, 4, 1422–1431.
- Thuc, T.T.; Fukai, S.; Truong, V.; Bhandari, B. Measurement of Glass-Rubber Transition Temperature of Rice by Thermal Mechanical Compression Test (TMCT). International Journal of Food Properties 2010, 13, 176–183.
- AACC. American Association for Cereal Chemists. Moisture-Modified Vacuum-Oven Method, AACC International Method 44-40.01. AACC: USA, 1999.
- AACC. American Association for Cereal Chemists. Determination of the Pasting Properties of Rice with the Rapid Visco Analyser, AACC International Method 61-02.01. AACC: USA, 1999.
- Kashaninejad, M.; Dehghani, A.A.; Kashiri, M. Modeling of Wheat Soaking Using Two Artificial Neutral Networks (MLP and RBF). Journal of Food Engineering 2009, 91(4), 602–607.
- Butt, M.S.; Anjum, F.M.; Salim-ur-Rehman; Nadeem, M.T.; Sharif, M.K.; Anwer, M. Selected Quality Attributes of Fine Basmati Rice: Effect of Storage History and Varieties. International Journal of Food Properties 2008, 11, 698–711.
- Champagne, E.T.; Bett, K.L.; Vinyard, B.T.; McClung, A.M.; Barton II, F.E.; Moldenhauer, K.; McKenzie, K. Correlation Between Cooked Rice Texture and Rapid Visco Analyser Measurements. Cereal Chemistry 1999, 76(5), 764–771.
- Zambrano, A.D.; Bhandari, B.; Ho, B.; Prakash, S. Retrogradation-Digestibility Relationship of Selected Glutinous and Non-Glutinous Fresh and Stale Cooked Rice. International Journal of Food Properties 2016, 19, 2608–2622.
- Zhu, B.; Li, B.; Gao, Q.; Fan, J.; Gao, P.; Ma, M.; Feng, X. Predicting Texture of Cooked Blended Rice with Pasting Properties. International Journal of Food Properties 2013, 16, 485–499.
- Faruq, G.; Prodhan, Z.H.; Nezhadahmadi, A. Effects of Ageing on Selected Cooking Quality Parameters of Rice. International Journal of Food Properties 2015, 18, 922–933.
- Yu, X.; Yu, H.; Zhang, J.; Shao, S.; Zhou, L.; Xiong, F.; Wang, Z. Comparison of Endosperm Starch Granule Development and Physiological Properties of Starches from Waxy and Non-Waxy Wheat. International Journal of Food Properties 2015, 18, 2409–2421.