
ABSTRACT
In the present study, physicochemical, thermal, rheological, and morphological properties of flours from guar seed cultivars (G80, Ageta 112, and HG365) were assessed. Ageta 112 flours showed the highest protein content (26.78%) and varied significantly from G80 and HG365. The fiber, ash, and carbohydrate displayed significant differences in all three guar cultivars. Maximum gum content was extracted from G80 (41.19%), followed by HG365 and Ageta 112. Assessment of thermal properties revealed G80 flours with highest onset, peak, and endset temperature. Flours from cultivar Ageta 112 were recorded with highest paste temperature and peak viscosity and G80 flours showed lowest setback viscosities. Scanning electron microscopy was used to observe the morphological structure of different guar seed flour. Scanning electron micrographs presented the internal structure containing the galactomannans. Several significant correlations between physicochemical, gum yield, and thermal properties were revealed by Pearson correlation.
Introduction
Guar (Cyamopsis tetragonoloba) is an annual arid and semi-arid crop belonging to family leguminaceae and subfamily paplionaceae.[Citation1] Guar has recently gained significant importance due to its gum content. The crop is also known as “Black Gold” because of the supply and demand that has turned it into a cash crop and precious commodity.[Citation2] Guar is a multi-purpose legume crop since in addition to being an industrial crop; it is also cultivated as a vegetable for human consumption, particularly in India and Pakistan and also used for feed for livestock and as a green manure crop.[Citation3,Citation4] Guar seed (Cyamopsis tetragonoloba) is composed of hull (30–33%), germ (43–47%), and endosperm (27–30%).[Citation5] The hull and germ content together constitutes as guar meal that is rich in protein and fiber, and is utilized for the cattle feed.[Citation5,Citation6] The endosperm contributes to the commercial importance of the guar crop because of the presence of galactomannans.
The major production of guar is accounted to the fields of India, with nearly 80% of global guar production, followed by Pakistan (15%), Sudan, Australia, and the United States.[Citation7] Guar like other legume crops offers as an additional source of vegetable protein. The spherical-shaped endosperm contains significant amounts of galactomannan gum (19 to 43% of the whole seed), which forms a viscous gel in cold water and the germ and hull obtained after gum extraction are concentrated in protein content.[Citation1,Citation8] The milled guar used in form of flour has potential to be incorporated in different foods for enhancing the nutritional value and improving the product characteristics because of its galactomannans. Considering its high content of fiber, protein, galactomannans, it is important to study its various characteristics. There is a need to exploit the food (nutritional) potentials of guar bean seeds. However, this requires prior information and understanding of properties and behavior of the material in systems during processing, preparation, as well as consumption. The legume seed use of flour and protein concentrates have been on the increase because of greater knowledge of their functional properties, processing, and nutritive value. To date, the soy bean has had a competitive advantage over other legume seeds; however, there is a need to identify, develop, and explore other legume sources. The guar bean offers such an unexploited opportunity. Limited information on properties of guar seed has restricted its development and sustainable utilization.[Citation9] The objective of the present work was to study the physicochemical, morphological, and thermal properties of flours of guar. The studies would be beneficial for understanding the thermal and other characteristics of guar and its further utilization in food products.
Material and methods
Three guar seeds samples (G80, Ageta112, and HG365) were obtained from the fields of Punjab Agricultural University, Ludhiana, India. The mentioned varieties were undertaken in the present study to assess the locally grown varieties. The seeds were cleaned and freed from foreign particles and stored in sealed high-density polyethylene bags. The cleaned seeds were milled using hammer type Cemotech Mill (model-3303 Perten, Finland) followed by storage in airtight containers for further use.The flour particle size of milled seeds was enough to pass through sieve no. 72 (British sieve standards).
Proximate analysis
Guar seed flour samples were estimated for their moisture, ash, and protein (% N X 6.25) content as per AOAC (Association of Official Analytical Chemists) official procedures in triplicates. The fat and fiber contents were determined using Soxtech (model-2045 Foss) and Fibertech (model-2023 Foss). The conversion factor used for calculating the protein content was 6.25 (as per BIS IS:7219-1973). Total carbohydrate content was determined by the difference.
Color characteristics
Color measurements of flour samples were carried out in triplicate, using Hunterlab Colorimeter (model CM- 508d Minolta Co. Ltd., Japan) as described by Lamberts et al.[Citation10] The L* value indicates the lightness, 0–100 representing dark to light. The a* value gives the degree of the red–green color, with a higher positive a* value indicating more red. The b* value indicates the degree of the yellow–blue color, with a higher positive b* value indicating more yellow. The chroma values (C*) and Hue angle (hº) were calculated from the L*, a*, and b* values as suggested by Little.[Citation11]
Gum extraction
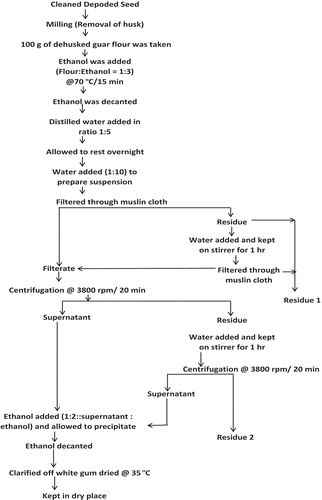
Extraction of polysaccharide from Cyamopsis tetragonoloba was performed according to Cerqueira et al.[Citation12] The flowsheet for extraction process has been given in . The flour was treated with ethanol (flour:ethanol 1:3) at 70°C for 15 min to inactivate enzymes and eliminate low molecular weight compounds. The ethanol was decanted followed by addition of water to endosperm (5:1), the slurry was allowed to rest overnight. Water was added (1:10) to prepare the suspension which passed through muslin cloth. The husk and fiber were obtained as residue to which again water was added. The slurry was kept on shaker for 1 h followed by filtration through muslin cloth. The residue was again treated and filtered as done before so as to separate maximum endosperm. The supernatants were collected and allowed to precipitate by adding ethanol (1:2) to it. Ethanol was decanted to obtain the clarified off-white gum. The off-white mass obtained was dried at 35ºC overnight.
Figure 1. Flowsheet for extraction of guar gum from guar seeds.
Thermal properties
Thermal characteristics of flours were analyzed using TGA/DSC (Thermal Gravimetric Analysis/ Differential Scanning Calorimetry) star-e system differential scanning calorimeter (Mettler Toledo, Switzerland). The DSC analyzer was calibrated using indium and an empty aluminum pan was used as reference. Sample was weighed (≈4 mg) and mixed with water (1:2, w/w) and kept at room temperature for 2 h to allow a uniform distribution of water in the samples. Sample pans were heated at the rate of 10°C/min from 20 to 100°C. Onset temperature (To), peak temperature (Tp), endset temperature (Te), enthalpy change (∆H) gelatinization temperature range (R), and peak height index (PHI) were recorded.
Pasting properties
The pasting properties of the guar flour samples were determined using the rapid visco analyser (RVA; Newport Scientific, Warriewood, Australia). Three grams of guar flours were weighed in the canister (14% moisture basis) to assess the paste temperature and viscosity profiles. The temperature–time variations followed were an equilibration at 50ºC for 1 min, a holding phase at 95ºC for 5 min, cooling down to 50ºC in 3 min, and finally holding at 50ºC for 2 min. Each sample was analyzed in triplicate.
Microscopic studies
Granule morphology of flour from different guar seed cultivars was examined using Hitachi scanning electron microscope (SEM; S-3400N). The samples were first dried in an oven at 40ºC for 5–6 h to reduce its moisture level. The oven dried samples were then carefully mounted on double-sided black carbon tape struck to the stubs, and then sputter coated with Au using a vacuum evaporator. The samples were then examined under a SEM using the secondary electron technique and photographic images were captured at different magnification levels.
Statistical analysis
The statistical procedures were performed using SPSS version 16.0 (Statistical Package for Social Sciences, SPSS Inc., Chicago, USA). One-way analysis of variance (ANOVA) was carried out and significant differences (p < 0.05) were determined by Tukey’s test.
Results and discussion
Proximate composition
The results pertaining to composition of guar seed flour of different cultivars is presented in . The protein content for all three varieties varied from 24.55 to 26.78% and was observed to be maximum in Ageta 112. The protein content as quoted by Ahmed et al.[Citation13] was much higher, i.e., 52.6% as compared to the cultivars undertaken in the present study; however, the results were close to the range as observed by Pathak et al.[Citation1] Protein content observed in guar seed flour was less than the soyabean (31.48%) and higher than in chickpea (14.63%) as reported by Joshi et al.[Citation14] There was no significant difference observed in the fat content that ranged between 2.7 to 3%. Similar results were obtained by Pathak et al. [Citation1] and Ahmed et al.[Citation13] Guar seeds were richer in protein and fat content than the common bean, i.e., P. Vulgaris,[Citation15] red kidney beans.[Citation16] The fiber content of G 80 was maximum (14.37%) followed by HG 365 and Ageta 112. The observed results were, however, higher than were obtained by Pathak et al.[Citation1] and Ahmed et al.[Citation13] in their respective studies. Ash content in Ageta 112 was found to be maximum, i.e., 5.29% followed by HG 365 and G 80. Carbohydrate content varied significantly and ranged from 53.7 to 54.7%. The variation in variety and agronomic conditions for growth of crops was possibly responsible for difference in composition of cultivars than the earlier reported data.
Table 1. Proximate composition of flours from different guar seed flour cultivars (dry basis).A,B
Color
The Hunter color parameters recorded for guar seed flours are shown in . The L* value was highest for Ageta 112 (79.26) followed by HG 365 and G 80 which signifies the higher and lower degree of lightness, respectively. Joshi et al.[Citation17] submitted the color analysis results with lightness value of soyabean flour and chickpea flour as 71.40 and 86.38%, respectively. The negative a* value of guar seed flour indicated the greenish color being maximum for Ageta 112 (–2.68) that varied significantly than other two varieties. The yellowness of guar seed flours presented in showed no significant difference among the three varieties and the range observed was 8.96 to 9.20. The chroma represents “richness of color” or color intensity and hue angle depicts how an average person will perceive that color.[Citation18] The chroma value for the three guar seed flours did not vary significantly, whereas the hue angle showed a narrow range of difference varying from 102.7 to 106.5.
Table 2. Hunter color values of flours from different chickpea cultivars.A,B
Guar seed gum extraction
The extraction yield of guar seed gum which is majorly constituted of galactomannans from the flours of three guar seed cultivars was conducted according to Cerqueira et al.[Citation12] using ethanol. The yield obtained from different cultivars of guar seed were 41.19, 37.32, and 31.19% for G 80, HG 365, and Ageta 112 respectively (). Rodge et al.[Citation19] isolated and partially purified the galactomannans from guar seed using 70% isopropnol with an extraction yield of 31.52%. Bourbon et al.[Citation20] extracted polysaccharides from G. triacanthos and S. Japonica on similar procedures using ethanol. Flaxseed gum was extracted from flaxseed hulls by Qian et al.[Citation21] by employing ethanol and centrifugation.
Table 3. Chemical composition and yield of guar seed gum.A,B
Crude gums extracted from guar seed flour that contained impurities as proteins, lipids, etc., were analyzed for its chemical composition for all three guar cultivars (). Protein content of gums obtained from Ageta 112 was 6.88% followed by G 80 and HG (5.66 and 5.21%, respectively). Lipid and ash content of extracted guar seed gum ranged from 0.20 to 0.30% and 0.40 to 0.44%, respectively. The guar seed gums extracted by Rodge et al.[Citation19] were quoted with 0.86% proteins, 0.15% of lipids, and 0.65% of ash from the gums extracted from guar seed. The carbohydrates observed from were above 92% and three cultivars showed no significant difference.
Table 4. Thermal properties of guar seed flour cultivars.A,B
Thermal properties
represents the gelatinization temperatures (onset [To], peak [Tp], and endset [Te], enthalpy of gelatinization [∆Hgel], PHI, and gelatinization range [Tc – To]) for flours from different guar seed flours. Significant differences (p < 0.05) were observed in To, Tp, and Te among various cultivars of guar seed flours. The differences in thermal profiles observed in beans can be associated with the differences in size, form, and distribution of starch granules in the flours, and to the internal arrangement of starch fractions within the granule.[Citation15,Citation22] G 80 showed highest To, Tp, and Te of 69.07, 75.70, and 81.38ºC, respectively, and lowest values for same were observed in Ageta 112, i.e., 66.36, 72.22, and 78.23ºC. Tp signifies the temperature at which 50% of the molecules have undergone thermal transition while enthalpy is associated with the energy necessary for a transition.[Citation15] Lower gelatinization temperature of G 80 concludes it to be more favourable for low calorie diets. The endset temperature showed no significant difference among the guar seed flour cultivars. The PHI is the ratio of ∆Hgel for gelatinization to the gelatinization temperature range and is a measure of uniformity in gelatinization.[Citation22,Citation23] PHI of guar seed flour differed significantly where Ageta 112 observed minimum value. The range of gelatinization varied from 11.87 to 12.31ºC and was observed maximum for G 80.
Pasting properties of guar flour cultivars
Pasting properties of flour are important in understanding of the processing and after processing behavior. The pasting properties of guar flours as depicted from the RVA are summarized in . Significant differences were observed in pasting characteristics of flours from different guar bean cultivars. Pasting temperature that provides an indication of the minimum temperature required to cook the flour was observed highest for Ageta 112 (86.3ºC) and HG 365 flours were observed with lowest (54.5ºC) cooking temperatures. The high pasting temperature of Ageta 112 flour can be attributed to presence of comparatively swell and rupture resistant starch. Peak viscosity of different guar flours varied from 763 to 2321 cp, the highest for Ageta 112 and lowest for G 80 flour. Hold viscosity was highest for Ageta 112 (2276 cp) followed by HG 365 and G 80, in the order. Final viscosity varied from 2423 to 5909 cp and was maximum in HG 365 flours, indicating the ability of the material to form a viscous paste. Breakdown values were highest for Ageta 112 which represents the ease with which the swollen granules can be disintegrated. Lowest breakdown was observed for G 80, signifying its paste stability. Setback viscosity represents the retrogradation tendency of cooked flour paste on cooling and the guar flours ranged from 1673 to 3738 cp. The lowest setback value of G 80 flour indicates its lower tendency to retrograde. The lesser tendencies to retrograde provide an advantage to food products, such as soups and sauces, which undergo loss of viscosity and precipitation on retrogradation.[Citation24] Kaur and Singh[Citation22] studied the pasting properties of cultivars of chickpea flour. The authors reported the pasting temperature in range of 73.1 to 75.2°C. Akinjayeju and Ajayi,[Citation25] reported a lower peak viscosity (247 cp), hold viscosity (214 cp) and higher (34 cp) for black bean flour than the mean viscosity parameters noted for guar flour. Field pea and pigeon pea was reported with lower peak viscosity (1393 and 1994 cp, respectively), lower final viscosity (1862 and 2347 cp, respectively), higher breakdown viscosity (194 and 224 cp, respectively)[Citation26] than the respective mean values for guar flour taken understudy.
Table 5. Pasting properties of guar flour cultivars.A,B
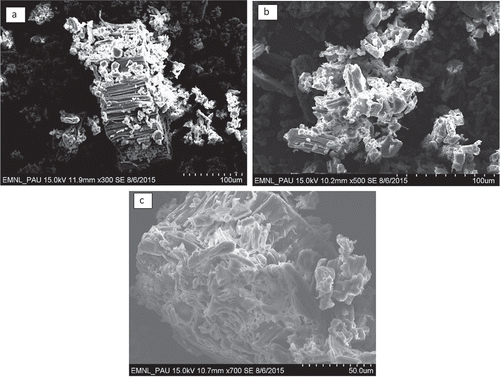
Microscopic analysis
shows the SEMs of all the three cultivars of guar fours. The images shows similar basic pattern of bundle of long shreds of endosperm along with the galactomannans. The ruptured surface of endosperm released more inclusions of galactomannans. The images presented by Brennan[Citation27] of guar seed and guar gum flour in the study were helpful in understanding the microscopic images of guar seed flour seen in our study under SEM. The inclusions of galactomannans are more scattered in guar seed flour as compared to guar seed as observed from the micrographs obtained in present study. This was possibly due to more rupturing of the starch granules in endosperm during milling of flour and exposure of inclusions of galactomannans. clearly exhibits the endosperm bundles in Ageta 112 () are similar; however, lesser organized than observed in flours of G 80 and HG 365 as seen in and , respectively. This might be related to the lower To and ∆Hgel of Ageta 112 as observed in . However, the SEM images of HG 365 flours () showed the galactomannans were comparatively more compactly attached to the endosperm structure as compared to other two cultivars.
Figure 2. Scanning electron micrographs of guar seed flour of different cultivars, 2a: G 80; 2b: Ageta 112; and 2c: HG 365 showing long shreds of epidermis and he scattered granules of galactomannan deposits originating from the inclusions in the endosperm cells.
Pearson’s correlation coefficients between composition, gum yield, and thermal properties
Pearson’s correlation coefficients between various properties of flours of guar bean seeds are presented in . Protein content had significant negative correlation with carbohydrates (r = –0.991, p ≤ 0.05) and gum yield (–0.925, p ≤ 0.05). In the present study, negative correlation of proteins with thermal properties was observed; however, Li et al.[Citation28] reported increase in onset (To) and peak (Tp) temperatures with increase in protein content. Fiber content displayed a positive correlation with carbohydrates (r = 0.75, p ≤ 0.05) and thermal properties. Wani et al.[Citation29] observed a non-significant correlation between fiber and carbohydrates in kidney beans. A significant negative correlation was observed with ash (r = –0.995, p ≤ 0.05); however, thermal properties, i.e., onset, peak, endset, and enthalpy, showed a positive correlation with fiber. Ash content showed a significant negative correlation with carbohydrates (r = –0.676, p ≤ 0.05), gum yield (r = –0.953, p ≤ 0.05), and thermal properties, whereas carbohydrates revealed a significant positive correlation for thermal properties. Gum yield showed a significant positive correlation with onset (r = 1, p ≤ 0.01), peak (r = 1, p ≤ 0.01), endset temperature (r = 0.996, p ≤ 0.01), enthalpy (r = 1, p ≤ 0.05), PHI (r = 0.961, p ≤ 0.01), and gelatinization range (r = 0.978, p ≤ 0.01). Positive correlation of onset temperature with peak temperature (r = 1.000, p ≤ 0.01), endset temperature (r = 1.000, p ≤ 0.01), enthalpy (r = 0.996, p ≤ 0.01), PHI (r = 0.943, p ≤ 0.01), and gelatinization range (r = 0.989, p ≤ 0.01). Kaur et al.[Citation26] observed similar positive correlation of onset and peak temperature (r = 1.000) and endset temperature (r = 0.997) in legume flour. In the present study, peak temperature showed a significant positive correlation with endset temperature (r = 1.000, p ≤ 0.05), enthalpy (r = 0.996, p ≤ 0.05), PHI (r = 1.000, p ≤ 0.05), and gelatinization temperature (r = 0.99, p ≤ 0.05). Endset temperature shows a significantly positive correlation of PHI (r = 0.936, p ≤ 0.05) and range (r = 0.992, p ≤ 0.05). Significant positive correlation of enthalpy was displayed with PHI (r = 0.968, p ≤ 0.05) and range (r = 0.973, p ≤ 0.05). PHI showed significant positive correlation with gelatinization range (r = 0.884, p ≤ 0.05) as shown by Pearson’s correlation coefficient.
Table 6. Pearson’s correlation coefficients between composition, gum yield and thermal properties.
Conclusion
The present studies on guar seed (Cyamopsis tetragonoloba) cultivars revealed that Ageta 112 contained higher protein and G 80 was higher in fiber and carbohydrate content. Flours from seeds of G80 cultivar exhibited maximum gum yield on extraction. Ageta 112 flour showed lowest To, Tp, Te, and ∆Hgel and gelatinization range. Highest peak viscosity was recorded for flours of Ageta 112 and G 80 flours presented the lowest setback viscosity. SEM images showed the inclusions of galactomannans in the endosperm of the seed and justified the thermal behavior of cultivars. Pearson’s coefficient correlation showed a significant correlation of physicochemical composition, gum yield, and thermal properties. The outcomes of present study reveal that among these local guar cultivars, G 80 was most suitable for gum extraction. Further work can be carried to study utilization of Ageta 112 in food products due to its good protein content. Crops like guar which are otherwise underutilized can be brought under the umbrella of food security due to its high protein and other constituents.
References
- Pathak, R.; Singh, M.; Henry, A. Genetic Diversity and Interrelationship Among Clusterbean (Cyamopsistetragonoloba) Genotypes for Qualitative Traits. Indian Journal Agricultural Sciences 2011, 81, 402–406.
- Iqbal, D.N.; Hussain, E.A. Physiochemical and Pharmaceutical Properties of Guar Gum Derivatives. Report and Opinion 2010, 2(10), 77–83.
- Chudzikowski, R.J. Guar Gum and Its Applications. Journal of the Society of Cosmetic Chemists 1971, 22, 43–60.
- Whistler, R.L.; Hymowitz, T. Guar: Agronomy, Production, Industrial Use and Nutrition. Purdue University Press: West Lafayette, IN, 1979.
- Murwan, S.K.; Abdalla, A.H.; Nouri, S.H. Quality Assessment of Guar Gum (Endosperm) of Guar (Cyamopsistetragonoloba). ISCA Journal of Biological Sciences 2012, 1(1), 67–70.
- Naik, C.S.R.; Ankaiah, R.; Sudhakar, P.; Reddy, T.D.; Radhakrisnamurthy, V.; Spandana, B. Variation in the Protein and Galactomannan Content in Guar Seeds of the Different Genotypes. Vegetable Science 2013, 40(1), 50–54.
- Yadav, H.; Shalendra. An Analysis of Guar Crop in India (2013–14) Report prepared by NIAM, Jaipur for United States Department of Agriculture (USDA), New Delhi, 2014.
- Sharma, P.; Gummagolmath, K.C. Reforming Guar Industry in India: Issues and Strategies. Agricultural Economics Research Review 2012, 25, 37–48.
- Kisambira, A.; Muyonga, J.H.; Byaruhanga, Y.B.; Tukamuhabwa, P.; Tumwegamire, S.; Grüneberg, W.J. Composition and Functional Properties of Yam Bean (Pachyrhizus spp.) Seed Flour. Food and Nutrition Sciences 2015, 6, 736–746. http://dx.doi.org/10.4236/fns.2015.68076
- Lamberts, L.; De Bie, E.; Derycke, V.; Veraverbeke, W.S.; De Man, W.; Delcour, J.A. Effect of Processing Conditions on Colour Change of Parboiled Rice. Journal of Agricultural and Food Chemistry 2006, 83, 80–85.
- Little, A.C. A Research Note Off on a Tangent. Journal of Food Science 1975, 40, 410–411. DOI:10.1111/j.1365-2621.1975.tb02213.x
- Cerqueira, A.; Pinheiro, A.C.; Souza, B.W.S.; Lima, A.M.P.; Ribeiro, C.; Miranda, C.; Teixeira, J.A.; Moreira, R.A.; Coimbra, M.A.; Gonçalves, M.P.; Vicente, A.A. Extraction, Purification and Characterization of Galactomannans from Non-Traditional Sources. Carbohydrate Polymers 2009, 75, 408–414.
- Ahmed, M.B.; Hamed, R.A.; Ali, M.E.; Hassan, A.B.; Babiker, E.E. Proximate Composition, Antinutritional Factors and Protein Fractions of Guar Gum Seeds as Influenced by Processing Treatments. Pakistan Journal Nutrition 2006, 5, 481–484.
- Joshi, U.N.; Arora, S.K.; Arora, R.N. Differential Chemical Composition of Guar Species. Guar Reseach Annals 1990, 6, 38–40.
- Sanchez-Arteaga, H.M.; Urias-Silvas, J.E.; Espinosa-Andrews, H.; Garcia-Marquez E. Effect of Chemical Composition and Thermal Properties on the Cooking Quality of Common Beans (Phaseolus Vulgaris), CyTA—Journal of Food 2015, 13(3), 385–391. DOI:10.1080/19476337.2014.988182
- Sai-Ut, S.; Ketnawa, S.; Chaiwut, P.; Rawdkuen, S. Biochemical and Functional Properties of Proteins from Red Kidney, Navy and Adzuki Beans. Asian Journal Food and Agro Industry 2009, 2(04), 493–504.
- Joshi, A.U.; Liu, C.; Sathe, S.K. Functional Properties of Select Seed Flours. LWT–Food Science and Technology 2015, 60(1), 325–331.
- Siddiq, M.; Ravi, R.; Harte, J.B.; Dolan, K.D. Physical and Functional Characteristics of Selected Dry Bean (Phaseolus Vulgaris L.) Flours. Food Science and Technology 2010, 43, 232–237.
- Rodge, A.B.; Sonkamble, S.M.; Salve, R.V.; Hashmi, S.I. Effect of Hydrocolloid (Guar Gum) Incorporation on the Quality Characteristics of Bread. Journal of Food Processing and Technology 2012, 3, 136–142. DOI:10.4172/2157-7110.1000136
- Bourbon, A.I.; Pinheiro, A.C.; Ribeiro, C.; Miranda, C.; Maia, J. M.; Teixeira, J.A.; Vicente, A.A. Characterization of Galactomannans Extracted from Seeds of Gleditsia Triacanthos and Sophora Japonica Through Shear and Extensional Rheology: Comparison with Guar Gum and Locust Bean Gum. Food Hydrocolloids 2010, 24, 184–192.
- Qian, K.Y.; Cui, S.W.; Wub, Y.; Goff, H.D. Flaxseed Gum from Flaxseed Hulls: Extraction, Fractionation, and Characterization. Food Hydrocolloids 2012, 28, 275–283.
- Kaur, M.; Singh, N. Studies on Functional, Thermal and Pasting Properties of Flours from Different Chickpea (Cicer Arietinum L.) Cultivars. Food Chemistry 2005, 91, 403–411.
- Sandhu, K.S.; Singh, N. Some Properties of Corn Starches II: Physicochemical, Gelatinization, Retrogradation, Pasting and Gel Textural Properties. Food Chemistry 2007, 101, 1499–1507.
- Adebowale, K.O.; Lawal, O.S. Comparative Study of the Functional Properties of Bambarra Groundnut (Voandzeia Subterranean), Jack Bean (Canavalia Ensiformis) and Mucuna Bean (Mucuna Pruriens) Flours. Food Research International 2004, 37, 355–365.
- Akinjayeju, O.; Ajayi, O.F. Effects of Dehulling on Functional and Sensory Properties Of Flours from Black Beans (Phaseolus Vulgaris)—Properties of Black Beans Flours. Food and Nutrition Science 2011, 2, 344–349.
- Kaur, M.; Sandhu, K.S.; Singh, N. Comparative Study of the Functional, Thermal and Pasting Properties of Flours from Different Field Pea (Pisum Sativum L.) and Pigeon Pea (Cajanus Cajan L.) Cultivars. Food Chemistry 2007, 104, 259–267.
- Brennan, C.S.; Blake, D.E.; Ellis, P.R.; Schofield, J.D. Effects of Guar Galactomannan on Wheat Bread Microstructure and on the in Vitro and in Vivo Digestibility of Starch in Bread. Journal of Cereal Science 1996, 24, 151–160.
- Li, S.; Wei, Y.; Fang, Y.; Zhang, W.; Zhang, B. DSC Study on the Thermal Properties of Soybean Protein Isolates/Corn Starch Mixture. Journal of Thermal Analysis and Calorimetry 2014, 115(2), 1633–1638.
- Wani, I.A.; Sogi, D.S.; Wani, A.A.; Gill, B.S. Physical and Cooking Characteristics of Some Indian Kidney Bean (Phaseolus Vulgaris L.) Cultivars. Journal of the Saudi Society of Agri Sci 2015 http://dx.doi.org/10.1016/j.jssas.2014.12.002