
ABSTRACT
The potential of multi-spectral visible-near infrared imaging to discriminate beef meat muscles in relation with their type and animal origin was examined in the present study. Two hundred forty muscles of three types (longissimus thoracis, biceps femoris, and semimembranosus) were obtained from the carcasses of three types of animals, two late-maturing cattle types of animals (Limousin and Blond d’Aquitaine) that grow slowly and deposit more muscles and less fat, compared to one early-maturing cattle types of animals (Angus) which tends to have muscles richer in collagen and in intramuscular fat. Two hundred forty cube images were collected with nineteen Ligth Emitting Diodes (405 to 1050 nm) using the Videometer Lab2 device. The image cubes were processed in order to extract image mean spectra and image shape features from co-occurrence and difference of histogram matrices. The results of the partial least square discriminant analysis performed on image texture features and spectral data show a maximum ranging from 63.5 to 83% of good classification depending on the muscle and breed considered. This study demonstrated the promising potential of the visible-near infrared multi-spectral imager to characterize beef meat muscles based on muscle type and its animal origin.
Introduction
Beef meat has always been an important component in human diet. The development in the quantity and availability of this product leads the beef industry to be more and more concerned by the authenticity and the detection of adulteration. In recent years, the retail cost of beef having increased significantly, the substitution of high value raw meat with cheaper meat has also increased.[Citation1] The value of beef meat is not only determined by muscle type from which it comes but also the type of animals. Types of animals or crossbreed animals with high intramuscular fat content (for example Aberdeen Angus) are known to give a meat with higher scores for sensory attributes such as texture, flavor, and juiciness[Citation2] and types of animals with high muscle mass (for example Blonde d’Aquitaine) to give tender meat.[Citation3] In this context, it is, therefore, necessary to provide to beef manufacturers a tool to achieve rapid and precise discrimination of raw pieces and of types of animals from which they come.
Classical spectroscopic techniques (fluorescence, visible, and infrared) are known to be generally quick and inexpensive to implement. They are used in line as they do not require direct contact with the product to make a measurement. These methods can therefore be a remarkably effective alternative to traditional analyzes, that are generally expensive and technically long to implement. The fluorescence and infrared spectroscopy have, in recent years, demonstrated their ability to be used to conduct and process control in the food industry.[Citation4,Citation5] However, these methods provide information on a small region of a sample at a time. Therefore, the product analyzed should be reasonably isotropic in order to extract features which represent the properties of the whole product. This disadvantage of conventional spectroscopy can be easily overcome by the use of commonly known hyperspectral (HIS) and multi-spectral (MIS) imaging[Citation6] techniques. Those technics enable to record spectral and spatial features of a region of interest (ROI) based on image analysis on a part (i.e., few square mm) or on the entire sample (i.e., 10cmCitation2) providing a higher representative data of the sample studied. MIS enables to record a cube images on a small number of wavelengths that provides the possibility to record images located on different areas of the electromagnetic spectrum (ultraviolet [UV], visible [VIS], or/and near infrared [NIR]). The MIS imaging has been used in different studies, for example to authenticate and predict physicochemical parameters of blue-veined cheeses[Citation3,Citation7] and for quality assessment of pomegranate fruit.[Citation8] For meat products analysis, MIS was used recently to characterize sensory properties, physicochemical parameters, microbial quality, and adulteration of beef.[Citation9–Citation12] Studies on beef showed the potential of this method to predict tenderness (0.89 ≥ RCitation2 ≥ 0.75), to discriminate samples according to animal age (85% of good classification in average) and muscle type (91% of good classification in average) and to predict (0.61 ≥ RCitation2 ≥ 0.91) some physicochemical characteristics of samples (mechanical properties, total collagen, and lipids). The studies conducted up to date show some limits due principally to the number of muscles, animal diets, and muscle type considered. So, the aim of this study was to assess, by introducing a high variability in muscle sample characteristics, and the potential of higher number of exciting Ligth Emitting Diode (LED) (i.e., 19 excitation LEDs ranging from the near-UV to the NIR) than those previously used to discriminate beef muscles. For that, we have chosen to work on three different muscles of three types of animals, two late-maturing cattle breeds (Limousin and Blonde d’Aquitaine) and one early-maturing cattle breed (Aberdeen Angus). Animals from Aberdeen Angus and Blonde d’Aquitaine breeds were extreme from their muscle characteristics compared to animals from Limousin breed.[Citation13] Those objectives were conducted both by using image mean spectra and image texture features.
Materials and methods
This study was carried out in compliance with the French recommendations and those of the Animal Care and Use Committee of the National Institute for Agricultural Research (INRA, Institut National de la Recherche Agronomique) of Clermont-Ferrand/Theix, France for the use of experimental animals including animal welfare.
Beef production and muscle sampling
The experiment was performed on 40 young entire males from three types of animals of three breeds: Aberdeen Angus (AA; n = 12), Limousine (LI; n = 14), and Blonde d’Aquitaine (BA; n = 14). The conditions of production of animals were previously described by Dubost et al.[Citation13] In order to increase the variability between samples, three muscles (longissimus thoracis [LT], semimembranosus [SM], and biceps femoris [BF]) were taken from each animal at 24 h post-mortem from carcasses chilled in a cold room (+2°C) giving a total of 120 meat samples. For each muscle, samples of 10 × 7 × 3 cm were taken in parallel to the direction of the muscle fibers in height, at the same localization inside each muscle, from the 9th rib for LT and from the center of the muscle for SM and BF. They were progressively frozen in pure ethanol, kept at –20°C and then thawed just before performing multi-spectral image (MSI) analysis.
Acquisition of muscle MSIs
The MSI of the 120 meat samples were recorded with a VideometerLab2® device (Videometer A/S, Danemark) equipped with a MSI camera (Point Gray Research, Scorpion SCOR-20SOM, 1200 × 1200 pixels) for laboratory analysis that is able to measure light intensity in the VIS-NIR region from 405 to 1050 nm using 19 emitting LEDs.[Citation3,Citation7] Before MSI acquisition, the camera was calibrated by three successive plates: a white one for reflectance correction, a dark one for background correction and a doted one for the pixel position calibration. To ensure a total diffuse illumination of the object without shading and reflection, the camera was equipped with an Ulbricht sphere, internally painted with a diffuse reflecting paint, and an opening in the top and underside of the sphere. The top hole was used for placing the camera, whereas the bottom hole was used to place the object for image acquisition.
For each muscle and before image acquisition, the samples previously kept at –20°C were defrosted at 4°C, equilibrated at 20°C in a water bath, and then cut gently into a 6 × 5 × 1.5 cmCitation3, wiped out by paper towels to eliminate moisture on meat surface and placed in the dark by lowering the hollow sphere until it comes into contact with the sample support plate. Each sample was then illuminated successively by the 19 emitting LEDs giving a cube image with 1200 pixels in the X axe, 1200 pixels in the Y axe and Z the number of LED (). Two images were recorded per muscle, representing at least 160 cube images for one breed and a total of 240 cube images (i.e., 4560 images).
Figure 1. A: An example of a cube image of beef muscles (y = number of pixel; x = number of pixels, z = number of LED; in our study x = 1200 pixels, y = 1200 pixels, and z = 19) and image of Biceps femoris: B; Longissimus thoracis: C and Semimembranosus: D muscles recorded after excitation at 405 nm for Limousine breed.
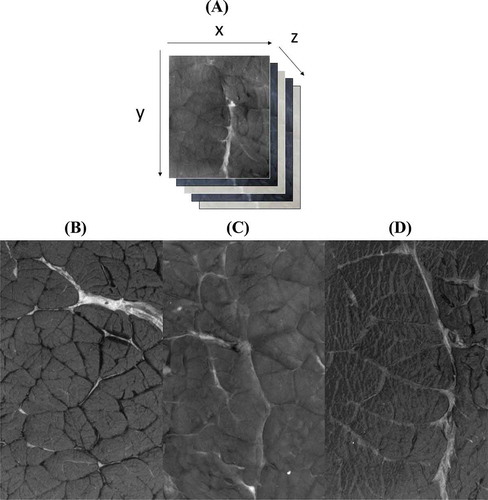
Image mean spectra
Two average image spectra (SPECT) were recorded per meat sample by using the VideometerLab2® software. The SPECT data were extracted from a ROI of 700 × 575 pixels selected at the center in order to prevent the side effects for each meat sample giving a data base containing 240 image mean spectra.
Pretreatment of image mean spectra
In order to optimize the prediction accuracy of the models by decreasing the scattering effects, three pre-processing methods were investigated, standard normal variate (SNV), multiple scattering correction (MSC), and Normalization (AREA, corresponding to the area under curve = 1). Data preprocessing were performed by using the PLS-Toolbox v.7.5 (Eigenvector Research) for MATLAB 2013b (The Mathworks Inc., Natic, MA, USA).
Image texture features extraction
Second-order statistics features were investigated in the present study to evaluate the potential of image texture features to discriminate muscles. The second order statistics are defined as the likelihood of observing the absolute difference between a pair of gray values occurring at the endpoints of a dipole (or needle) of random length placed in the image at a random location and orientation ().[Citation14–Citation16] To extract image texture features from muscle images, two methods were used. The first one consisted on the analysis of the gray level histogram difference matrix (GLHD) and the second one on the analysis of the Gray Level Co-occurrence Matrix (GLCM). The texture features were calculated in the same ROI (700 × 575 pixels) used to extract the SPECT data that enabled to decrease the time calculation and to prevent the sample side effects.
Figure 2. Process of GLCM (Gray level co-occurrence matrix) features extraction from the Region of interest (ROI; A, B, and C: the three steps necessary for the extraction of the GLCM texture features; X: number of pixels in the x axis, 575; Y: number of pixels in the y axis, 700; Z: number of LED, 19; Moy: Mean; Var: Variance; ASM: Angular second moment; CONT: Contrast, CORR: Correlation; CORRN: Non normalized correlation; ENT: Entropy; HOM: Homogeneity; DIAG: Diagonal moment; CSHADE: Cluster shade; CPROM: Cluster prominence).[Citation1]
![Figure 2. Process of GLCM (Gray level co-occurrence matrix) features extraction from the Region of interest (ROI; A, B, and C: the three steps necessary for the extraction of the GLCM texture features; X: number of pixels in the x axis, 575; Y: number of pixels in the y axis, 700; Z: number of LED, 19; Moy: Mean; Var: Variance; ASM: Angular second moment; CONT: Contrast, CORR: Correlation; CORRN: Non normalized correlation; ENT: Entropy; HOM: Homogeneity; DIAG: Diagonal moment; CSHADE: Cluster shade; CPROM: Cluster prominence).[Citation1]](/cms/asset/7b631ae3-1629-4f97-8577-60881df016a6/ljfp_a_1210163_f0002_b.gif)
For the GLCM method, texture features were calculated on four symmetric GLCM using a dipole length (d) of 1 and successively an orientation angle (θ) of 0°, 45°, 90°, and 135°. By this method it was possible to extract a total of 29 textural features () as previously reported.[Citation3,Citation7] As a result, a GLCM textural matrix of 240 image cubes × 29 variables were calculated.[Citation3,Citation7]
For the GLHD method, the same d and θ values were used enabling to extract up to five texture features (mean, variance, entropy, contrast, and energy; ). As a result, a GLHD textural matrix of 240 image cubes × 4 variables were calculated. The different GLCM and GLHD textural features were calculated using a home program in MATLAB R2013b (The Mathworks Inc., Natic, MA, USA), based on ximage toolbox.
Figure 3. Process of GLHD (gray level histogram difference) features extraction from the region of interest (ROI; A, B, and C: the three steps necessary for the extraction of the GLHD texture features; X: number of pixels in the x axis, 575; Y: number of pixels in the y axis, 700; Z: number of LED, 19; V: image obtained after translation; U: initial image having the same number of pixel as the image V; W: image obtained after subtraction of pixel of image V from pixel of image U; MOY: Mean, VAR: Variance, ASM: Angular second moment, CONT: Contrast, ENT: Entropy).
Partial least square discriminant analysis (PLSDA)
PLSDA was performed on auto-scaled data for GLCM and GLHD features and on mean centered image mean spectra after preprocessing in MATLAB R2013b (The Mathworks Inc., Natic, MA, USA) using the PLS-Toolbox v.7.5 (Eigenvector Research). The total number of samples was divided into two sets, 70% (i.e., 84) of the samples were used for model calibration and 30% (i.e., 36) to verify the model robustness (validation), by using the nearest neighbor thinning method proposed in the PLS-Toolbox v.7.5 (Eigenvector Research). This method enabled to select validation samples which best fill out all covariance space.
PLSDA is a well-spread technique and its aim is to predict the membership of an individual to a qualitative group defined as a preliminary. Comparison of the predicted groups to the real group is generally used as an indicator of the quality of the discrimination and it is valued as the percentage of correct classifications (CCs). In the present study, model performance was measured in terms of percentage of CC, precision, and prediction error. The optimum number of PLSDA factors was estimated by analyzing the percentage of validation error and the variance captured error. Before performing PLSDA meat samples were divided in three classes related to muscles (BF, LT, and SM) and types of animals (AA, BA, and LI). The procedure of the data extraction from MSIs, before performing PLSDA, was summarized in .
Figure 4. Process of multispectral image acquisition and data (image mean spectra, GLHD: Gray level histogram difference and GLCM: Gray level co-occurrence matrix) extraction.
Results
Image mean spectra analysis
As examples, normalized mean spectra of the three different muscles (BF, LT, and SM) of LI breed and spectra of the three different types of animals (AA, BA, and LI) were presented in and , respectively. It can be identified that the general trends of the image mean spectra were similar, whatever the types of animals. All the spectra presented two bands, a small one from 405 to 570 nm with a maximum at 500 nm and a huge one from 570 to 1050 nm with a shoulder at 645 nm and a maximum at 850 nm. More precisely, in the VIS region (i.e., from 405 to 700 nm), BF and SM muscles presented equivalent reflectance, while LT muscle tended to present higher reflectance values. In the NIR region (i.e., from the 700 to 1050 nm) the opposite was observed, LT muscle tended to present the lowest reflectance intensities (). The three animal types presented the same trends of the image mean spectra. More precisely, in the VIS region (i.e., from 405 to 700 nm), LI and BA animals presented equivalent reflectance, while AA tended to present higher reflectance values. In the NIR region (i.e., from the 700 to 1050 nm) the opposite was observed, AA breed tended to present the lowest reflectance intensities ().
Figure 5. Example of mean spectral data of the three muscles based on limousine breed (BF: biceps femoris; LT: longissimus thoracis; SM: semimembranosus).
Figure 6. Mean spectral data performed on the three muscles types for each animal types (AA: Aberdeen angus, LI: Limousine, BA: Blonde d’Aquitaine).
Classification of muscles based on image mean spectra and image texture features
Percentage of CC, precision, and error of the best PLSDA models carried out on image mean spectra (i.e., SPECT), GLHD and GLCM features to classify samples based on muscle categories and types of animals were summarized in and , respectively. First of all, we observed that for all the prediction models, the calculated percentages of CC of the validation steps were generally lower compared to the calibration percentages of CC which is somehow expected as validation data were not initially included in model calibration, but used as unknown samples for prediction.
Table 1. PLSDA results of beef meat samples for calibration and external validation based on the animal breed.
Table 2. PLSDA results of beef meat samples for calibration and external validation based on the muscle type.
In the present study, three mathematical preprocessing techniques were applied to image mean spectra (AREA, MSC, and SNV) in order to obtain the best discrimination result. This study demonstrated that nearly all-preprocessed models calculated are more parsimonious than the un-preprocessed models except for the PLSDA conducted on the types of animals which gave the best results with raw data. More precisely, PLSDA performed on image mean spectra to discriminate samples relative to types of animals showed that the best models were obtained by un-preprocessed spectra (raw data) with 10 PLSDA factors. After external validation, the mean of regression parameters obtained were, on average for the 3 types of animals, 77, 86, and 22% for CC, precision and error classification, respectively.
After external validation, PLSDA models considering GLCM features gave lower classification accuracy on average for the three types of animals, with 63, 78, and 27% of CC, precision and error, respectively. Using GLHD features with PLSDA gave the worst results, with mean regression factors of 58, 73, and 29% for CC, precision and error, respectively.
The best models for GLCM and GLHD textural features were obtained with excitation wavelengths and orientations (θ) of 505 nm/0° and 525 nm/135°, respectively. Considering the percentage of CC of each samples show that types of extreme animals (BA and AA) where well reclassified compared to intermediate animals (LI) regardless of the method (i.e., SPECT, GLCM and GLHD) applied for discrimination. Very encouraging results were obtained when PLSDA was applied for the discrimination of muscle type regardless of the data considered (i.e., SPECT, GLCM, and GLHD features). With mean spectra (i.e., SPECT) the best results were observed when using the normalization (i.e., AREA) preprocessing method coupled with 10 PLS factors (mean CC: 82%, mean precision: 93%, and mean error: 13%). The score plot of the first two LVs confirmed the results observed on image mean spectra (), illustrating good discrimination of LT muscles from BF and SM for which some overlapping was observed (). In addition, the plot of loadings () provided interesting information about the association of the wavelengths with meat samples. Thus, the wavelengths in the visible region (405 to 700 nm) are correlated with LT samples, whereas the remaining wavelengths are correlated with the BF and SM samples.
Figure 7. PLS-DA score plot of the two first loading vectors (LV); A: illustrating the separation of the three beef muscles for the different animal types (BF: biceps femoris; LT: longissimus thoracis; SM: semimembranosus), and loading plot; B: depicting the contribution of the wavelengths to the muscles discrimination.
Applying GLCM (72% mean CC, 84% mean precision and 19.5% mean of error after validation) and GLHD (69% mean CC, 80.5% mean precision and 16% mean of error after validation) features with PLSDA was less successful for muscle discrimination. The best PLSDA models for GLCM and GLHD were calculated with a small number of regression factors (5 ≤ LV), the same LED (940 nm) but with different orientation values (θ), 45° and 135°, respectively. Considering the classification results of each muscles show that LT muscles where well reclassified compared to BF muscles and SM muscles regardless of the method used for discrimination (i.e., SPECT, GLCM, and GLHD).
Discussion
In recent years the growing consumer demand for information on the quality and conditions of food production has prompted suppliers to improve the information available on the food products. In order to satisfy the consumer expectations, the companies need efficient tools to rapidly authenticate food and detect possible adulterations. In this context the potential of a MSI was evaluated in a first part to discriminate three bovine muscles (BF, LT, and SM) sampled on three types of animals extreme for their characteristics and in a second part to discriminate these three types of animals. These objectives were conducted both by using image mean spectra (i.e., SPECT) and image texture features, GLHD and GLCM coupled with PLSDA.
Effect of image mean spectra preprocessing on classification accuracy
Preprocessing is performed after data acquisition to modify the data before further analysis. Most of the time, its purposes is to remove bias, to linearize the response of the variables and to remove variations which are not of interest in the analysis (interfering variance).[Citation17] The best preprocessing method differs between the objective of discrimination (i.e., muscles and types of animal) and the features considered (i.e., GLCM, GLHD, and SPECT) suggesting that it is impossible to know beforehand which preprocessing would lead to the most accurate model as previously reported.[Citation18] The results also show, and recalled, that normalization is not at all a neutral operation and has to be carefully chosen.
Sample discrimination by MSI data
PLSDA has been used in order to evaluate the discriminant ability, as a function of muscle types and types of animals, of texture features (GLCM and GLHD) and image mean spectra (i.e., SPECT) extracted from MSIs. Preliminary, mean spectrum of each muscle was investigated and enabled a good discrimination of samples with respect to the types of animals and muscle types, with CC accuracy ranging from 77 to 82% after external validation. The results depicted that dissimilarity between characteristics of muscle types (BF, LT, and SM) is higher than the difference observed between types of animals as noted on mean spectrum. The present conclusion was consistent with a previous study conducted on biochemical and structural parameters on the same samples.[Citation13]
The discrimination between muscle types seems to arise from difference in reflectance intensities of meat water, fat, and protein contents and from their interactions. Indeed, most of the spectral information located in the spectral range studied is sensitive to meat pigments and matrix characteristics (fatty acids, proteins, and moisture).[Citation1] The three muscles investigated presented differences between 405 to 700 nm region due to muscle pigments (i.e., myoglobin, deoxymyoglobin, metmyoglobin, and oxymyoglobin).[Citation19,Citation20] This spectral region was used for colors prediction of meat beef (a* value) and pork (a* and b* values). It was reported that oxymyoglobin had a single absorption band around 560 nm.[Citation21,Citation22] High correlation was found, in meat pork, between the 592 and 632 nm wavelength bands for both a* and b* values, respectively.[Citation23] The region around 632 nm was noted as being an indicator of oxymyoglobin, myoglobin, and total pigments.[Citation24,Citation25] Thus dissimilarities observed from 405 to 700 nm may result from differences in muscle color. This hypothesis has been verified by at least two authors. Torrescano et al.[Citation26] have shown that SM and BF of Swiss Brown young bulls were very close for the yellow color (b* value) compared to LT muscle, while Isdell et al.[Citation27] depicted a similar red color (a* value) between BF and SM muscles compared to LT muscles. Based on these observations, it appears that SM and BF muscles presented almost the same color while LT muscle presented a different color.
Spectral difference was also observed between the 850 and 1050 nm. The 890 nm band was identified as the most significant wavelength for predicting water content in fried minced meat,[Citation28] while the 850 and 870 nm bands may be assigned to O-H vibration of water molecules. The spectral bands located between the 910 and 970 nm can be assigned to CH and OH vibrations related to proteins and water.[Citation4,Citation29–Citation31] The band at 940 nm can be related to meat fat.[Citation32] The 1050 nm band is close to the bands assigned to fat and proteins.[Citation33–Citation35] These spectral differences were consistent with biochemical analysis of beef meat.[Citation2,Citation36] Bureš et al.[Citation2] noted significant difference between LT (0.46–0.498 g/100 g) and SM (0.368–0.389 g/100 g) total fatty acids while Dubost et al.[Citation36] reported on equivalent samples a higher total lipids content in LT muscles (8.46 g/100 g DM) compared to SM and BF muscles (6.70 and 7.65 g/100 g, respectively). Those spectral differences could also depict differences in structural characteristics of beef muscles.[Citation13] Those authors reported that SM and BF muscles were close in their structural (e.g., perymisium area, endomysium area, branch points) characteristics while LT muscle was different.
Second, treatment of image texture features, extracted from GLHD and GLCM for each of the 19 LEDs, by PLSDA enabled to discriminate muscles depending on muscle type and breed with an accuracy ranging from 58 to 72% in average. For the discrimination of types of animals, the best’s models, with respect to textural features, were obtained with LEDs in the visible region (505 and 525 nm for GLCM and GLHD, respectively). The 505 nm band was assigned to metmyoglobin[Citation37,Citation38] and the 525 nm band was identified as sensitive to meat color.[Citation39] This last band was used in tandem with the 610 nm band as an indicator of the percentage of oxymyoglobin.[Citation40] Those observations are also in agreement with the difference of muscle metabolism of the three types of animals. Indeed, muscles of animals such as AA are more oxidative and less glycolytic than those of animals such as LI.[Citation41] The muscles of BA are more glycolytic and consequently less red than AA muscles that are more oxidative. It is also reported that late-maturing cattle breeds (such as BA) deposit more muscle and less fat, compared to early-maturing cattle (such as AA)[Citation36,Citation42] but no wavelength assigned to proteins or fat (i.e., 910, 940, 970, and 1050 nm) was identified as being the most discriminating one.
With respect to muscle type, the best classification considering textural features were both obtained with the 940 nm excitation LED suggesting that muscle discrimination could be assigned to difference in muscle marbling.[Citation32] The results of the present study are in agreement with previous investigation but enabled to identify a new discrimination LED in the NIR region (i.e., 940 nm) but with lower classification accuracy. The best LED for discrimination of muscle type was identified as being the white-light by Kulmyrzaev et al.[Citation11] The white-light enabled to obtain a 91% of good classification for three muscles.[Citation11] The dissimilarity in CC between the two studies could arise from the lower variability between samples investigated by Kulmyrzaev, et al.[Citation11] Indeed, only muscles from one breed (i.e., Limousine) was analyzed by image texture features. Difference in muscle studied (longissimus dorsi, gluteus medius, and semitendinosus) and excitation channel used (i.e., white-light channel and UV channel) could also explain the best results reported previously.
In the present study, using spectra for discrimination gave higher accuracy for muscle classification (77 to 82%) compared to textural features (58 to 72%). This difference may arise from considering texture features of only one LED of the cube images at a time before performing PLSDA. To validate this hypothesis, the GLHD and GLCM texture features of the 19 LEDs and each direction were merged in two independent matrices and analyzed by PLSDA. The results obtained with respect to types of animals (61 and 59% of CC considering the GLCM and GLHD, respectively) and muscle types (69 and 61% of CC considering the GLCM and GLHD, respectively) did not validate our hypothesis.
To optimize the discrimination accuracy of the PLSDA based on textural features (i.e., GLHD and GLCM) four angle values (i.e., 0°, 45°, 90°, and 135°) were investigated. This study depicted that no specific orientation angle was identified as being the best one for samples discrimination based on muscle type or type of animals.
Conclusion
Multi-spectral imaging was used as a rapid method for meat beef authentication based on types of animals and muscle types. The results demonstrated that sample discrimination is more accurate when attempting to discriminate muscle types and more challenging when attempting to discriminate muscle according to types of animals. Moreover, PLSDA performed better when considering spectra and less when considering GLCM and GLHD features. In this study, selection of optimum characteristic images is a critical step, which can greatly affect prediction accuracy. Therefore, in order to improve the classification accuracy by using texture features it would be interesting to test different dipole lengths (e.g., d = 2, 3, 4…) and to perform chemometric analysis (e.g., principal components analysis or minimal noise fraction), directly on the cube image in order to select optimum characteristic images before extraction of texture features. Taking into account the number of samples (three muscles and three types of animals) and conditions of animal production investigated (e.g., feeding) to enhance the samples variability, this study brings new elements comforting the potential of MSI analysis to authenticate beef muscles. Nonetheless, the models obtained are not ready to be used in practical conditions because a higher number of muscles and types of animals should be investigated. But we hope that multi-spectral imaging could be used in a near future as a rapid, non-invasive method for muscles authentication and prediction of quality parameters because it can drastically reduce analytical time and cost of traditional measurements.
References
- Cozzolino, D.; Murray, I. Identification of Animal Meat Muscles by Visible and Near Infrared Reflectance Spectroscopy. LWT–Food Science and Technology 2004, 37, 447–452.
- Bureš, D.; Bartoň, L.; Zahrádková, R.; Teslík, V.; Krejčová, M. Chemical Composition, Sensory Characteristics, and Fatty Acid Profile of Muscle from Aberdeen Angus, Charolais, Simmental, and Hereford Bulls. Journal of Animal Sciences 2006, 51, 279–284
- Monson, F.; Sanudo, C.; Sierra, I. Influence of Cattle Breed and Ageing Time on Textural Meat Quality. Meat Science 2004, 68, 595–602.
- Bertrand, D.; Dufour, E. La Spectroscopie Infrarouge et Ses Applications Analytiques [The infrared spectroscopy and its analytical applications]. Lavoisier: Paris, France, 2006.
- Karoui, R.; Dufour, E. Development of a Portable Spectrofluorometer for Measuring the Quality of Cheese. Dairy Science & Technology 2008, 88, 477–494.
- Gowen, A.A.; O’Donnell, C.P.; Cullen, P.J.; Downey, G.; Frias, J.M. Hyperspectral Imaging—An Emerging Process Analytical Tool for Food Quality and Safety Control. Trends in Food Science & Technology 2007, 18, 590–598.
- Jacquot, S.; Karoui, R.; Abbas, K.; Lebecque, A.; Bord, C.; Aït-Kaddour, A. Potential of Multispectral Imager to Characterize Anisotropic French PDO Cheeses: A Feasibility Study. International Journal of Food Properties 2015, 18, 213–230.
- Khodabakhshian, R.; Emadi, B.; Khojastehpour, M.; Golzarian, M.R.; Sazgarnia, A. Development of a Multispectral Imaging System for Online Quality Assessment of Pomegranate Fruit. International Journal of Food Properties 2016, in press.
- Abouelkaram, S.; Chauvet, S.; El Jabri, M.; Strydom, P.; Bertrand, D.; Damez, J. Muscle Study with Multispectral Image Analysis. In International Congress of Meat Science and Technology. Declan, T.; Rachel P.; Briege B.; Joseph K.; Ed.; Wageningen Academic Publishers: Dublin, Ireland: 2006; 669–670 pp.
- El Jabri, M.; Abouelkaram, S.; Damez, J.L.; Berge, P. Image Analysis Study of the Perimysial Connective Network, and Its Relationship with Tenderness and Composition of Bovine Meat. Journal of Food Engineering 2010, 96, 316–322.
- Kulmyrzaev, A.; Bertrand, D.; Lepetit, J.; Listrat, A.; Laguet, A.; Dufour, E. Potential of a Custom-Designed Fluorescence Imager Combined with Multivariate Statistics for the Study of Chemical and Mechanical Characteristics of Beef Meat. Food Chemistry 2012, 131, 1030–1036.
- Ropodi, A.I.; Pavlidis, D.E.; Mohareb, F.; Panagou, E.Z.; Nychas, G.J.E. Multispectral Image Analysis Approach to Detect Adulteration of Beef and Pork in Raw Meats. Food Research International 2015, 67, 12–18.
- Dubost, A.; Micol, D.; Picard, B.; Lethias, C.; Andueza, D.; Bauchart, D.; Listrat, A. Structural and Biochemical Characteristics of Bovine Intramuscular Connective Tissue and Beef Quality. Meat Science 2013, 95, 555–561.
- Conners, R.; Harlow, C. A Theorical Comparison of Texture Algothms. IEEE Transactions on Pattern Analysis and Machine Intelligence 1980, 2(3), 204–222.
- Haralick, R.M.; Shanmugam, K.; Dinstein, I.H. Textural Features for Image Classification. EEE Transactions on Systems, Man and Cybernetics 1973, SMC-3, 610–621.
- Weszka, J.S.; Dyer, C.R.; Rosenfeld, A. A Comparative Study of Texture Measures for Terrain Classification. IEEE Transactions on Systems, Man and Cybernetics 1976, SMC-6, 269–285.
- Panneton, B.; Roger, J.M.; Guillaume, S.; Longchamps, L. Effects of Preprocessing of Ultraviolet-Induced Fluorescence Spectra in Plant Fingerprinting Applications. Applied Spectroscopy 2008, 62, 747–752.
- Fernández-Cabanás, V.; Garrido-Varo, A.; Olmo, J.G.; De Pedro, E.; Dardenne, P. Optimisation of the Spectral Pre-Treatments Used for Iberian Pig Fat NIR Calibrations. Chemometrics and Intelligent Laboratory Systems 2007, 87, 104–112.
- Liu, Y.; Lyon, B.G.; Windham, W.R.; Realini, C.E.; Pringle, T.D.; Duckett, S. Prediction of Color, Texture, and Sensory Characteristics of Beef Steaks by Visible and Near Infrared Reflectance Spectroscopy. A Feasibility Study. Meat Science 2003, 65, 1107–1115.
- Prieto, N.; López-Campos, Ó.; Zijlstra, R.T.; Uttaro, B.; Aalhus, J.L. Discrimination of Beef Dark Cutters Using Visible and Near Infrared Reflectance Spectroscopy. Canadian Journal of Animal Science 2014, 94, 445–454.
- Swatland, H.J. Infrared Fiber Optic Spectrophotometry of Meat. Journal of Animal Science 1983, 56, 1329–1333.
- Swatland, H.J. Color Measurements on Pork and Veal Carcasses by Fiber Optic Spectrophotometry. Canadian Institute of Food Science and Technology Journal 1986, 19, 170–173.
- Cozzolino, D.; Barlocco, N.; Vadell, A.; Ballesteros, F.; Gallieta, G. The Use of Visible and Near-Infrared Reflectance Spectroscopy to Predict Colour on Both Intact and Homogenised Pork Muscle. LWT–Food Science and Technology 2003, 36, 195–202.
- Davis, C.E.; Birth, G.S.; Townsend, W.E. Analysis of Spectral Reflectance for Measuring Pork Quality. Journal of Animal Science 1978, 46, 634–638.
- Franke, W.C.; Solberg, M. Quantitative Determination of Metmyoglobin and Total Pigment in an Intact Meat Sample Using Reflectance Spectrophotometry. Journal of Food Science 1971, 36, 515–519.
- Torrescano, G.; Sanchez-Escalante, A.; Gimenez, B.; Roncales, P.; Beltran, J.A. Shear Values of Raw Samples of 14 Bovine Muscles and Their Relation to Muscle Collagen Characteristics. Meat Science 2003, 64, 85–91.
- Isdell, E.; Allen, P.; Doherty, A.; Butler, F. Effect of Packaging Cycle on the Colour Stability of Six Beef Muscles Stored in a Modified Atmosphere Mother Pack System with Oxygen Scavengers. International Journal of Food Science & Technology 2003, 38, 623–632.
- Frosch, S.; Dissing, B.S.; Nielsen, M.E. Determination of Astaxanthin Concentration in Rainbow Trout (Oncorhynchus Mykiss) by Multispectral Image Analysis. 2nd Scandinavian Symposium on Chemometrics Billund, Denmark, June 7–10, 2011.
- Alomar, D.; Gallo, C.; Castañeda, M.; Fuchslocher, R. Chemical and Discriminant Analysis of Bovine Meat by Near Infrared Reflectance Spectroscopy (NIRS). Meat Science 2003, 63, 441–450.
- Daugaard, S.B. Multi-Spectral Analysis of Frying Processes for Meat Products. Building 321, DK-2800 Kongens Lyngby, Denmark: Technical University of Denmark Informatics and Mathematical Modeling, 2007.
- Murray, I. The NIR Spectra of Homologous Series of Organic Compounds. In International NIR/NIT Conference Budapest: Akademiai Kiado: Hollo, J.; Kaffka, K.J.; Gonczy, J.L.; 1986; 13–28 pp.
- Ziadi, A.; Maldague, X.; Saucier, L.; Duchesne, C.; Gosselin, R. Visible and Near-Infrared Light Transmission: A Hybrid Imaging Method for Non-Destructive Meat Quality Evaluation. Infrared Physics & Technology 2012, 55, 412–420.
- Osborne, B.G. Near-Infrared Spectroscopy in Food Analysis. In Encyclopedia of Analytical Chemistry. John Wiley & Sons: BRI Australia Ltd, North Ryde, Australia, 2006.
- Šašić, S.; Ozaki, Y. Band Assignment of Near-Infrared Spectra of Milk by Use of Partial Least-Squares Regression. Applied Spectroscopy 2000, 54, 1327–1338.
- Workman, J.J. Interpretive Spectroscopy for Near Infrared. Applied Spectroscopy Reviews 1996, 31, 251–320.
- Dubost, A.; Micol, D.; Meunier, B.; Lethias, C.; Listrat, A. Relationships Between Structural Characteristics of Bovine Intramuscular Connective Tissue Assessed by Image Analysis and Collagen and Proteoglycan Content. Meat Science 2013, 93, 378–386.
- Price, J.F.; Schweigert, B.S. The Science of Meat and Meat Products. Publications in food science and nutrition, Food & Nutrition Press: Westport, Connecticut, 639.
- Swatland, H.J. A Review of Meat Spectrophotometry (300 to 800 nm). Canadian Institute of Food Science and Technology Journal 1989, 22, 390–402.
- Shackelford, S.D.; Wheeler, T.L.; Koohmaraie, M. On-Line Classification of US Select Beef Carcasses for Longissimus Tenderness Using Visible and Near-Infrared Reflectance Spectroscopy. Meat Science 2005, 69, 409–415.
- AMSA. Guidelines for Meat Color Evaluation. American Meat Science Association: Chicago: IL, 1991.
- Bonnet, M.; Faulconnier, Y.; Leroux, C.; Jurie, C.; Cassar-Malek, I.; Bauchart, D.; Boulesteix, P.; Pethick, D.; Hocquette, J.F.; Chilliard, Y. Glucose-6-Phosphate Dehydrogenase and Leptin Are Related to Marbling Differences Among Limousin and Angus Or Japanese Black × Angus Steers. Journal of Animal Science 2007, 85, 2882–2894.
- Listrat, A.; Picard, B.; Jailler, R.; Collignon, H.; Peccatte, J.R.; Micol, D.; Geay, Y.; Dozias, D. Grass Valorisation and Muscular Characteristics of Blonde d’Aquitaine Steers. Animal Research 2001, 50, 105–118.