
ABSTRACT
To evaluate the effect of the processing technology utilized on the quality of teas, the major water-soluble and volatile components of 24 Biluochun and regular green tea samples obtained in different production areas were determined using the sensory evaluation, Folin-Ciocalteu method, the phenol-sulfuric acid method, high-performance liquid chromatography, and headspace solid-phase microextraction coupled with gas chromatography-mass spectrometry. There were small differences between the contents of the major water-soluble compounds identified in these samples. Sixty-five volatile compounds were identified in these teas. These molecules included 22 hydrocarbons, 18 alcohols, 8 ketones, 6 esters, 3 aldehydes, 3 heterocyclics, 2 nitrogens, 1 lactone, 1 acid, and 1 phenolic. Statistical analyses of these 65 compounds using principal component analysis and cluster analysis revealed that the contents of the Biluochun samples were highly similar and were different from those of the regular green teas. This study suggested that, although the geographical origin and cultivar influenced the aroma characteristics of tea products somewhat, processing technologies played an important role on tea aroma.
Introduction
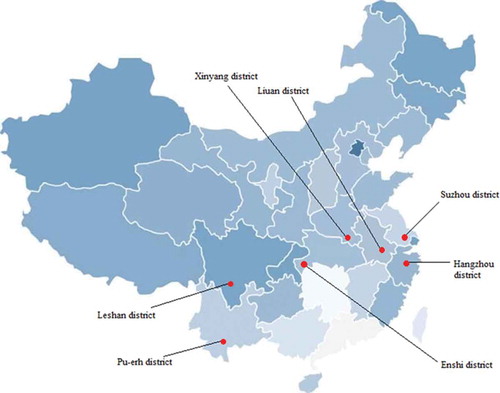
Tea, one of most popular beverages in the world, is a type of fast consumption goods. China is the largest producer of tea in the world, with tea production regions distributed across many provinces from southwestern China to southeastern China.[Citation1] Two tea subspecies grow in China, i.e., Camellia sinensis var. sinensis and Camellia sinensis var. assamica. The Camellia sinensis var. sinensis tea plants have a relatively broad distribution throughout the provinces of southeastern China, including the Zhejiang, Sichuan, Anhui, Henan, Hubei, and Jiangsu Province. In contrast, the Camellia sinensis var. assamica tea plants are narrowly distributed, i.e., they are found only in Yunnan Province in southwestern China, particularly in the regions near the Pu’er district.[Citation2] shows the distribution of these two types of tea plants. Pu’er region is characterized by a high altitude that ranges from 317 to 3370 m. The annual mean temperature and rainfall in the Pu’er region are 20.3°C and 1078.9 mm, respectively. Such geographical/climatic conditions are very suitable for the growth of Camellia sinensis var. assamica tea plants. In contrast, the regions of the Taihu district (in Jiangsu Province), which are the famous sites of the production of Biluochun green tea and other regular green teas, are characterized by an altitude of approximately 50 m, an annual mean temperature of 16.5°C, and a mean annual rainfall of 1188.6 mm. It has been shown that differences in the production sites can lead to teas having different chemical characteristics.[Citation3,Citation4] Nevertheless, the question of which factors (geographical, climatic, and taxonomic) substantially affect the quality and taste of teas, in particular of the same type of teas (such as green teas) produced in different sites, has not yet been resolved.
Figure 1. The map of distribution areas of green tea samples.
The raw fresh tea leaves used to produce Biluochun tea, which is one of the most popular non-blended green teas on the market, have different geographical origins. Furthermore, green teas produced in different places often differ in their aroma- and taste-related characteristics. For example, other regular green teas are characterized by a lofty aroma and fresh taste, whereas Biluochun green tea is characterized by a rich fragrant aroma and a sweet taste.[Citation5] Consistent product quality characteristics are essential to marketing teas, and tea quality depends not only on the nature of the fresh raw tea leaves but also on the processing technologies employed for tea production.[Citation6,Citation7] Biluochun green teas, despite their different places of origin, have a unique aromatic property unlike those of other green teas. Although the aromatic contents of teas are affected by the plant varieties, the climate and the soil properties, among other factors, the processing technologies employed to produce teas have a major effect on the volatile compound contents of teas. For example, whereas only Camellia sinensis var. assamica tea leaves from the Pu’er district in Yunnan Province are used to produce Dianhong black tea and Pu’er green tea using different processing technologies, their flavors (a fresh, grassy flavor and a honey-like, floral flavor, respectively) are completely different.[Citation8,Citation9] Interestingly, the fresh leaves of a wide variety of tea plant cultivars, including those obtained from cultivars grown in different regions and those obtained from different varieties of tea plants, can be used to produce Biluochun green teas using an identical processing technology.[Citation10] This process includes withering, panfiring, a first rolling, a first drying, a second rolling, and a second drying steps (). Compared with the processing technology used to produce the other regular green teas, the technology used to produce Biluochun green teas includes two additional steps, i.e., the second rolling and second drying steps.[Citation11] The similarities and differences between the same type of tea products obtained using different types of fresh tea leaves has not yet been extensively studied. It is important to explore the effects of the technologies used to process different types of fresh raw tea leaves on the teas produced in Yunnan Province and the green teas produced in southeastern China.
Figure 2. Tea manufacture major steps and corresponding types of green tea.
The various flavonoids, lipids, and proteins in tea leaves have significant effects on the quality attributes of tea products.[Citation12] Polysaccharides, caffeine, and polyphenols, particularly the catechins, which are highly soluble in water, were found to be the key substances affecting the taste of a tea.[Citation13,Citation14] Moreover, the volatile components of teas significantly contribute to their aromas, according to which teas are classified into different aromatic types.[Citation15] Therefore, the volatile component contents of a tea play a crucial role in determining its quality, which, in turn, greatly affects the degree of its preference by consumers.[Citation16]
It is well-established that the flavors of teas are largely determined by their chemical compound contents.[Citation17] Multivariate statistical methods, such as principal component analysis (PCA) and cluster analysis (CA), are suitable tools for effectively comparing and analyzing the volatile components identified using chromatographic methods.[Citation18–Citation20] However, no studies have determined the characteristics and the similarity, or dissimilarity, of the most popular green tea, i.e., Biluochun tea, which is made using naturally different types of raw fresh tea leaves, and other types of green teas. Few studies have focused on the effects of the Biluochun green tea processing methods on the these types of tea.[Citation11,Citation21,Citation22] To identify the dominant factors determining the differences and similarities in the qualities of Yunnan Biluochun green teas, Jiangsu Biluochun green teas, Yunnan regular green teas, and other regular green teas, we determined their contents of polyphenols, polysaccharides, caffeine, catechins, and aromatic compounds using the Folin-Ciocalteu method, the phenol-sulfuric acid method, high-performance liquid chromatography (HPLC) and a fully automated headspace solid-phase microextraction (HS-SPME) method coupled with gas chromatography-mass spectrometry (GC-MS).
Materials and methods
Materials
Seven samples of Yunnan Biluochun green tea were obtained from seven typical production sites in the Pu’er district, Yunnan Province, China and were named YB1-YB7. Samples of Jiangsu Biluochun green tea obtained from six typical production sites were named JB1-JB6. In addition, six samples of Yunnan regular green tea, which were produced using Camellia sinensis var. assamica leaves that were obtained in the Pu’er district, were named YG1-YG6, and five other regular green teas, which were produced using Camellia sinensis var. sinensis leaves obtained in Sichuan Province, Zhejiang Province, Anhui Province, Henan Province, and Hubei Province, were named RG1-RG5. In addition, to prevent the results from being affected by the age of the tea trees, the Yunnan Biluochun and Yunnan regular green tea tree leaves were obtained from trees that were all approximately 50 years old.
Chemicals
Sodium carbonate (≥99.8%), Folin-Ciocalteu phenol reagent, and gallic acid (≥98.5%) were purchased from Solarbio (Beijing, China). Caffeine, (+)-catechin (C, ≥99%), (-)-epicatechin (EC, ≥98%), (-)-epigallocatechin (EGC, ≥95%), (-)-epigallocatechin gallate (EGCG, ≥95%), and (-)-epicatechin gallate (ECG, ≥98%) were obtained from Sigma-Aldrich (St. Louis, MO, USA.). Methanol (HPLC grade, ≥99.9%, Lichrosolv, Germany) and acetic acid (HPLC grade, ≥99.7%) were obtained from Fisher Scientific. All other reagents and solvents were of analytical grade and were used without further purification unless otherwise noted. All aqueous solutions were prepared using newly double-distilled water.
Sensory evaluation
Following the CNIS GB/T 14487-93 protocol, three grams of each tea sample was extracted using 300 mL of 85 °C distilled water for 15 min. The resulting tea infusion was filtered, cooled to room temperature, and then adjusted to a volume of 500 mL. Then, the taste and flavor sensory characteristics of the tea infusions were evaluated by five panelists at the Faculty of Life Science and Technology, Kunming University of Science and Technology.
Preparation of the tea extracts[Citation23]
Samples weighing 0.2 ± 0.001 g were placed in extraction tubes (110 mL). Five milliliters of a preheated 70% water/methanol-extraction mixture was placed in each tube, after which the tubes were incubated in a water bath for 10 min at 70°C and then were vortexed for 15 min. The extracts were combined and then were brought to 10 mL using a cold methanol/water-extraction mixture.
Determination of the total polyphenol contents
The total polyphenol contents of the tea infusions were determined using Folin-Ciocalteu reagent.[Citation24] A 1-mL aliquot of a sample extract was transferred to a 100-mL volumetric flask using a pipette and was diluted using distilled water. One milliliter of the diluted sample was transferred a tube, mixed with 5 mL of diluted Folin-Ciocalteu reagent, allowed to stand for 3–8 min, and then mixed with 4 mL of a 7.5% sodium carbonate solution. The mixture was incubated for 1 h before spectrometric analysis was performed. Distilled water was used as the blank, whereas gallic acid standards were used for quantification of the total phenol contents. A best-fit linear calibration graph was constructed based on the mass of anhydrous gallic acid present. The total polyphenol contents of the teas were determined based on the absorption at 765 nm.
Determination of the total polysaccharide content
The total polysaccharide contents were determined using the following method:[Citation25] dry ground tea leaves (50 g) were extracted using 400 mL of 90°C distilled water in a water bath for 2 h, after which the extract was filtered, and the residue was extracted again using 500 mL of distilled water for another 2 h. Then, the extracts were combined and were centrifuged to remove contaminants. Finally, the supernatant was concentrated using rotary evaporation, and the total polysaccharides were precipitated using 95% ethanol.
Determination of the catechin and caffeine contents
The catechin and caffeine contents of the extracts were determined using an HPLC system (2695; Waters Corp., MA, USA) equipped with a Waters Sunfire C18 column (5 mm × 4.6 mm × 250 mm) operated at 35°C, with monitoring performed at 278 nm using a 2489 ultraviolet-visible (UV-Vis) detector. The following parameters were used to analysis: flow rate, 1.0 mL/min; injection volume, 10 μL; mobile phase, A = 98% methanol and 2% acetic acid, B = water; gradient elution, 20–25% A, 0–1 min; 25–45% A, 1–12 min; 45–90% A, 12–14.3 min; 90–20% A, 14.3–15 min; maintained for 5 min. The concentrations of the catechins and caffeine were determined based on the areas of their peaks relative to those of standards prepared using authentic compounds.
HS-SPME procedure
In a previous study,[Citation26] the parameters for HS-SPME of the tea samples were optimized and validated; therefore, the same methods and parameters were applied in this study to extract the volatile components of the tea samples. Using the same methods was advantageous for tracing the changes in the contents of aromatic compounds that occurred during processing the tea samples and allowed a comprehensive comparison of the aromatic components of the four different groups of tea samples. A detailed description of the HS-SPME analytical procedure utilized is provided below.
A total of 2.0 g of a ground tea sample was placed in a 20-mL sealed headspace vial containing 5 mL of distilled water, and the temperature of the headspace vial was maintained at 80°C using an electric hot plate. Then, a 65-μm polydimethylsiloxane/divinylbenzene (PDMS/DVB)-coated SPME fiber (Supelco Inc., Bellefonte, PA) was inserted into the sample headspace and was left there for 60 min. All of the volatile compounds that were absorbed by the SPME fiber were desorbed at the GC-MS injector by heating at 250°C for 3.5 min, and then they were immediately analyzed using GC-MS. After adsorption, the SPME coated fiber was transferred to the GC injection port and was heated to 250°C for 30 min.
GC-MS analysis
An HP 7890A GC instrument equipped with an HP 5975C mass selective detector (MSD) quadrupole MS instrument (Agilent Technologies, Palo Alto, CA, USA) was used for GC-MS analysis. The capillary column used was an HP-5MS column (30 m × 0.25 mm × 0.25-μm film thickness) that was purchased from Agilent Technologies, and high-purity helium (99.999% pure) was used as the carrier gas, which was delivered at a flow rate of 1 mL/min. The injector and ion-source temperatures were set to 250 and 200°C, respectively. The samples were loaded using the splitless mode. The initial GC oven temperature was 50°C, which was held for 5 min, increased to 210°C at 3°C/min, held for 3 min, and then increased to 230°C at 15°C/min. The Agilent 5975C MS instrument was operated in the electron-impact (EI) mode using an ionization energy of 70 eV, an ionization-source temperature of 230°C and a quadrupole temperature of 150°C. The full-scan acquisition mode (from 30–500 m/z) was used, and solvent-delay time was 2.8 min.
Compound identification
Using an MSD G1701EA E.02.00.493 chemical workstation data-processing system (Agilent Technologies, Palo Alto, CA, USA), the compounds represented by the observed peaks were identified by searching an NIST 08.L MS data library and comparing their retention indices (RI) with published data.[Citation9,Citation27] The relative percentages of the aromatic components were obtained by normalizing the peak areas. The Kovats retention index for each aromatic compound was calculated using the data obtained by analyzing a homologous series of n-alkanes (C8-C40; Sigma-Aldrich, USA) under the same GC-MS conditions. Each RI was calculated using the following equation:
where tx is the retention time, and n and n + 1 are, respectively, the number of carbon atoms in the alkanes eluted before and after compound X.
Data analysis
Significant differences between the contents of the water-soluble and volatile compounds in the four different groups of green tea samples were determined using an independent-samples t-test using the SPSS statistical package (version 17.0 for Windows, SPSS, Inc., Chicago, IL, USA). PCA and CA were performed using SIMCA-P software (version 12.0, Umetrics, Umea, Sweden). The squared Euclidean distance (SED) was used to calculate the similarities of the samples, and Ward’s minimum variance method was used for amalgamation in CA.
Results and discussion
Sensory evaluation
Sensory evaluation of the tea infusions was conducted. The results showed that the Yunnan and Jiangsu Biluochun infusions had a flower-like flavor and sweet taste, and the Yunnan Biluochun infusions were more bitter and less sweet than the Jiangsu Biluochun infusions. Additionally, both the Yunnan regular green tea infusions and the other regular green tea infusions has a grassy flavor and fresh taste, whereas the other regular green tea infusions had a fresher taste compared with those of the infusions of the other three types of green teas.
Analysis of selected major water-soluble compounds in the different green teas
Polysaccharides, caffeine, and polyphenols, particularly the catechins, are highly soluble in water and have been found to account for most of the taste of tea.[Citation28] shows representative chromatograms demonstrating the separation of the five catechins and caffeine present in the Yunnan Biluochun green teas, Yunnan regular green teas, Jiangsu Biluochun green teas, and the other regular green teas. These three substances affect the quality of teas and increase the approval rating of consumers. The major water-soluble compounds identified in all of the types of teas examined include caffeine, (+)-catechin (C), (-)-epicatechin (EC), (-)-epicatechingallate (ECG), (-)-epigallocatechin (EGC), (-)-epigallocatechin gallate (EGCG), the total polysaccharides, and the total polyphenols. As shown in , it is difficult to discriminate these 24 tea samples based on their contents of these components, although small differences in the contents of the catechins in the Yunnan Biluochun green teas, Jiangsu Biluochun green teas, Yunnan regular green teas and the other regular green teas were observed. The Yunnan Biluochun green teas and the Yunnan other regular green teas had higher levels of (+)-catechin (C) and (-)-epicatechin (EC) compared with those of the Jiangsu Biluochun green teas and the other regular green teas (p < 0.05), and the content of (-)-epigallocatechin gallate (EGCG) in the Yunnan Biluochun green teas differed from that of the Jiangsu Biluochun green teas and the other regular green teas (p < 0.05). These differences might be due to the different types of fresh tea leaves used to produce these teas and the effects of geographical factors on the leaves. However, the contents of the other catechins, polyphenols, caffeine and polysaccharides in these teas were highly similar (p > 0.05). Moreover, as shown in , all 24 samples were distributed in the same quadrant. This result indicated that it is difficult to distinguish among these tea samples. The processing technologies used to produce the other regular green teas were different in different production areas, and although the processing steps conducted, such as the withering, panfiring, rolling, and drying steps, were similar, the parameters of these sub-processes, i.e., the temperature, duration, and humidity level, varied. The cultivar that produced the leaves used to produce the teas and the precise processing technologies applied are thought to be the main causes of the rich flavors of green teas.
Table 1. Contents (mg g−1) and RSD (%) of selected major water-soluble components in various types of tea.
Figure 3. HPLC chromatogram of A: Yunnan Biluochun, B: Yunnan regular green tea, C: Jiangsu Biluochun, and D: other regular green tea. Peak assignments and approximate retention times: (1) EGC, (2) C, (3) EC, (4) EGCG, (5) Caffeine, and (6) ECG.
Figure 4. PCA score derived from water-soluble compounds of 24 tea samples.
Analysis of the volatile compounds in the different types of green teas
HS-SPME/GC-MS was used to detect and identify the volatile compounds in each of the 24 tea samples. Typical total ion chromatograms (TIC) of representative samples are shown in . As shown in , 65 different aromatic compounds were identified in the 24 green tea samples, including 22 hydrocarbon compounds, 18 alcohols, 8 ketones, 6 esters, 3 aldehydes, 3 heterocyclic compounds, 2 nitrogen-containing compounds, 1 lactone, 1 acidic compound, and 1 phenolic compound. Among the volatile compounds that were identified, the alcohols, hydrocarbon compounds and ketones were the major aromatic compounds in the 24 samples (). There were no significant differences (p > 0.05) in the levels of the main volatile compounds (phytol, caffeine, and linalool) in the Yunnan Biluochun green teas and the Jiangsu Biluochun green teas (). As shown in , the following results were obtained: (1) the Yunnan Biluochun green teas and Yunnan regular green teas had higher levels of alcohols (46.50 and 42.52%) than did the Jiangsu Biluochun green teas and the other regular green teas; (2) the Yunnan Biluochun teas and the Jiangsu Biluochun teas had very similar levels of hydrocarbon compounds (12.34 and 12.38%); and (3) the ketone levels of the Yunnan Biluochun teas and the Yunnan regular green teas (9.45 and 9.51%, respectively) were comparable to but were higher than those of the Jiangsu Biluochun green teas (7.77%; p > 0.05).
Table 2. Contents (%) of selected major volatile components in various types of tea.
Figure 5. GC-MS TIC of aroma components in A: Yunnan Biluochun, B: Jiangsu Biluochun, C: Yunnan regular green tea, and D: other regular green tea.
Figure 6. Comparison of volatile components between 24 tea samples.
Twenty-two hydrocarbon compounds were identified in the 24 tea samples, most of which were saturated hydrocarbon compounds, such as hexadecane, heptadecane, 2,6,10,14-tetramethylpentadecane, and 2,6,10,14-tetramethyhexadecane. It has been suggested that saturated hydrocarbons generally have no effect on the flavors of teas, whereas unsaturated hydrocarbons are major contributors to these flavors.[Citation29,Citation30] A relatively higher level of limonene was observed in the Yunnan Biluochun teas (1.10%) and the Jiangsu Biluochun teas (1.18%) than in the Yunnan regular green teas (0.84%) and the other regular green teas (0.21%). Sun et al.[Citation31] found that green tea had a high concentration of limonene. Qiao et al.[Citation27] used gas chromatography-olfactometry (GC-O) to demonstrate that it had an orange fragrance. Of the 18 alcohols identified in the green tea samples, 12 alcohols were common to all of them. Linalool and linalool oxides were the most abundant alcohols in the Yunnan Biluochun green teas (23.65%) and the Yunnan regular green teas (16.24%). Linalool has a rosy fragrance, and linalool oxides have a fruity, floral odor.[Citation29,Citation32–Citation34] In addition, the content of phytol was observed to be higher in the teas produced using Camellia sinensis var. assamica leaves (Yunnan Biluochun green teas: 11.45% and Yunnan regular green teas: 17.82%) than in the teas produced using Camellia sinensis var. sinensis leaves (Jiangsu Biluochun green teas: 7.07% and the other regular green teas: 14.75%). Eight ketones were identified in the 24 tea samples. Geranyl acetone and β-ionone were the most abundant ketones in the Yunnan Biluochun teas, the Jiangsu Biluochun teas, and the Yunnan regular green teas. No significant difference (p > 0.05) was observed in the contents of these ketones in these three types of teas. In contrast, the levels of these ketones in the other regular green teas and the former three types of green teas were significantly different (). The levels of methyl linoleate and methyl linolenate in the Yunnan Biluochun teas (0.30 and 1.38%, respectively), the Jiangsu Biluochun teas (0.19 and 3.64%, respectively), and the Yunnan regular green teas (0.00 and 1.03%, respectively) were lower than those in the other regular green teas (0.90 and 5.38%, respectively). These results suggested that these ketone compounds are very important volatile components of various teas because they provide a special floral and woody odor.[Citation35]
In our previous study,[Citation26] we found that there were clear differences between the volatile compounds in the Yunnan teas produced using Camellia sinensis var. sinensis leaves and the teas produced using Camellia sinensis var. assamica leaves. Analysis of the volatile compounds present and their concentrations revealed that the varieties of the tea plants from which the leaves were derived, the production sites and the climate in which the plants grew were all potential factors that determined the differences among the teas. Therefore, it was reasonable to expect that the aromas of the tea infusions would differ. The volatile components of tea are formed through biological and chemical transformations that occur during tea plant cultivation and tea leaf processing. Although different tea varieties may naturally have different levels of the precursors of volatile compounds, other factors, i.e., the plucking and processing technologies utilized notably affect the volatile compound contents of teas.[Citation36] It is generally accepted that most aromatic compounds form during tea processing and that they are derived from carotenes, amino acids, unsaturated fatty acids,[Citation37] and terpene glycosides.[Citation38] Therefore, it can be concluded that the cultivation sites and the varieties of the tea plants determine which aromatic precursors are present in different tea leaves, whereas the processing technologies utilized to produce teas affect the composition and concentrations of the aromatic substances in the teas, and ultimately, their qualities.
CA of the volatile compounds in the different types of green teas
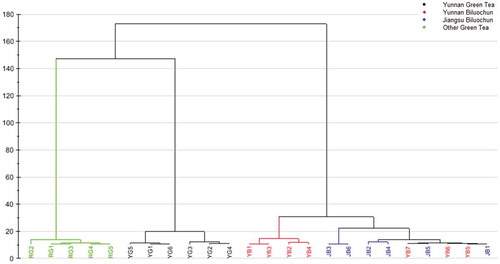
CA can be used to reveal the natural groups existing in a data-set based on the information provided by the measured variables.[Citation39–Citation41] The percentages of the 65 volatile compounds found in the teas were used for CA analysis, and the results were presented in the form of a dendrogram to determine the levels of similarity or diversity of different samples (objects). The objects in the same group would be similar to one another, whereas the objects in different groups would greatly differ. As shown in , although there is a clear division between the Biluochun green teas (YB1-YB7 and JB1-JB6, which were processed using the same technology) and the other regular green teas (YG1-YG6 and RG1-RG5) according to their respective production areas, the Yunnan regular green teas (YG1-YG6) were clustered more closely with the Biluochun green teas than with the other regular green teas.
Figure 7. CA dendrogram of 24 tea samples.
PCA of the volatile compound contents of the different types of green teas
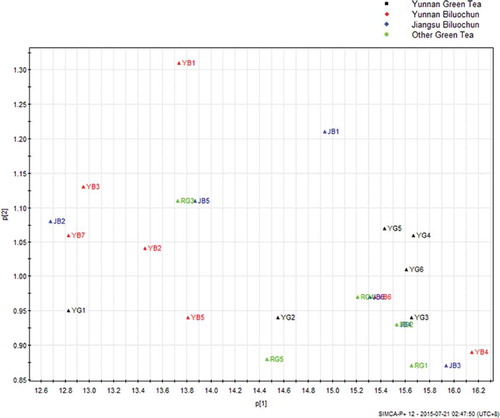
Although the volatile compound compositions of the Biluochun green teas and the other regular green teas from different production places were similar, it is possible to determine the parameters that distinguished among them. PCA is a good method for discriminating among such products.[Citation42] PCA involves the linear transformation of multiple variables into a lower dimensional space that retains the maximal amount of information concerning the variables.[Citation41,Citation43,Citation44] Generally, the score plot provides a visual image of the degrees of similarity of the samples, and the loading plot indicates the effect of different variables represented in the corresponding score plot. PCA ( and ) was performed using the same data used for CA modeling. shows the projection of the score plot for the two first principal components (PC1 and PC2), which accounted for 61.20% of the total variability. As shown in , the 24 tea samples were clearly separate, with YB1-YB7 and JB1-JB6 considered as one cluster because they were closely gathered on one side of the PCA score plot. YG1-YG6 constituted a separate cluster, whereas the rest of the samples (YG1-YG6 and RG1-RG5) were located on the other side of the PCA score plot and were clustered together.
Figure 8. PCA score plots derived from 65 volatile compounds of 24 tea samples.
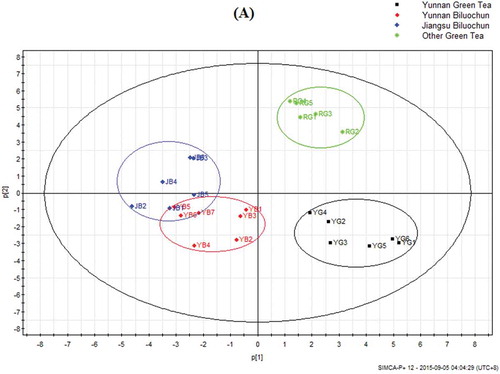
Figure 9. PCA loading plots derived from 65 volatile compounds of 24 tea samples: Red color represents 18 volatile compounds with differences (p < 0.05) in Yunnan Biluochun teas, Jiangsu Biluochun teas, Yunnan regular green teas, and regular green teas based on the results given in .
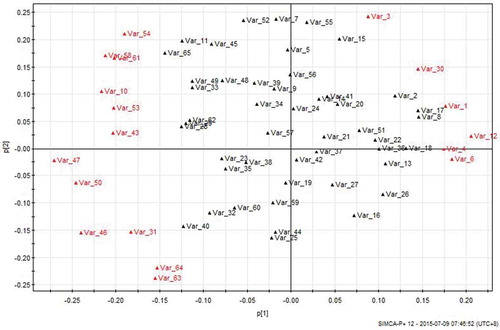
As shown in , the levels of the 18 volatile compounds written in red font were significantly different (p < 0.05) in the Yunnan Biluochun teas, Jiangsu Biluochun teas, Yunnan regular green teas, and other regular green teas based on the results shown in . The loading plot of the 65 volatile compound variables is shown in . This figure shows that different variables had different degrees of contribution to the sample differentiation. As shown in , nerolidol (V46), fluorene (V47), α-cadinol (V50), methyl linoleate (V63), and methyl linolenate (V64) had high positive values for PC1 and mainly affected the discrimination of the Biluochun green tea samples (both the Yunnan Biluochun and the Jiangsu Biluochun green tea samples) from the other green tea samples (both the Yunnan regular green tea samples and the other regular green tea samples). In contrast, 1-pentanol (V1), 6-methyl-5-hepten-2-one (V4), linalool (V12), α-terpineol (V17), and 2,6-dimethoxyphenol (V30) had negative values in PC1 and were mainly considered important compounds for discriminating the green tea samples from the Biluochun samples. Additionally, D-limonene (V6) and dihydroactinidiolide (V44), which had high positive values for PC2, were present at higher concentrations in the teas produced using Camellia sinensis var. sinensis leaves than in the other types of teas. Linalool oxide II (V10), α-calacorene (V45), phytone (V58), and isophytol (V61), which had negative values for PC2, were present at lower levels in the Biluochun samples. These PCA results were highly consistent with the results shown in . The PCA results showed that the compositions of the volatile compounds in the teas that were determined using fully automatic HS-SPME could be used for quality evaluation using CA- and PCA-based statistical models.
Our results showed that although the Yunnan and Fujian Biluochun green teas were produced using leaves obtained in two different areas, in which the plant varieties, climates, and soil properties differed, their aromatic compound contents were highly similar due to use of the same processing technology to produce the teas. The similarity between the aromatic compound contents of the Biluochun teas and their dissimilarity with those of the regular green teas might be attributed to the second rolling and drying steps employed to produce the former teas disrupting the tea leaf cells and mixing various cellular components and the tea juice associated with leaf surfaces being directly exposed to oxygen, thereby changing the condition of the tea leaves.[Citation45] Although the aromatic components of Biluochun teas obtained from different production places were highly similar and could not be clearly discriminated using PCA or CA (–), there were some differences, as described previously. These differences in these tea components might have been caused by differences in the contents of the fresh tea leaves, such as the compositions of their major water-soluble compounds (see ). Even though comparison of the major water-soluble and aromatic compounds in different non-blending green teas, the results of this study revealed that using the same processing technique eliminated the effects of natural factors on the aromas of the teas, resulting in a similar and characteristic aromatic quality. This result is consistent with the conclusions reached by Ravichandran,[Citation37] Takeo,[Citation46] and Mahanta[Citation47] that the tea processing technology employed has a strong effect on the aromatic quality of a tea. Obviously, a good strategy for producing consistent tea product quality characteristics is to standardize the processing technology utilized. A future investigation should focus on the effects of the different tea-processing steps on the formation of tea aromatic components. Additionally, to provide suggestions regarding quality control, we will also explore changes in the qualities of the teas examined in this study that are caused by using different processing technologies.
Conclusions
This study is the first to demonstrate that the tea processing technology used is one of the main factors affecting the aromas of the teas produced using the leaves of different tea cultivars. Our results demonstrated that it is hard to distinguish among Yunnan Biluochun green teas, Jiangsu Biluochun green teas, Yunnan regular green teas, and other regular green teas based merely on a sensory evaluation and the composition of their major water-soluble compounds. The volatile component compositions of the Yunnan Biluochun green teas were highly similar to those of the Jiangsu Biluochun green teas, whereas those of the Biluochun green teas and the other regular green teas were dissimilar. The results of CA and PCA also showed that the Biluochun teas were highly similar, whereas the other regular green teas, which were produced in different regions, had their own specific characteristics. The volatile compound contents of the Yunnan regular green teas and the other regular teas were much different from those of the Biluochun teas. These results indicated that the aromatic characteristics of teas might be closely associated with the processing technology utilized to produces them. The effects of the processing technologies utilized on the same teas and different types of teas will be investigated in the future.
Funding
This work was supported by the National Natural Science Foundation of China (No. 31460228) and scientific research funds in Yunnan Province Department of Education (No. 2014Y089).
Additional information
Funding
References
- Gortner, R.A. The Origin of the Custom of Tea Drinking in China. Science 1918, 47, 269–270.
- Yuan, G.; Zhang, X.; Tang, W.; Sun, Y. Effect of Chitosan Coating Combined with Green Tea Extract on the Melanosis and Quality of Pacific White Shrimp During Storage in Ice. CyTA–Journal of Food 2015, 14, 35–40.
- Cabrera, C.; Artacho, R.; Giménez, R. Beneficial Effects of Green Tea—A Review. Journal of American College of Nutrition 2006, 25, 79–99.
- Hill, S. Preliminary Study Using Trace Element Concentrations and a Chemometrics Approach to Determine the Geographical Origin of Tea. Journal of Analytical Atomic Spectrometry 1998, 13, 521–525.
- Tian, S.Y.; Deng, S.P.; Chen, Z.X. Multifrequency Large Amplitude Pulse Voltammetry: A Novel Electrochemical Method for Electronic Tongue. Sensors and Actuators B-Chemical 2007, 123, 1049–1056.
- Fernández-Cáceres, P.L.; Martin, M.J.; Pablos, F.; González, A.G. Differentiation of Tea (Camellia Sinensis) Varieties and Their Geographical Origin According to Their Metal Content. Journal of Agriculture and Food Chemistry 2001, 49, 4775–4779.
- Narukawa, M.; Noga, C.; Ueno, Y.; Sato, T.; Misaka, T.; Watanabe, T. Evaluation of the Bitterness of Green Tea Catechins by a Cell-Based Assay with the Human Bitter Taste Receptor hTAS2R39. Biochemical and Biophysical Research Communications 2001, 405, 620–625.
- Lv, S.D.; Wu, Y.S.; Song, Y.Z.; Zhou, J.S.; Lian, M.; Wang, C.; Meng, Q.X. Multivariate Analysis Based on GC-MS Fingerprint and Volatile Composition for the Quality Evaluation of Pu-erh Green Tea. Food Analytical Methods 2015, 8(2), 321–333.
- Pang, X.; Qin, Z.; Zhao, L.; Cheng, H.; Hu, X.; Song, H.; Wu, J. Development of Regression Model to Differentiate Quality of Black Tea (Dianhong): Correlate Aroma Properties with Instrumental Data Using Multiple Linear Regression Analysis. International Journal of Food Science and Technology 2012, 47, 2372–2379.
- Lv, H.P.; Dai, W.D.; Tan, J.F.; Guo, L.; Zhu, Y.; Lin, Z. Identification of the Anthocyanins from the Purple Leaf Coloured Tea Cultivar Zijuan (Camellia Sinensis Var. Assamica) and Characterization of Their Antioxidant Activities. Journal of Functional Foods 2015, 17, 449–458.
- Huo, D.; Wu, Y.; Yang, M.; Fa, H.; Luo, X.; Hou, C. Discrimination of Chinese Green Tea According to Varieties and Grade Levels Using Artificial Nose and Tongue Based on Colorimetric Sensor Arrays. Food Chemistry 2014, 145, 639–645.
- Willson, K.C.; Clifford, M.N. Tea: Cultivation to Consumption. Ecology of Freshwater Fish 1992, 5(4), 175–182.
- Zhu, Y.F.; Chen, J.J.; Ji, X.M. Changes of Major Tea Polyphenols and Production of Four New B-Ring Fission Metabolites of Catechins from Post-Fermented Jing-Wei Fu Brick Tea. Food Chemistry 2015, 170, 110–117.
- Nie, S.P.; Xie, M.Y.; Nie, S.P. A Review on the Isolation and Structure of Tea Polysaccharides and Their Bioactivities. Food Hydrocolloid 2011, 25, 144–149.
- Rawat, R.; Gulati, A.; Babu, G.K.; Acharya, R.; Kaul, V.K.; Singh, B. Characterization of Volatile Components of Kangra Orthodox Black Tea by Gas Chromatography-Mass Spectrometry. Food Chemisry 2007, 105, 229–235.
- Togari, N.; Kobayashi, A.; Aishima, T. Pattern Recognition Applied to Gas Chromatographic Profiles of Volatile Components in Three Tea Categories. Food Research International 1995, 28, 495–502.
- Hara, Y.; Luo, S.; Wickremasinghe, R.L.; Yamanishi, T. Flavor of Tea. Food Research International 1995, 11, 477–525.
- Cheng, H.; Chen, J.; Chen, S.; Wu, D.; Liu, D.; Ye, X. Characterization of Aroma-Active Volatiles in Three Chinese Bayberry (Myrica Rubra) Cultivars Using GC-MS-Olfactometry and an Electronic Nose Combined with Principal Component Analysis. Food Research International 2015, 72, 8–15.
- Cheng, H.; Chen, J.; Li, X.; Pan, J.; Xue, S.J.; Liu, D.; Ye, X. Differentiation of the Volatile Profiles of Chinese Bayberry Cultivars During Storage by HS-SPME–GC/MS Combined with Principal Component Analysis. Postharvest Biology and Technology 2015, 100, 59–72.
- Moreda-Pineiro, A.; Fisher, A.; Hill, S.J. The Classification of Tea According to Region of Origin Using Pattern Recognition Techniques and Trace Metal Data. Journal of Food Compositon and Analysis 2003, 16, 195–211.
- Huang, Q.; Chen, S.; Chen, H.; Wang, Y.; Wang, Y.; Hochstetter, D.; Xu, P. Studies on the Bioactivity of Aqueous Extract of Pu-Erh Tea and Its Fractions: In Vitro Antioxidant Activity and α-Glycosidase Inhibitory Property, and Their Effect on Postprandial Hyperglycemia in Diabetic Mice. Food and Chemical Toxicology 2013, 53, 75–83.
- Ye, N.; Zhang, L.; Gu, X. Discrimination Of Green Teas from Different Geographical Origins by Using HS-SPME/GC–MS and Pattern Recognition Methods. Food Analytical Methods 2012, 5, 856–860.
- Wu, Q.J.; Dong, Q.H.; Sun, W.J.; Huang, Y.; Wang, Q.Q.; Zhou, W.L. Discrimination of Chinese Teas with Different Fermentation Degrees by Stepwise Linear Discriminant Analysis (S-LDA) of the Chemical Compounds. Journal of Agricultural and Food Chemistry 2014, 62(38), 9936–9944.
- Turkmen, N.; Sari, F.; Velioglu, Y.S. Effects of Extraction Solvents on Concentration and Antioxidant Activity of Black and Black Mate Tea Polyphenols Determined by Ferrous Tartrate and Folin-Ciocalteu Methods. Food Chemistry 2006, 99, 835–841.
- Xi, X.G.; Wei, X.L.;Wang, Y.F. Determination of Tea Polysaccharides in Camellia Sinensis by a Modified Phenol-Sulfuric Acid Method. Archives of Biological Sciences 2010, 62, 671–678.
- Lv, S.D.; Wu, Y.S.; Li, C.; Xu, Y.; Liu, L.; Meng, Q.X. Comparative Analysis of Pu-Erh and Fuzhuan Teas by Fully Automatic Headspace Solid-Phase Microextraction Coupled with Gas Chromatography–Mass Spectrometry and Chemometric Methods. Journal of Agriculture and Food Chemistry 2014, 62, 1810–1818.
- Qiao, Y.; Xie, B.J.; Zhang, Y.; Zhang, Y.; Fan, G.; Yao, X.L.; Pan, S.Y. Characterization of Aroma Active Compounds in Fruit Juice and Peel Oil of Jinchen Sweet Orange Fruit (Citrus Sinensis (L.) Osbeck) by GC-MS and GC-O. Molecules 2008, 13, 1333–1344.
- Vickers, Z.; Holton, E. A comparison of Taste Test Ratings, Repeated Consumption, and Postconsumption Ratings of Different Strengths of Iced Tea1. Journal of Sensors Study 2007, 13, 199–212.
- Alasalvar, C.; Topal, B.; Serpen, A.; Bahar, B.; Pelvan, E.; Gökmen, V. Flavor Characteristics of Seven Grades of Black Tea Produced in Turkey. Journal of Agricultural and Food Chemistry 2012, 60(25), 6323–6332.
- Toldrá, F.; Flores, M.; Sanz, Y. Dry-Cured Ham Flavour: Enzymatic Generation and Process Influence. Food Chemistry 1997, 59, 523–530.
- Sun, M.F.; Guo, G.Y.; Zhang, J. Analysis of Aroma Quality of Steamed Green Tea and Roasted Xinyang Maojian Tea by GC-MS. Journal of Food Science 2014, 35, 151–155.
- Joshi, R.; Gulati, A. Fractionation and Identification of Minor and Aroma-Active Constituents in Kangra Orthodox Black Tea. Food Chemistry 2015, 167, 290–298.
- Schuh, C.; Schieberle, P. Characterization of the Key Aroma Compounds in the Beverage Prepared from Darjeeling Black Tea: Quantitative Differences Between Tea Leaves and Infusion. Journal of Agriculture and Food Chemistry 2006, 54, 916–924.
- Wang, L.F.; Lee, J.Y.; Chung, J.O.; Baik, J.H.; So, S.; Park, S.K. Discrimination of Teas with Different Degrees of Fermentation by SPME-GC Analysis of the Characteristic Volatile Flavour Compounds. Food Chemistry 2008, 109, 196–206.
- Zheng, H.; Li, J.L.; Li, H.H. Analysis of Trace Metals and Perfluorinated Compounds in 43 Representative Tea Products from South China. Journal of Food Science 2014, 79, C1123–C1129.
- Selena, A.; John, R.S.; Colin, O.; Timothy, G.; Corene, M.; Albert, R.; Sean, C.; Dayuan, X.; Chunlin, L.;Uchenna, U.; Sarabeth, B.; David, S.; Edward, K. Effects of Extreme Climate Events on Tea (Camellia Sinensis) Functional Quality Validate Indigenous Farmer Knowledge and Sensory Preferences in Tropical China. Plos One 2014, 9(10), e109126–e109126.
- Ravichandran, R.; Parthiban, R. Lipid Occurrence, Distribution and Degradation to Flavour Volatiles During Tea Processing. Food Chemistry 2000, 68, 7–13.
- Takeo, T. Production of Linalol and Geraniol by Hydrolytic Breakdown of Bound Forms in Disrupted Tea Shoots. Phytochemistry 1981, 20, 2145–2147.
- Zielinski, A.A.F.; Haminiuk, C.W.I.; Alberti, A. A Comparative Study of the Phenolic Compounds and the in Vitro Antioxidant Activity of Different Brazilian Teas Using Multivariate Statistical Techniques. Food Research International 2014, 60, 246–254.
- Chen, Y.; Zhu, S.B.; Xie, M.Y.; Nie, S.P.; Liu, W.; Li, C.; Gong, X.F.; Wang, Y.X. Quality Control and Original Discrimination of Ganoderma Lucidum Based on High-Performance Liquid Chromatographic Fingerprints and Combined Chemometrics Methods. Analytic Chimica Acta 2008, 623, 146–156.
- Wu, S.B.; Dastmalchi, K.; Long, C.; Kennelly, E.J. Metabolite Profiling of Jaboticaba (Myrciaria Cauliflora) and Other Dark-Colored Fruit Juices. Journal of Agriculture and Food Chemistry 2012, 60, 7513–7525.
- Ivosev, G.; Burton, L.; Bonner, R. Dimensionality Reduction and Visualization in Principal Component Analysis. Analytical Chemistry 2008, 80, 4933–4944.
- Ma, C.; Dastmalchi, K.; Flores, G.; Wu, S.B.; Pedraza-Peñalosa, P.; Long, C.; Kennelly, E.J. Antioxidant and Metabolite Profiling of North American and Neotropical Blueberries Using LC-TOF-MS and Multivariate Analyses. Journal of Agriculture and Food Chemistry 2013, 61, 3548–3559.
- Wu, S.B.; Meyer, R.S.; Whitaker, B.D.; Litt, A.; Kennelly, E.J. A New Liquid Chromatography–Mass Spectrometry-Based Strategy to Integrate Chemistry, Morphology, and Evolution of Eggplant (Solanum) Species. Journal of Chromatography A 2013, 1314, 154–172.
- Yang, Z.; Baldermann, S.; Watanabe, N. Recent Studies of the Volatile Compounds in Tea. Food Research International 2013b, 53, 585–599.
- Takeo, T. Withering Effect on the Aroma Formation Found During Oolong Tea Manufacturing. Agricultural & Biological Chemistry 1984, 48(4), 1083–1085.
- Mahanta, P.K.; Baruah, S. Relationship Between Process of Withering and Aroma Characteristics of Black Tea. Journal of the Science of Food & Agriculture 2006, 46(4), 461–468.