
 ?Mathematical formulae have been encoded as MathML and are displayed in this HTML version using MathJax in order to improve their display. Uncheck the box to turn MathJax off. This feature requires Javascript. Click on a formula to zoom.
ABSTRACT
To study the aroma features of different varieties of honey, five honey samples from different botanical origins were characterized by sensory evaluation, gas chromatography-mass spectrometry and electronic nose analysis. The sensory evaluation results gave a good reflection of the honey’s different aroma characteristics. A total of 55 volatile compounds were identified by headspace solid-phase micro-extraction followed by gas chromatography-mass spectrometry, and among these compounds, 13 were found in all of the honey samples. A number of differences were observed in the composition of volatile components from the five types of honey. Twenty-two compounds were selected as typical odor-active compounds which co-varied well with the five sensory attributes by partial least squares regression. The correlation results between the sensory profiles and electronic nose data showed that the electronic nose could give comparable results in predicting the sensory attributes of honey. In conclusion, the combination of sensory evaluation, gas chromatography-mass spectrometry analysis of volatile compounds, and electronic nose data with partial least squares regression analysis could be applicable for the overall analysis of aroma features for honey.
Introduction
Honey is a naturally sweet substance that is produced by bees using flower nectar or honeydew from plants, combined with the bees’ own secretions. As a natural food, honey exerts the potential health benefits of improving the immunity system, promoting digestion and absorption, calming nerves, and promoting growth in children. Honey contains a diverse group of bioactive substances, including fructose, glucose, vitamins, flavonoids, acids, proteins, minerals, and flavor-inducing substances.[Citation1] In addition, honey has attractive chemical properties, and it has a distinctive flavor and aroma that leads many people to prefer it to sugar or other sweeteners. Therefore, honey is widely used in food processing methods such as baking or yogurt manufacturing.[Citation2]
The aroma of honey is one of its most typical features,[Citation3] and consumers often determine their selection of honey products according to it. Volatile compositions are the main factors responsible for aroma which, together with other factors such as taste and physical factors, contribute to the flavor.[Citation4] These compositions determine the specific nature of honey samples, and, therefore, contribute to consumer preferences among the many types of honey. Generally, honey is classified by the floral source of the nectar from which it was made. Distinctive flavors and aroma features were found among different honey types because of their different origins and characteristic volatile compositions. For example, aroma extract dilution analysis has shown that the characteristic aroma components of buckwheat honey are 3-methylbutanal, sotolon, and β-damascenone,[Citation5] whereas the markers of linden tree honey are 4-tert-butylphenol, an unidentified isomer of ethylmethylphenol, estragole, menthol, methyl (1-methylethenyl) benzene, p-methylacetophenone, 8-p-menthen-1,2-diol, carvacrol, and thymol.[Citation6]
Sensory evaluation is traditionally used to determine the aroma features. Such evaluation is usually performed by a panel of trained tasters, who have developed a language of their own to describe various features of honey. Although this method is conventional and irreplaceable, it also has its limitations. The method is time-consuming, and it is easily influenced by the tasters’ physiological and psychological traits.[Citation7,Citation8] Over the past several decades, various analytic methods have been used to study the characteristics of honey aroma to overcome the previously described deficiencies of sensory evaluation. Sensory evaluation of honey aromas is now usually supplemented by gas chromatography-mass spectrometry (GC-MS),[Citation9] electronic nose technology,[Citation10] or both of these analytic systems.[Citation11]
GC-MS has the ability to separate, detect and identify volatile compounds, and it has been widely used for various purposes in honey research. This technique has been successfully applied for assessing the marker compounds in honey,[Citation4] and to characterize or authenticate the aromatic profiles of honey.[Citation12] However, this technique requires that the volatile compounds must be isolated from the sugars and water which are the primary ingredients of honey. Most importantly, the analysis provided by GC-MS might not always be reliable, because the flavors of honey result from complex interactions between multiple ingredients.
As an effective method to complement sensory evaluation and GC-MS, the electronic nose has become a trusted technology for the analysis of food flavor. The electronic nose does not provide qualitative or quantitative results concerning the components in the sample, but it can be used to successfully monitor and differentiate products. This method has been applied in the analysis of various food products such as meats,[Citation13] drinks,[Citation14] fruits,[Citation15,Citation16] and agricultural products.[Citation17] Recently, the electronic nose has begun playing a significant role in the analysis of honey aromas. Many researchers found that this method was effective for determining the geographical and botanical origins of honey samples. Frane et al.[Citation18] analyzed the aroma profiles of honey samples having the same botanical but different geographical origins by using the electronic nose, along with principal component analysis. Huang et al.[Citation19] used the electronic nose with least squares support vector machines to both identify the botanical origins and determine the main quality components of 14 honey samples. The overall accuracy of the origin discrimination models showed that the electronic nose system performed well in predicting the quality of honey.
Recently, multivariate statistical methods have been used to explore the relationships between sensory profiles and volatile compounds. These methods include principal component analysis, cluster analysis and partial least squares regression (PLSR).[Citation20] However, despite these advances in analytical methods of honey, there are few systematic reports on the relationships between honey samples, sensory attributes, and odor-active compounds.
Given the lack of existing information in this area, the aim of this study was to analyze the volatile compounds in five different honey samples by sensory evaluation, solid phase microextraction gas chromatography-mass spectrometry (SPME/GC-MS) and electronic nose analysis, and investigate the relationship between the aroma features and volatile compounds. PLSR was used to establish the correlations between the honey samples, sensory attributes, and the volatile compounds to identify the contribution of volatile compounds to the samples’ sensory attributes. The relationships between sensory attributes and electronic nose data were also analyzed through PLSR.
Materials and methods
Five different floral sources of honey (H1: Milk vetch honey, H2: Linden tree honey, H3: Acacia honey, H4: Loquat honey, and H5: Zaohua honey) were purchased from a supermarket in Shanghai. All the production dates of honey samples were within 1 month and taken from different botanical origins in China. Samples were all stored at room temperature and kept sealed before analysis. All of the samples were analyzed by sensory evaluation, GC-MS, and electronic nose. 2-Octanol (internal standard) and n-alkane standards (C7-C30) were purchased from Sigma-Aldrich Chemical Co. (St. Louis, MO).
Sensory evaluation
Sensory evaluation was determined following the method reported by Castro-Vázquez et al.[Citation21] The experiment was carried out in a sensory laboratory that conformed to ISO 8589 standards.[Citation22] A 15-member sensory panel (eight males/seven females, aged from 26 to 39 years) was recruited, and sensory training was carried out prior to the sensory experiment. At preliminary conference, evaluators were trained in descriptive sensory analysis. Then they generated descriptors individually over the course of numerous sessions. A monadic sequential profile test was run with a score scale of 10, in accordance with the method used by Qin et al.[Citation23] The sensory score criteria were defined as follows: 0–2, very weak; 2–4, fairly weak; 4–6, neither weak nor strong; 6–8, fairly strong; and 8–10, very strong. Five sensory attributes, namely fresh, sweet, mellow, fruity, and fermented, were developed to describe the main/fundamental aroma attributes of honey. The honeys mentioned previously were introduced at room temperature in 40 mL glass bottles sealed with a twist-off to produce a sufficient headspace. All coded honey samples were delivered to each evaluator randomly. Honey samples were evaluated in duplicate by each evaluator.
SPME/GC-MS analysis
SPME/GC-MS technology was used for extracting and analysing the volatile compounds in the five honey samples. Divinylbenzene/Carboxen/polydimethylsiloxane (DVB/CAR/PDMS, 50/30 μm, Supelco Inc. Bellefonte, PA) was selected as the SPME fiber for volatile compound extraction. A GC system (model 7890, Agilent Technologies, Santa Clara, CA, USA) coupled to a MS detector (model 5975, Agilent Technologies) was used for the separation and detection analyses. An HP-INNOWAX fused-silica capillary column (60 m × 0.25 mm ID, 0.25 μm film thickness) was used to perform the chromatographic separations. For each analysis, 4 g (accurate to 0.1 mg) of sample and 1 g of a saturated sodium chloride solution containing 30 μL 2-octanol (added for retention-time correction) were placed in a 15-mL vial and conditioned at 70°C for 10 min under agitation to allow equilibration. Subsequently, the solid-phase material was exposed to the sample’s headspace for 30 min. After the extraction, the bound analytes were desorbed from the fiber in the GC inlet at 250°C for 5 min. Helium was used as the carrier gas at a flow rate of 1 mL/min. The temperature program was initially set at 50°C for 2 min, followed by an increase of 4°C/min to 230°C, and then 230°C isothermally for 10 min. The GC-MS was performed with an ion source temperature of 230°C, an ionization voltage of 70 eV, a quadruple rod temperature of 150°C and a mass range of 30-450 m/z. All of these analyses were carried out in triplicate.
The volatile compounds were identified by matching the mass spectra with those listed in the Wiley Registry of Mass Spectral Data (Wiley, 7th Edition Library for Mass Spectrometry), G1035B (Agilent Technologies) and the NIST 98 Mass Spectra Library, and by comparing the linear retention indices (RI) of authentic reference compounds with the values of volatile compounds in samples. The RI was calculated by comparison with a homologous series of n-alkanes (C7-C30) and their references.[Citation24] To quantify the volatiles, the relative concentrations were calculated according to the internal standard (2-octanol) as follows:
where C(x) is the concentration of each volatile compound (mg/kg), C(s) is the concentration of internal standard (μg/mL), V(x) is the volume of internal standard (μL), A(x) is the peak area of identified compounds and A(s) is the peak area of internal standard, and m is the weight of honey sample (g).
Electronic nose measurements
All of the samples were analyzed by the electronic nose system (model FOX400, Alpha MOS, Toulouse, France) for their odor profile descriptions. The instrument is composed of a sampling apparatus, a detection system, and a data processing system. The detection system consists of 18 metal-oxide semiconductors (MOS), which are enclosed in three controlled-temperature chambers:[Citation25] sensor chamber A (T30/1, P10/1, P10/2, P40/1, T70/2, PA/2); sensor chamber B (P30/1, P40/2, P30/2, T40/2, T40/1, TA/2); and sensor chamber CL (LY2/LG, LY2/G, LY2/AA, LY2/GH, LY2/gCTl, LY2/gCT). A purified air generator with a CaCl2 post-dehydration column was used to provide clean, dry air to the system.
Each sample was put into a 50°C water bath before the experiment and then cooled to room temperature when completely melted. The isolation of the volatile compounds of five honeys was carried out using an extraction technique modified from a previously literature method.[Citation26] Briefly, the samples (3 g each, accurate to 0.1 mg) were placed in 10 mL Pyrex vials equipped with pierceable silicon/Teflon caps, and separately equilibrated for 10 min at 70°C under agitation at a speed of 500 rpm. The headspace gas above the sample was introduced into the electronic nose for 9 s at a speed of 150 mL min−1. The honey sample headspace was pumped over the sensor surfaces for 120 s to achieve stable signals. The acquisition period was 1 s. The system was purged with processed dry and pure air prior to the next sample. Each analysis was repeated five times, and all of the response data were analyzed by the built-in software (Alpha Soft, version 3.0.0, Toulouse, France) of the electronic nose system.
Statistical data analysis
Significant differences among the five sensory attributes () and the concentration of each compound in five samples () were assessed by analysis of variance (ANOVA) to determine if a statistical difference existed at p < 0.05. Also, Duncan’s multiple-range tests were used to identify the differences among individual samples for each sensory attribute. All of these statistical analyses were conducted by SAS software version 8.2 (SAS Institute Inc., Cary, USA). The correlations between the sensory analyses, the GC-MS profiles and the electronic nose responses were analyzed by PLSR using Unscrambler, version 9.7 (CAMO, Norway). All of the variables were centred and standardized, such that each variable had a unit variance and zero mean before applying the PLSR analysis. All of the PLSR models were validated by using full cross-validation.
Table 1. The sensory evaluation results (Mean ± standard deviation) of five different honey.
Table 2. Volatile compounds in the five honey samples (mg kg−1, n = 3) identified by SPME/GC-MS.
Results and discussion
Sensory evaluation of honey samples
The aroma features of the five honey samples were described by five sensory attributes, and the results of the sensory analysis are shown in . ANOVA analysis indicated that the sensory attributes of the five samples were all significantly different (p < 0.05). Duncan’s multiple comparison test results () revealed that the fresh, sweet, mellow, and fruity attributes had the most significant differences, followed by the fermented attribute. Therefore, the five attributes seemed well-suited to explain the aromatic characteristics of the different samples. As shown in , H1 had the highest fresh and mellow scores; H3 obtained the highest scores for the fruity flavor; and H4 had the strongest sweet flavor. H2 showed intermediate intensities in all of the sensory attributes. Notably, H5 was significantly different from H1 and H4 in all of the five attributes. H5 showed the highest score in the fermented attribute, and the lowest scores in the other four attributes. These sensory evaluation results indicated that the different honey samples had very distinctive flavor characteristics.
Composition of volatile components in the honey samples
The total ion current (TIC) chromatogram for the five honey samples (as obtained at the optimal SPME conditions) is shown in . Even without detailed analysis, it can be seen that the profiles of volatiles obtained for the different samples have a certain similarity, although differences between the honey types can also be observed. The concentrations of each volatile compound detected by GC-MS, the odor descriptions and the RI values of the five honey samples are presented in .
Figure 1. TIC profiles for five honey samples fractionated by SPME using DVB/CAR/PDMS fiber coating.
A total of 55 volatile compounds were detected, including alcohols (13), aldehydes (11), acids (10), esters (9), ketones (4), heterocyclic compounds (3), phenols (3), and alkane compounds (2). In comparing the tested samples, it is noteworthy that 13 of the volatile constituents were detected in every sample. These common constituents were ethanol, 2-methyl-1-propanol (wine, solvent, bitter), 1-butanol (medicinal, phenolic), 3-methyl-1-butanol (fusel, alcohol, sweet, fruity), 2,3-butanediol (burning), ethyl acetate (pineapple), ethyl lactate (fruit), acetaldehyde (pungent ether), furfural (bread, almond, sweet), 2-phenylacetaldehyde (hawthorne, honey, sweet), 2-octanone (floral and bitter, green, fruity), acetic acid (sour, vinegar) and 2-acetylfuran (coffee-like). Among these compounds, ethanol, 1-butanol, 2,3-butanediol, ethyl acetate, furfural, 2-phenylacetaldehyde and acetic acid had previously been found in the volatile fractions of honey from other botanical sources.[Citation27,Citation28] However, 2-methyl-1-propanol, 3-methyl-1-butanol, ethyl lactate, 2-octanone, and 2-acetylfuran were first detected in this experiment’s honey samples.
It is logical that honeys with different botanical origins would have some elements in common. However, there are some obvious differences between the honey samples from different botanical sources, which can be attributed to the nectar of different plants. A compound may be considered to be a marker in cases where it is only present in one sample. In this study, however, 5 (2-ethylhexanol, vinylacetate, bis(2-ethylhexyl)adipate, octanol and isoprene), 9 (leaf alcohol, 2-(4-methylphenyl)propan-2-ol, 2-bornanol, 2-phenyl-2-butenal, 2-pentanone, 6-octenoic acid,3,7-dimethyl-, geranic acid, cyclohexene,3,3,5-trimethyl- and carvacrol), 2 (anisaldehyde and hexanoic acid), 1 (ethyl hydrogen oxalate), and 5 (ethyl-2-methylbutyrate, ethyl 3-methylbutyrate, sarcolactic acid, isovaleric acid and propylmalonic acid) volatile compounds were found only in H1, H2, H3, H4, and H5, respectively.
As shown in , a total of 13 alcohols, which was the largest group of compounds found in this study, were detected in five honey samples. Total concentrations of 1.506, 0.609, 1.057, 0.968, and 0.156 mg/kg were detected in H1, H2, H3, H4, and H5, respectively. It is in accordance with previous study that the volatile constituents varied significantly among honey samples from different botanical origins.[Citation29] Notably, the content of alcohol in H5 was much lower than that in the other samples. Among these types of alcohol, the most abundant was ethanol. The content of this compound was greater than the sum of all the other alcohols. In addition, 2-ethylhexanol was only detected in H1, and leaf alcohol, 2-(4-methylphenyl)propan-2-ol and 2-bornanol were present only in H2. The 2-phenylethanol (flowery, rose, honey) have been previously reported as a key aroma compound of honey,[Citation30] but it was not detected in H5 at all.
Aldehydes and ketones are characterized by their intense flavors, even when they are present at low concentrations.[Citation31] Among the group of aldehydes, the content of furfural (sweet) was much higher than the others in all five honey samples, which corresponded to the TIC chromatograms shown in . Concerning the other aldehydes, octanal was found only in H1; 2-phenyl-2-butenal was found only in H2; and anisaldehyde was detected only in H3. 2-phenylacetaldehyde was present in the whole set of analyzed honey samples, and benzaldehyde was detected in four of the samples (H1, H2, H3, and H5). These two compounds both have a pleasant aroma,[Citation28,Citation32] but their content levels in the tested samples differed greatly. For instance, the content of 2-phenylacetaldehyde in H2 (0.134 mg/kg) was 18 times higher than that detected in H3 (0.007 mg/kg). With regard to ketones, the individual concentrations of different ketones in each sample differed greatly, but the total of ketone contents was similar for all samples. The 2-octanone was ubiquitous in all honey samples, but 2-pentanone was present only in H2.
Esters are mainly produced through esterification of acid and alcohol compounds, and many aliphatic esters contribute to the characteristic smells of fruits and flowers.[Citation33] As shown in , there were nine esters identified, including ethyl hydrogen oxalate, ethyl acetate, ethenyl ethanoate, ethyl-2-methylbutyrate, ethyl 3-methylbutyrate, ethyl lactate, ethyl benzoate, γ-valerolactone, and bis(2-ethylhexyl) adipate. However, the concentrations of esters were relatively lower than those of alcohols or aldehydes in all of the honey samples. Only ethyl acetate and ethyl lactate were present in every sample. The values of esters ranged from 0.017 to 0.156 mg/kg for ethyl acetate and from 0.002 to 0.047 mg/kg for ethyl lactate. Two compounds with a fruity aroma, ethyl-2-methylbutyrate and ethyl 3-methylbutyrate, were detected only in sample H5.
A total of 10 acids were detected in the surveyed honey samples, and these acids accounted for 18% of the total volatile compounds. Reportedly, the lengths of the carboxylic acid carbon chains provide the different flavors that can range from spicy to rancid. The short chain carboxylic acids, such as acetic acid, have a spicy aroma and flavor, but the butanoic and hexanoic acids that are present in butter provide a rancid aroma.[Citation34] In this study, acetic acid (0.040–0.140 mg/kg) was the main acid quantified in all of the samples, which coincided with the results of Moniruzzaman et al.[Citation35] Butanoic acid, with its cheese-like aroma, existed only in samples H3 and H5. Small amounts of 6-octenoic acid, 3,7-dimethyl- and geranic acid were detected in H2. These acids have flavors that can be described as green-grassy and sweet, respectively.
Three heterocyclic compounds were quantified in this study, but only 2-acetylfuran was detected in every honey sample. Dimethyl disulfide has been reported as the characteristic marker of rape honey.[Citation4] However, in our study it was also detected in linden tree honey and acacia honey. Two alkane compounds and three phenols were found in the tested honey samples, but isoprene was detected only in H1, and cyclohexene, 3,3,5-trimethyl- was detected only in H2. Carvacrol has been reported as the marker of linden tree honey,[Citation4] and our study indeed detected it in H2.
Relationships between honey samples, sensory data, and GC/MS variation
The relationships between sensory variables and volatile compounds were established by PLSR, a multivariate technique that has been widely used to determine correlations between sensory and GC data sets.[Citation36,Citation37] For our study, the X-matrix was designed as the list of 55 volatile compounds, and the Y-matrix was designed as the sensory attribute scores along with the five samples. As shown in , the derived PLSR model explained 64% of the variance in X (volatile compounds) and 68% of the variance in Y (the sensory attributes and honey samples). The resultant loading plots of PC1 and PC2 showed that all of the five sensory attributes and all volatile compositions, except for 1-pentanol, 2,3-butanediol, ethyl benzoate, 2-acetylfuran and phenol, 4-methyl-, appeared between the two ellipses. Therefore, the volatile compounds between the two ellipses can be considered as correlated with the sensory attributes, and those compounds inside the inner ellipse are regarded as poorly connected with the sensory attributes.
Figure 2. PLSR correlation loading plot of sensory attributes and volatile compounds identified by GC-MS from different honey samples. The model was derived from volatile compounds data as the X-matrix and sensory attributes and honey samples as the Y-matrix. Elipses represent R2 = 0.5 and 1.0, respectively.
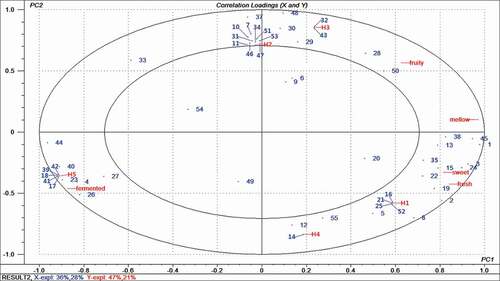
The sweet and fresh attributes were correlated with sample H1 and with 1-propanol, 2-methyl-1-propanol, ethyl acetate, 2,3-pentanedione, ethyl lactate, acetaldehyde, and hexanal. The fermented attribute had a strong correlation with the H5 sample, and this finding was in agreement with the sensory results. The fermented attribute had a greater association with certain identified compounds, such as 1-butanol, ethyl-2-methylbutyrate, ethyl 3-methylbutyrate, 3-methyl-butanal, 1-nonanal, furfural, sarcolactic acid, butyric acid, isovaleric acid, and propylmalonic acid. Among these compounds, four were acids, which meant that acids contributed greatly to the fermented flavor.[Citation38] The mellow attribute was significantly correlated to ethanol, acetic acid, and nonanoic acid. Benzaldehyde and 2,5-furandicarboxaldehyde made a positive contribution to the fruity attribute, and these were previously identified as the active aroma compounds for fruity notes. H2 did not have the highest score in any sensory attribute. However it co-varied with ten compounds, namely leaf alcohol, 2-(4-methylphenyl)propan-2-ol, 2-bornanol, 2-phenylacetaldehyde, 2-phenyl-2-butenal, 2-pentanone, 2-octanone, 6-octenoic acid, 3,7-dimethyl-, geranic acid, cyclohexene, 3,3,5-trimethyl-, and carvacrol, most of which existed only in H2. H3 co-varied well with 5-methyl furfural, anisaldehyde, and hexanoic acid. H4 was associated with some of the identified compounds such as furfuryl alcohol, ethyl hydrogen oxalate or 2,4-di-tert-butylphenol. From the previously listed results, it was revealed that 1-propanol, 2-methyl-1-propanol, ethyl acetate, 2,3-pentanedione, ethyl lactate, ethanol, hexanal, 1-butanol, ethyl-2-methylbutyrate, ethyl 3-methylbutyrate, 3-methyl-butanal, 1-nonanal, furfural, sarcolactic acid, butyric acid, isovaleric acid, propylmalonic acid, ethanol, acetic acid, nonanoic acid, benzaldehyde, and 2,5-furandicarboxaldehyde made a great contribution to honey. Because these compounds were associated with sensory attribute. Therefore, PLSR was successful in detecting positive and negative correlations between the sensory analysis and the volatile compositions.
Characterization of different honey samples by electronic nose
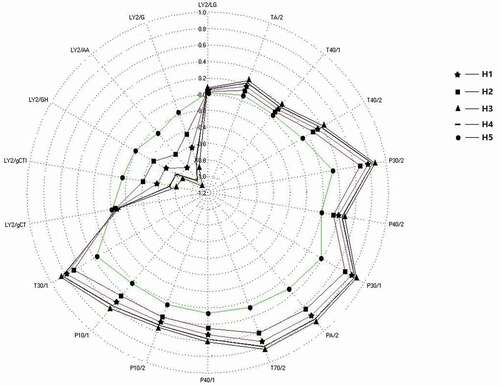
During the electronic nose analysis of tested honey samples, a radar graph () was automatically generated by the built-in software of the system. These graphs showed the responses of 18 sensors to the five honey samples, and the values were distributed between –1.2 to 1.0. The odour profiles of most samples were similar, but H5 was obviously distinguishable from the other samples. The values detected for H5 were lower than those for the other samples for most of the sensors, but higher values were observed for H5 by the sensors of LY2/gCTl, LY2/GH, LY2/AA, and LY2/G.
Figure 3. The radar fingerprints of five different honey samples. ▲ = H3; ■ = H2; ● = H5; ⋆ = H1; - = H4.
Relationships between sensory attributes and electronic nose data
To study the correlation between sensory evaluation results and the electronic nose data, a PLS2 regression analysis was carried out. The PLS2 regression correlation loading plot was derived from the response values of 18 electronic nose sensors as the X-matrix, and the sensory attributes as the Y-matrix, as is shown in . The inner ellipse shown in indicated 50% of the explained variance, and the outer ellipse accounted for 100% of the explained variance. Thus, the sensory parameters between the two ellipses can be considered as correlated with the electronic response, and those inside the inner ellipse are poorly connected with the electronic nose sensors. The percentage of cumulative contribution of variance for the first two PCs was 98%, which is high enough to represent all of the variables. PC1 and PC2 expressed 96 and 2% of the volatile variability, respectively. All of the sensors and sensory properties, except for fresh, were between the two ellipses, which indicated that the model had good analytical capability for these variables.
Figure 4. PLSR correlations loading plot of sensory attribute and electronic nose sensors from five honey samples. The model was derived from electronic nose sensors as the X-matrix and sensory attributes as the Y-matrix. Ellipses represent R2=0.5 and 1.0, respectively.
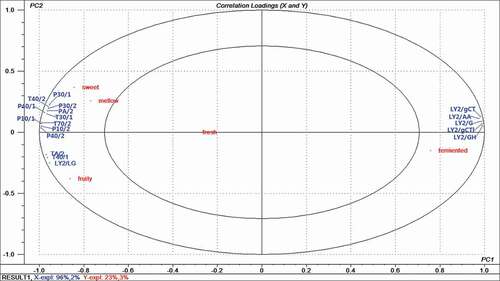
It is obvious that the sensors were separated into three main groups. Sensors T30/1, P10/1, P10/2, P40/1, T70/2, T40/2, P30/1, P30/2, PA/2, and P40/2 were clustered in the upper left quadrant, which was significantly correlated to the sweet and mellow attributes. Sensors TA/2, T40/1, and LY2/LG were grouped in the bottom left, which was associated with the fruity attribute. Sensors LY2/G, LT2/AA, LY2/GH, LY2/gCTl, LY2/gCT were located in the upper right quadrant, and they covaried well with the fermented attribute.
In comparing and and , it can be seen that the sensory attributes of the five tested samples are mostly well predicted by the electronic nose data. For example, H5 had the highest fermented score, and it had higher values in the sensors associated with the fermented attribute. H3 had the strongest fruity flavor, which was confirmed by TA/2, T40/1, and LY2/LG in the electronic nose system. Based on these results, we can generally conclude that the electronic nose is suitable to assist in the sensory evaluation of honey samples.
Conclusions
This study was focused on an analysis of the aroma features for honey samples from different botanical origins, by using sensory evaluations, identification of volatile compounds by GC-MS, and electronic nose measurements. The sensory results demonstrated that the five honey samples had distinctly different taste and aroma characteristics. Based on the GC-MS analysis, a total of 55 volatile compounds with different species and concentrations were identified in the five honey samples, indicating that the flavor qualities of these samples clearly differed according to their flower sources. PLSR analysis between the sensory profiles and the assessments of volatile compounds indicated that each sensory attribute was associated with specific odor-active compounds. It was also found that the electronic nose was capable of identifying different types of honey, and it could help to predict the sensory properties of honey. These results suggested that the sensory evaluations, the volatile profiling by GC-MS and the analysis by the electronic nose, in combination with multivariate statistical analysis, demonstrated a promising set of tools for assessing the overall aroma descriptions for different types of honey. A better comprehension of these knowledge should be significantly helpful in the tasks of distinguishing the characteristic aromas of different honey samples and verifying the authenticity of commercial honey products.
Funding
This research was supported by the Ability Construction Project of the Science and Technology Commission Foundation of Shanghai (No. 15590503500).
Additional information
Funding
Related Research Data
References
- Pires, J.; Estevinho, M.L.; Feás, X.; Cantalapiedra, J.; Iglesias, A. Pollen Spectrum and Physico-Chemical Attributes of Heather (Erica sp.) Honeys of North Portugal. Journal of the Science of Food & Agriculture 2009, 89, 1862–1870.
- Perna, A.; Intaglietta, I.; Simonetti, A.; Gambacorta, E. Antioxidant Activity of Yogurt Made from Milk Characterized by Different Casein Haplotypes and Fortified with Chestnut and Sulla Honeys. Journal of Dairy Science 2014, 97, 6662–6670.
- Jerković, I.; Tuberoso, C.I.G.; Marijanović, Z.; Jelić, M.; Kasum, A. Headspace, Volatile and Semi-Volatile Patterns of Paliurus Spina-Christi Unifloral Honey as Markers of Botanical Origin. Food Chemistry 2009, 112, 239–245.
- Radovic, B.S.; Careri, M.; Mangia, A.; Musci, M.; Gerboles, M.; Anklam, E. Contribution of Dynamic Headspace GC-MS Analysis of Aroma Compounds to Authenticity Testing of Honey. Food Chemistry 2001, 72, 511–520.
- Zhou, Q.; Wintersteen, C.L.; Cadwallader, K.R. Identification and Quantification of Aroma-Active Components That Contribute to the Distinct Malty Flavor of Buckwheat Honey. Food Chemistry 2002, 50, 2016–2021.
- Guyot, C.; Bouseta, A.; Scheirman, V.V.; Collin, S. Floral Origin Markers of Chestnut and Lime Tree Honeys. Journal of Agricultural & Food Chemistry 1998, 46, 625–633.
- He, W.; Hu, X.; Zhao, L.; Liao, X.; Zhang, Y.; Zhang, M.; Wu, J. Evaluation of Chinese Tea by the Electronic Tongue: Correlation with Sensory Properties and Classification According to Geographical Origin and Grade Level. Food Research International 2009, 42, 1462–1467.
- Chen, Q.; Zhao, J.; Chen, Z.; Lin, H.; Zhao, D.-A. Discrimination of Green Tea Quality Using the Electronic Nose Technique and the Human Panel Test, Comparison of Linear and Nonlinear Classification Tools. Sensors and Actuators B: Chemical 2011, 159, 294–300.
- Gao, X.; Shuang, Y.; Bao, Y.; Jian, L.; Zhao, J. A Novel Method for Beef Potentiator Preparation and Identification of Its Characteristic Aroma Compounds. Journal of the Science of Food & Agriculture 2014, 94, 1648–1656.
- Lerma-Garcia, M.J.; Cerretani, L.; Cevoli, C.; Simo-Alfonso, E.F.; Bendini, A.; Toschi, T.G. Use of Electronic Nose to Determine Defect Percentage in Oils. Comparison with Sensory Panel Results. Sensors and Actuators B: Chemical 2010, 147, 283–289.
- Qin, Z.; Pang, X.; Chen, D.; Cheng, H.; Hu, X.; Wu, J. Evaluation of Chinese Tea by the Electronic Nose and Gas Chromatography–Mass Spectrometry: Correlation with Sensory Properties and Classification According to Grade Level. Food Research International 2013, 53, 864–874.
- Bianchi, F.; Careri, M.; Musci, M. Volatile Norisoprenoids as Markers of Botanical Origin of Sardinian Strawberry-Tree (Arbutus Unedo L.) Honey: Characterisation of Aroma Compounds by Dynamic Headspace Extraction and Gas Chromatography–Mass Spectrometry. Food Chemistry 2005, 89, 527–532.
- O’Sullivan, M.G.; Byrne, D.V.; Jensen, M.T.; Andersen, H.J.; Vestergaard, J. A Comparison of Warmed-over Flavour in Pork by Sensory Analysis, GC/MS and the Electronic Nose. Meat Science 2003, 65, 1125–1138.
- Reinhard, H.; Sager, F.; Zoller, O. Citrus Juice Classification by SPME-GC-MS and Electronic Nose Measurements. LWT–Food Science and Technology 2008, 41, 1906–1912.
- Cheng, H.; Chen, J.; Chen, S.; Wu, D.; Liu, D.; Ye, X. Characterization of Aroma-Active Volatiles in Three Chinese Bayberry (Myrica Rubra) Cultivars Using GC–MS–Olfactometry and an Electronic Nose Combined with Principal Component Analysis. Food Research International 2015, 72, 8–15.
- Wei, Z.; Leiqing, P.; Xiujie, Z.; Kang, T. A Study on Soluble Solids Content Assessment Using Electronic Nose: Persimmon Fruit Picked on Different Dates. International Journal of Food Properties 2016, 19, 53–62.
- Kobra, H.; Seyed, S.M.; Amin, F.; Mahdi, G.V.; Shahin, R.; Karamatollah, R. Detection of Adulteration in Saffron Samples Using Electronic Nose. International Journal of Food Properties 2015, 18, 1391–1401.
- Čačic´, F.; Primorac, L.; Kenjeric´, D.; Benedetti, S.; Mandic´, M.L. Application of Electronic Nose in Honey Geographical Origin Characterization. Journal of Central European Agriculture 2009, 10, 19–26.
- Huang, L.; Liu, H.; Zhang, B.; Wu, D. Application of Electronic Nose with Multivariate Analysis and Sensor Selection for Botanical Origin Identification and Quality Determination of Honey. Food and Bioprocess Technology 2014, 8, 359–370.
- Wei, Z.; Wang, J. Tracing Floral and Geographical Origins of Honeys by Potentiometric and Voltammetric Electronic Tongue. Computers and Electronics in Agriculture 2014, 108, 112–122.
- Castro-Vázquez, L.; Díaz-Maroto, M.C.; González-Viñas, M.A.; Pérez-Coello, M.S. Differentiation of Monofloral Citrus, Rosemary, Eucalyptus, Lavender, Thyme and Heather Honeys Based on Volatile Composition and Sensory Descriptive Analysis. Food Chemistry 2009, 112, 1022–1030.
- IPQ.NPEN ISO 8589. Sensory Analysis. General Guidance for the Design of Test Rooms (ISO 8589:2007/Amd 1:2014). Instituto Portugues da Qualidade, Lisboa 2014.
- Qin, Z.; Pang, X.; Chen, D.; Cheng, H.; Hu, X.; Wu, J. Evaluation of Chinese Tea by the Electronic Nose and Gas Chromatography–Mass Spectrometry: Correlation with Sensory Properties and Classification According to Grade Level. Food Research International 2013, 52, 864–874.
- Feng, T.; Zhuang, H.; Ye, R.; Jin, Z.; Xu, X.; Xie, Z. Analysis of Volatile Compounds of Mesona Blumes Gum/Rice Extrudates Via GC-MS and Electronic Nose. Sensors and Actuators B: Chemical 2011, 160, 964–973.
- Wang, B.; Xu, S.; Sun, D.-W. Application of the Electronic Nose to the Identification of Different Milk Flavorings. Food Research International 2010, 43, 255–262.
- Rosa, A.P.; Consuelo, S.B.; Rosa M.C.; Jose, L.T. Analysis of Volatiles from Spanish Honeys by Solid-Phase Microextraction and Gas Chromatography-Mass Spectrometry. Journal of Agricultural & Food Chemistry 2002, 50, 2633–2637.
- Perez, R.A.; Sanchez-Brunete, C.; Calvo, R.M.; Tadeo, J.L. Analysis of Volatiles from Spanish Honeys by Solid-Phase Microextraction and Gas Chromatography-Mass Spectrometry. Journal of Agricultural and Food Chemistry 2002, 50, 2633–2637.
- Soria, A.C.; Martínez-Castro, I.; Sanz, J. Some Aspects of Dynamic Headspace Analysis of Volatile Components in Honey. Food Research International 2008, 41, 838–848.
- Beata, P.; Tomasz C.; Tomasz D.; Waldemar, W. A Headspace Solid-Phase Microextraction Method Development and Its Application in the Determination of Volatiles in Honeys by Gas Chromatography. Food Chemistry 2011, 126, 1288–1298.
- Moreira, R.F.; Trugo, L.C.; Pietroluongo, M.; De Maria, C.A. Flavor Composition of Cashew (Anacardium Occidentale) and Marmeleiro (Croton Species) Honeys. Journal of Agricultural and Food Chemistry 2002, 50, 7616–7621.
- Moniruzzaman, M.; Rodriguez, I.; Ramil, M.; Cela, R.; Sulaiman, S.A.; Gan, S.H. Assessment of Gas Chromatography Time-of-Flight Accurate Mass Spectrometry for Identification of Volatile and Semi-Volatile Compounds in Honey. Talanta 2014, 129, 505–515.
- Blank, I.; Fischer, K.H.; Grosch, W.; Blank, I.; Fischer, K.H. Intensive Neutral Odourants of Linden Honey. Zeitschrift für Le0bensmittel-Untersuchung und-Forschung 1989, 189, 426–433.
- Schwab, W.; Davidovich-Rikanati, R.; Lewinsohn, E. Biosynthesis of Plant-Derived Flavor Compounds. Plant Journal for Cell and Molecular Biology 2008, 54, 712–732.
- Gianelli Barra, M.P.; Ponce-Díaz, M.C.; Venegas-Gallegos, C. Volatile Compounds in Honey Produced in the Central Valley of Ñuble Province, Chile. Chilean Journal of Agricultural Research 2010, 70, 75–84.
- Moniruzzaman, M.; Rodríguez, I.; Ramil, M.; Cela, R.; Sulaiman, S.A.; Gan, S.H. Assessment of Gas Chromatography Time-of-Flight Accurate Mass Spectrometry for Identification of Volatile and Semi-Volatile Compounds in Honey. Talanta 2014, 129, 505–515.
- Niu, Y.; Zhang, X.; Xiao, Z.; Song, S.; Eric, K.; Jia, C.; Yu, H.; Zhu, J. Characterization of Odor-Active Compounds of Various Cherry Wines by Gas Chromatography-Mass Spectrometry, Gas Chromatography-Olfactometry and Their Correlation with Sensory Attributes. Journal of Chromatography B 2011, 879, 2287–2293.
- Tian, H.; Li, F.; Qin, L.; Yu, H.; Ma, X. Quality Evaluation of Beef Seasonings Using Gas Chromatography-Mass Spectrometry and Electronic Nose: Correlation with Sensory Attributes and Classification According to Grade Level. Food Analytical Methods 2014, 8, 1522–1534.
- da Silva, P.M.; Gauche, C.; Gonzaga, L.V.; Costa, A.C.; Fett, R. Honey: Chemical Composition, Stability and Authenticity. Food Chemistry 2016, 196, 309–323.