
ABSTRACT
This study involves investigation of the effects of addition of different hydrocolloids on the thermal, microscopic, and quality properties of low-fat meat emulsions and frankfurters. The emulsion stability of the samples containing 0.5% κ-carrageenan, λ-carrageenan or chitosan, and the 1% chitosan containing sample were lower than that of the control group. Thermal analyses showed three denaturation peaks for minced meat at 57.42 °C, 64.21 °C and 78.58 °C. While the denaturation temperature of myosin for the sample produced with 0.5% of κ-carrageenan was significantly lower, samples containing 1% κ-carrageenan and 0.5% λ-carrageenan were not significantly different than that of the control group. The thermal denaturation temperature of myosin for samples containing 1% λ-carrageenan, and for 0.5% and 1% guar gum, xanthan gum and chitosan was significantly higher than that of the control. The denaturation temperature of sarcoplasmic proteins and actin for samples with 1% κ- and λ-carrageenan and 0.5% chitosan, was higher than for the control, while for other samples it was not significantly different. The scanning electron microscopy images of the control group and samples produced with 0.5% and 1% λ-carrageenan, 0.5% and 1% guar gum, and 1% κ-carrageenan showed gel-like structures, whereas other samples did not. Sensory evaluations showed that addition of hydrocolloids and reduced fat content lowered acceptance of frankfurters. Results showed that both κ- and λ-carrageenan, especially at 0.5% were the most suitable hydrocolloids for production of low-fat frankfurters and xanthan gum was the least suitable since it did not form proper structure.
Introduction
Meat emulsions are chopped with other ingredients in order to obtain a dispersion of water, fat, and protein; they are considered to be oil-in-water emulsions.[Citation1,Citation2] Fat is one of the major constituents of meat products and affects product binding, and rheological and structural properties.[Citation3,Citation4] Furthermore, fat acts as a flavor component.[Citation4] Due to the properties of fat in meat products, reducing the fat level without any additives results in tough, dry, and rubbery outcomes with water unable to bind to the system.[Citation5,Citation6] Although fat has important functions in meat products, high fat consumption is thought to cause obesity, colon cancer, and atherosclerosis,[Citation7] and health organizations are promoting reduction of dietary fat intake. In order to attain health organization goals and meet consumer demands, producers have long been trying to reduce the high fat content in meat products. Addition of water while reducing the fat level gives palatable products; however, this also gives rise to increased cooking losses.[Citation8,Citation9] Since addition of water alone is not economical, different additives, such as connective tissue proteins,[Citation10,Citation11] soy proteins,[Citation12] and hydrocolloids,[Citation1,Citation5,Citation13,Citation14] have been used in attempts to establish the desired texture. Due to the unique properties of hydrocolloids on texture formation and binding of water, they are preferred for the production of low-fat frankfurters.[Citation5] There are many studies in the literature considering the effects of hydrocolloids on product quality; on the other hand, studies on how hydrocolloids form the structure in low-fat frankfurters did not fully investigate whether there is an interaction between the meat proteins and hydrocolloids.
Meat proteins, especially myofibrillar proteins, have a major role in formation of the desired structure in meat products, due to their ability to establish three-dimensional gels during the production procedure.[Citation15,Citation16] It is believed that the functional properties of the proteins such as, gel formation, solubility, and emulsifying capacity are changed as a result of interactions between the polysaccharides and proteins. Consequently, these interactions play a substantial part in the formation of product structure and stability.[Citation17] The interactions between polysaccharides and proteins, other than meat proteins, are well documented;[Citation18–Citation20] polysaccharide-meat protein interactions need further investigation. Differential scanning calorimetry (DSC) is an effective analytical method for the investigation of meat protein polysaccharide interactions as it is accepted that changes in the denaturation temperature of proteins on addition of polysaccharides is an indication of such interactions.[Citation21] In this study, the interactions between meat proteins and polysaccharides were investigated using DSC. Also investigated was the effect of lowering the fat content on emulsion stability and cooking loss.
Materials and methods
Materials
The ground meat used in the analyses and the production of low-fat emulsions were obtained from local processors. Κ-carrageenan (κCRG), λ-carrageenan (λCRG), corn and potato starch were kindly donated by Cargill (Istanbul, Turkey), guar gum (GG) and xanthan gum (XTG) were kindly donated by GMT Ingredients Co. (Istanbul, Turkey). Chitosan (CHI) was purchased from Sigma-Aldrich (Steinheim, Germany). DSC hermetic pans used for thermal analysis were purchased from Likrom Analytical Solutions Inc. (Ankara, Turkey). Ingredients, other than hydrocolloids, used for production of the frankfurters were obtained from Pinar Integrated Meat and Feed Industries (Izmir, Turkey).
Preparation of low-fat emulsions and low-fat frankfurters
Low-fat emulsions were prepared according to established methods for low-fat frankfurter formulation; that is to say, formed by addition to the mixture of ground meat, fat, and water of 1.5% sodium chloride (NaCl), 0.3% sodium-phosphate, 3.2% potato starch, and 0.5 or 1% of one of the different hydrocolloids. Emulsions were prepared at the laboratory by mixing the ingredients in a mixer.
The frankfurters were produced by Pinar Integrated Meat and Food Industries, Inc. (Izmir, Turkey). The frankfurter control group was produced with 35% beef meat (with 15% fat), 25% beef meat (with 30% fat), 15% beef fat, and 25% ice. The fat content of the other samples was reduced to 5% and different levels of a number of hydrocolloids were added in order to obtain desired texture. Seven kilograms of batter was prepared for each group; in each group the ingredients used (per kilogram of meat/fat/ice mixture) were: sodium chloride (15 g), sodium-phosphate (3 g), ascorbic acid (0.5 g), ascorbate (0.5 g), sodium nitrite (0.125 g), black pepper (2 g), red pepper (2 g), coriander (0.5 g), ginger (0.4 g), sodium caseinate (8 g), and potato starch (32 g). Ten different low-fat frankfurter formulations were produced for, the different hydrocolloids used and their quantities are shown in .
Table 1. Amount of hydrocolloids used for each sample and abbreviations of the samples.
For the production of frankfurters meat, fat, half of the ice, and the ingredients, other than potato starch and caseinate, were mixed in a cutter (Kilia, vacuum cutter, Neumünster Germany) at low speed (1000 rpm). The hydrocolloid additive was then incorporated and the ingredients mixed at 3500 rpm for another 1–2 min. The cutter speed was then raised to 5500 rpm until the mixture temperature reached 6°C, at which point the potato starch, caseinate, and the remaining ice were added and mixing was continued at 5500 rpm until the temperature of the mixture reached to 12°C. The mixture was stuffed into 18 Ø synthetic casings and hand-linked at 19 cm intervals. Stuffed mixtures were heat-processed and smoked in the smokehouse under the following conditions: drying for 50 min at 60°C and 60% relative humidity (RH), smoking for 50 min at 60°C and 60% RH, and then steam cooking until the internal temperature reached 72°C. The frankfurters were then showered with cold water for 5 min. After cooling, the frankfurters were peeled, vacuum-packed, and pasteurized for 30 min at 78°C. The frankfurters were transferred to the Department of Food Engineering at Hacettepe University under cold storage (4°C).
Determination of emulsion stability of the low-fat emulsions
The stability of the low-fat emulsions was determined according to the methods of Zhou et al.[Citation22] and Hughes et al.;[Citation13] analysis was performed in triplicate. Each sample (10 g) was weighed into a 30 mL centrifuge tube, and these were centrifuged at 3600 × g, for 1 min (Sigma 3-30K, Germany) to remove the unbound water. After centrifugation the samples were placed in a water bath at 85°C for 35 min, then cooled to room temperature and centrifuged again at 3600 × g for 3 min. After removal of the supernatant, samples were weighed and total expressible fluids (TEFs) were determined from the difference between the first and last weights. The percent of TEF was determined according to the formula given below:
Determination of thermal properties of potato starch, hydrocolloids, minced meat, low-fat emulsions, and frankfurters
The thermal properties of potato starch, hydrocolloids, minced meat, low-fat emulsions, and frankfurters were determined using a Q20 differential scanning calorimeter (TA Instruments, Delaware USA). DSC was calibrated with indium (melting point: 156.6°C and melting enthalpy 28.5 J/g) before usage. Analysis was performed under a nitrogen atmosphere at a flow rate of 50 mL/min. An empty pan was used as a reference for all analysis and the analyses, which were performed in triplicate. Thermograms obtained from the DSC were investigated with TA universal analysis 2000. Potato starch (5%) and hydrocolloids (1%) were prepared in beakers and stored in the refrigerator overnight before thermal analysis. Samples (potato starch, hydrocolloids, meat, low-fat emulsions, and frankfurters) were weighed (6.5 ± 0.5 mg) into aluminum hermetic pans, which were hermetically sealed and analyzed between 20 and 100°C at a rate of 5°C/min to determine gelatinization and denaturation temperatures.[Citation23–Citation25]
In order to determine the glass transition temperature of the frankfurters, 6.5 ± 0.5 mg of each sample was weighed into an aluminum pan and hermetically sealed. The sample and the reference were equilibrated at 20°C; after equilibration the pans were cooled to –80°C and kept at that temperature for 15 min. Then the pans were brought up to annealing temperature and kept at that temperature for 60 min at the end of this time the pans were cooled to –80°C and held again for 15 min. The samples were then scanned to 20°C.[Citation26] All scans were performed at a rate of 5°C/min and the annealing temperature was determined in preliminary studies.
Quality characteristics of the frankfurters
Moisture, protein, fat, and pH values of the samples were determines according to the methods of Vural and Oztan;[Citation27] these analyses were performed at the beginning of the storage, in triplicate for each treatment.
Water-holding capacity (WHC) analysis
The WHC of the samples was analyzed according to the method of Zayas and Lin,[Citation28,Citation29] as modified by Oztan and Vural;[Citation30] the analysis was performed at the beginning of storage, in triplicate for each treatment.
Color measurements
The color measurements of the samples were performed at the inner cuts of the samples using a Minolta Spectrophotometer CM-3600d (Osaka Japan) at the beginning of storage. The lightness (L*), redness (a*), and yellowness (b*) of the samples were measured,[Citation5] each analysis was performed in quadruplicate for each sample.
Instrumental texture profile analysis
The texture profile analysis of the frankfurters was performed with a texture analyzer (Amatek Lloyd Instruments Ltd., United Kingdom) using a Warner Bratzier shear blade. The test speed was 200 mm/min, trigger was 0.05 N, the compression rate was 50% and the samples length was 15 mm. Changes to hardness (Ncm−2), springiness (cm), gumminess (Ncm−2), and chewiness (Ncm−1) were evaluated at the beginning of storage,[Citation31] each analysis was performed in quadruplicate for each sample.
Cooking loss of the frankfurters
The cooking loss of the frankfurters was determined by weighing the linked frankfurters before and after cooking according to the following equation.[Citation5]
Scanning electron microscope (SEM) analysis
The microscopic properties of the samples were determined with SEM (Zeis EVO50 Germany). The frankfurters, ground meat, and fat were placed directly on the sample holder and analyzed. Samples of hydrocolloid gels were coated with gold and placed on the aluminum holder; analyses were performed at 15 kW at three different locations on each sample.
Fourier transform infrared spectroscopy (FTIR) analysis
Attenuated total reflectance (ATR)-FTIR analysis was performed at Turkey Atomic Energy Authority Laboratories (Sarayköy/Ankara). Dried and homogenized samples were placed on a horizontal ATR ZnSe pallet and the absorbances measured between 700–4000 cm−1, at a resolution of 4 cm−1 with 32 scans. Before sample analyses, a background spectrum was obtained using an empty ATR crystal as a reference.
Sensory evaluation
The frankfurters were evaluated in one session with two replicates. Ten untrained panelists evaluated both the control group and the low-fat frankfurters for their appearance, color, texture, and flavor on a 9-point hedonic scale where 9 represents strongly like and 1 represents strongly dislike.[Citation32] The samples were prepared by holding the frankfurters in boiling water for 2 min each in individual pans. Warm samples were randomly served to the panelists. In order to determine the total sensory scores for the samples, the sensory criteria were multiplied by specific weighing factors appearance, color, texture, and flavor, which are 1, 3, 3, and 3, respectively. The sum of these multiplied criteria was divided by the sum of weighing factors, which considered 10 to reach the final score.
Statistical analysis
Statistical analysis was performed using IBM SPSS statistics 21. The statistical significances of differences between means were determined using Duncan’s multiple range test.
Results and discussion
Quality characteristics and water holding capacities of the frankfurters
Percent moisture, fat, and protein of the frankfurters, and pH values, are given in . According to these results the moisture content of the samples varied between 60.24 and 66.24%. All samples except for the sample containing 1% of XTG were significantly different from the control group (p < 0.05), values generally being higher than for the control group. On the other hand, the moisture content of the sample containing 1% of κCRG was significantly lower than that of the control group. The fat content of the low-fat frankfurters was significantly lower than that of the control group, which was expected. The protein content of the control group was 13.74%; however, the low-fat frankfurters protein contents varied between 9.88 and 11.43%, which are significantly lower than for the control group (p < 0.05). Meat and meat products communique[Citation33] stated that for the emulsified meat products, the ratios of moisture content to total protein content (M:P) and of fat content to total protein content (F:P), should be less than 6.5 and 3.2, respectively, and the total meat protein content should be greater than 10%. The results obtained for M:P and F:P for the control group and the low-fat frankfurters were below their respective threshold values. Furthermore, the protein content of each of the samples was found to exceed the minimum level required regulations, except in the case of samples containing 0.5% λCGN.
Table 2. Moisture%, fat%, protein%, and WHC of the frankfurters.
It was reported by Cierach et al.[Citation4] that using different carrageenans during production of frankfurters with 10 and 20% fat, increased both moisture and fat content compared to control; on the other hand it was stated that protein content was reduced. Luruena-Martinez et al.[Citation14] found in their study, which decreased animal fat content while adding olive oil and locust bean gum/XTG mixture in pork frankfurters, that samples with reduced fat content had higher moisture content, whereas the protein content was not significantly affected.
Although the moisture content of the control group in the current study was as expected, the low-fat frankfurters had lower moisture content values than anticipated. This could be due to the different water holding properties of the hydrocolloids.
The WHC of the samples is shown in . The results showed that the WHC of the samples with 1% λCGN, 0.5% GG, 1% GG, and 1% XTG were significantly higher (p < 0.05) than the control, while the other samples did not differ significantly. Increasing the hydrocolloid concentration from 0.5 to 1% increased the WHC, except in the case of CHI, in agreement with the findings of Candoğan and Kolsarici[Citation5] that increasing the content of carrageenans increased the WHC of the frankfurters. The sample with the highest WHC was contained 1% λCGN. Wallingford and Labuza[Citation34] investigated the WHC of various hydrocolloids in low-fat meat emulsions and reported that XTG was the best for holding water in the system. In the current study, it was found that XTG significantly increased the WHC of the low-fat frankfurters when added at 1%; however, the hydrocolloid treatment which enhanced the WHC most effectively was 1% λCGN.
Emulsion stability and cooking loss
The lowest cooking loss was found to be that of the sample produced with 0.5% GG, and the highest for the sample produced with 1% CHI. The cooking loss values of the samples, other than 0.5% GG, were greater than those of the control group. Increasing the amount of hydrocolloids in the low-fat frankfurters resulted in an increase in the cooking loss except with κCGN and XTG. Cierach et al.[Citation4] observed in their study that the cooking loss of samples produced with different carrageenans varied, but was not significantly different. Lin et al.[Citation35] stated that lowering the ratio of fat:protein would result in increased water loss, and that process yield depends on the mobilization of fat and water by the proteins. On the other hand, in low-fat meat products the WHC and gelling properties are the primary factors affecting formation of the emulsion. Our results showed that the cooking loss of the products with a lower F:P ratio were greater, and addition of different hydrocolloids affected the cooking loss differently (). The divergence in the effect of hydrocolloids was attributed to their different gelling and WHC properties. Increasing the amount of the hydrocolloids used enhanced the emulsion stability of the samples, which is in agreement with the findings of Candogan and Kolsarici.[Citation5]
Table 3. Cook loss and total expressible fluid results.
The emulsion stability of the samples can be represented as the TEF which shows that the higher the TEF the greater the water and fat release from the emulsion.[Citation22] According to the results of the current study (), emulsion stability increased as the hydrocolloid percentage was increased, as seen in the fact that %TEF values were decreased. Samples containing 0.5% of κCGN and λCGN showed greater values for TEF when compared to the control group, although this was not statistically significant (p > 0.05). On the other hand, the increase in the %TEF of samples containing 0.5 and 1% of CHI was significant (p < 0.05). For other samples %TEF was found to be less than that of the control group; however, only for samples produced with 1% of XTG and GG was %TEF significantly different (p < 0.05). Candogan and Kolsarici[Citation5] reported in their study that for low-fat frankfurters produced with carrageenan and pectin, product emulsion stability increased with the amount of carrageenan used. According to the results of Lurueña-Martínez, Vivar-Quintana and Revilla,[Citation14] the values of %TEF and the cooking loss of low-fat products, produced with locust bean gum/XTG was less than that of the control. It was also reported that the difference between the cooking loss and emulsion stability (%TEF) could be due to the difference between the cooking procedures; although the final temperature reached, whereas similar for both procedures, in the determination of cooking loss, samples in the smokehouse were brought to the desired temperature (72°C) over a longer time. In contrast, a small amount of sample was used for determination of %TEF, thus achieving the desired temperature quickly, which probably improved the formation and the strength of the gel. In the current study, both %TEF and cooking loss values of samples produced with 0.5% of κCGN, λCGN, and CHI, and that produced with 1% CHI were greater than for the control. The other samples had lower %TEF values; however, cooking loss values were higher than that of the control except for the sample produced with 0.5% of GG. This is in agreement with the findings of Lurueña-Martínez, Vivar-Quintana, and Revilla[Citation14] and Crehan et al.[Citation36]
Thermal properties of potato starch, hydrocolloids, minced meat, low-fat emulsions, and frankfurters
The thermograms obtained from DSC were analyzed by TA Universal Analysis 2000. Based on results the gelatinization peak temperature (Tp) of potato starch was 65.53°C and the transition temperature of XTG was 87.73°C. According to the DSC results, κCGN forms thermally reversible gels and the gel-sol transition Tp was 56.15°C and sol-gel transition Tp was found to be 28.29°C. There were no peaks found for GG, λCRG, and CHI at the temperature range of the study which was 20 to 100°C. The results obtained in this study correlated well with those reported in the literature; slight variations between results were probably due to differences in sample preparation techniques and DSC analysis parameters.[Citation21,Citation37–Citation40] It was reported by Tomšic, Prossnigg, and Glatter,[Citation39] that gel-sol transition temperature for 1 and 2% κCGN were 40.9 and 51.6°C, respectively. The sol-gel transition temperatures were 28.4°C for 1% κCGN and 36.7°C for 2% κCGN.
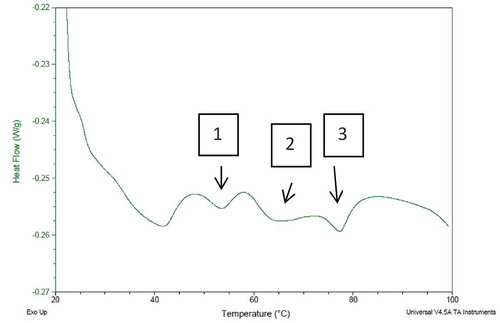
The DSC thermogram for minced meat showed three peaks which were attributed to the denaturation of meat proteins. The peak temperatures found in the thermogram were 57.64, 66.08, and 79.28°C (, ), which were attributed to myosin, sarcoplasmic proteins, and actin, respectively. These results are similar to those obtained by Chen, Xu, and Wang[Citation41] and Defreitas et al.[Citation21] Additionally, it was reported by Quinn, Raymond and Harwalker[Citation42] that three peaks obtained from pork muscle represents myosin (59°C), sarcoplasmic proteins (66.5°C), and actin (81°C). The enthalpy value (ΔH J/g) gives information about the energy needed for the denaturation of proteins (). The highest enthalpy of the minced meat was found for the denaturation of actin and the lowest was for myosin. The decrease in the peak temperature values of the protein due to addition of NaCl was significant (p < 0.05) when compared to the samples without NaCl. The addition of 1.5% NaCl to the meat, decreased the Tp values of myosin and actin to 55.85 and 74.97°C, respectively. On the other hand, the Tp value of the sarcoplasmic protein was increased to 67.85°C. The enthalpy values of the proteins were decreased due to addition of NaCl; a sign of system instability also reported by Pighin, Sancho, and Gonzalez.[Citation43] The decrease in the enthalpy of actin was significant (p < 0.05) while the decreases in myosin and sarcoplasmic protein enthalpies were not significant (p > 0.05). Another study reported that ionic strength affects the denaturation temperatures of proteins, and addition of 2.5% of NaCl to meat decreased the Tp values of myosin and actin by 3 and 8.5°C, respectively, while increasing the Tp value of sarcoplasmic proteins by 1.9°C.[Citation41] Since myosin and actin are salt soluble proteins, addition of NaCl destabilizes those proteins and reduces the Tp and ΔH values, in turn making the proteins more susceptible to denaturation.[Citation41,Citation43,Citation44]
Table 4. Thermal denaturation temperatures and enthalpies of meat batters.
Figure 1. DSC thermogram of minced meat 1: denaturation peak of myosin; 2: denaturation peak of sarcoplasmic proteins; and 3: denaturation peak of actin.
The DSC results of the low-fat emulsions showed two peaks; the Tp and ΔH values for those peaks can be seen in . The first peak to appear in the thermograms of low-fat emulsions is attributed to myosin. The peaks for sarcoplasmic proteins and actin could not be differentiated from each other and were observed as a single peak in the thermograms, which was due to the increase in Tp value of sarcoplasmic proteins and the decrease in Tp value of the actin, as described by Marchetti, Andrés, and Califano.[Citation3] It was also observed in the results that addition of phosphate, hydrocolloids, and starch along with NaCl causes a significant increase in the Tp values of myosin compared with NaCl alone as the additive (p < 0.05). Pighin, Sancho, and Gonzalez[Citation43] and Findlay and Barbut[Citation45] reported that when phosphates were used with more than 1% of NaCl, the effect of the phosphates was minimized. Based on this knowledge, it can be understood that the changes in the Tp and ΔH values of the low-fat emulsions were due to the effect of added hydrocolloids. It was observed from the results that the denaturation peak temperature of myosin was not significantly different from that of the control, for the samples containing 1% κCGN and 0.5% λCGN. On the other hand, the 0.5 κCGN sample showed a significant decrease in Tp while for other samples this value increased significantly compared to the control (p < 0.05). For the second peak only the 0.5% CHI, 1% λCGN, and 1% κCGN samples showed a significant increase (p < 0.05) while other samples were not significantly different.
It was indicated that the NH3+ groups on the proteins form strong complexes with the OSO3- groups found on the κCGN and λCGN.[Citation46] In the current study, addition of 0.5% κCGN to emulsions resulted in a decrease of the myosin’s Tp value whereas a slight increase was observed for the second peak. When 1% κCGN was used there was a slight increase in the Tp value of myosin which was not significant (p > 0.05); on the other hand, the increase in the Tp value of the second peak was significant compared to the control sample (p < 0.05). Samples containing λCGN had higher Tp values for both myosin and the second peak than the control. It was observed from the DSC results that the proteins were more strongly influenced by the carrageenans when the concentration of the additive used was increased. Furthermore, the increase in the Tp values of the samples containing λCGN, was more significant than for the samples containing κCGN. It is thought that this effect is a consequence of the higher amount of OSO3- groups in λCGN compared with κCGN. The changes in denaturation temperatures of proteins when the carrageenans were used as considered to an indication of interactions between proteins and carrageenans. These results were in agreement with those of Donatus and Xiong.[Citation47]
Addition of CHI significantly increased the Tp values of low-fat emulsions when compared to the control (p < 0.05) except for the Tp2 value for sample containing 1% CHI. The increase became more significant as the percentage of the additive was increased; This result did not agree with the findings of Horn, Martins, and de Guzzi Plepis,[Citation48] who reported that addition of CHI to collagen decreased the denaturation temperature due to the electrostatic interactions between CHI and collagen.
The DSC thermograms for frankfurters showed no peaks which was due to the irreversible denaturation of proteins during production. Although thermally reversible gels form with κCGN, no sol-gel transition was observed when the frankfurters were analyzed; this could also be a sign of κCGN interaction within the frankfurters.
FTIR results
FTIR analysis was performed in order to elicit information about the chemical changes and any new bond formations in the low-fat frankfurters produced with different hydrocolloids. FTIR results for the control group are shown in . The amid I band (1700–1600 cm−1) is known to provide information about the C=O stretching of peptide bonds in α-helix proteins.[Citation49,Citation50] Three main proteins (myosin, actin, and titin) in the myofibrils form the peaks in this region of the FTIR spectrum; however, it is not possible to differentiate which of them causes the change.[Citation49,Citation50] The amide II band (1600–1500 cm−1) gives information about the N-H bending and C-N stretching of polypeptides and proteins.
Figure 2. FTIR results of control group.
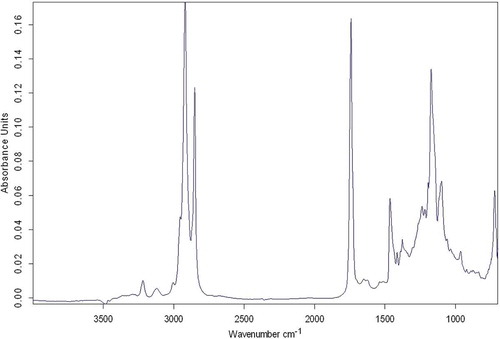
Although the DSC results showed some shift in the Tp values of the samples, which is an indication of hydrocolloid protein interaction, the FTIR results showed no new bond formation on the samples produced with different hydrocolloids, which does not support the idea of interactions between hydrocolloids and meat proteins.
Texture profile analysis results
As can be seen from , which shows the results for texture profile analysis, the hardness of the samples was significantly lower (p < 0.05) than for the control sample, exceptin the case of the sample containing 0.5% λCGN. The highest hardness value was for the control group and the lowest value was for the 1% XTG sample. Increasing the gum content from 0.5 to 1% resulted in a significant hardness decrease for the samples containing κCGN, λCGN, and XTG (p < 0.05); in contrast, increasing CHI content caused a significant increase (p < 0.05). Increasing the amount of GG from 0.5 to 1% did not significantly affect the hardness value (p > 0.05). It has also been reported by Fox et al.,[Citation51] Whiting,[Citation52] Foegeding, and Ramsey,[Citation53] and Lin et al.[Citation35] that increasing hydrocolloid concentration decreased the hardness of samples without affecting product stability.
Table 5. Texture profile analysis.
The springiness values of the samples were not affected by the addition of different hydrocolloids except for the 1% XTG sample, for which it was significantly lower than for the control group and low-fat frankfurters (p < 0.05). The highest values for gumminess and chewiness were observed for the control group and the lowest values for the samples containing 1% XTG. Low-fat samples produced with different hydrocolloids had significantly lower gumminess and chewiness values compared with the control group. Increasing gum content decreased the gumminess and chewiness of the samples, except for the samples produced with CHI. While this decrease was significant (p < 0.05) for samples with λCGN and XTG, increasing the amount of CHI used significantly increased these values (p < 0.05), nevertheless the gumminess and chewiness of samples containing CHI were significantly lower than for the control (p < 0.05).
The decreased values in the texture profile analysis results are in agreement with the results of Andres et al.[Citation1] who reported that increasing the amount of gums used in the low-fat chicken frankfurters decreased their hardness and chewiness values. Furthermore Ulu[Citation54] found that both raw and cooked meatballs produced with carrageenan and GG exhibited lower values for hardness, gumminess, chewiness, and cohesiveness.
SEM
The SEM results of the samples are shown in . It was observed that for the control group () three-dimensional structures with holes in it was formed. A similar structure was observed by Li and Yeh[Citation24] who claimed that these holes were formed due to the disruption during heat treatment of starch gelatinization. The SEM results of 0.5% κCGN and 1% κCGN ( and ) fewer holes compared to the control. There were no visible gel-like structures at low concentration; however, when an increased concentration of κCGN was used gel structures were formed. SEM results of samples containing λCGN ( and ) and GG ( and ) showed holes similar to the control group, also gel-like structures were clearly visible. SEM results for 0.5% λCGN and 1% GG samples were in agreement with those of Andres et al.[Citation1] who also found holes and gel-like structures. For XTG it was observed that when 0.5% of XTG () was used, structures resembled those of the control; however, if the concentration was increased to 1% XTG () the structure was very different, indicating that a proper structure was not formed. When the hardness of the 1% XTG sample was investigated it had the lowest value, resulting from the unformed structure. For the samples produced with CHI, SEM results showed very different structures from the other samples. Samples produced with 0.5% CHI () showed small cavities and no gel-like structures, whereas samples with 1% CHI showed fewer but larger cavities, with no gel-like structures ().
Figure 3. SEM images of the samples A: Control; B: 0.5% κCGN; C: 1% κCGN; D: 0.5% λCGN, E: 1% λCGN; F: 0.5% GG; G: 1% GG; H: 0.5% XTG; I: 1% XTG; J: 0.5% CHI; and K: 1% CHI containing samples.
When the SEM results were considered together with hardness values, it was observed that the sample with the hardness value closest to the control group (0.5% λCGN) showed SEM results resembling those of the control group. The results also showed that for the sample with the lowest hardness value (1% XTG) the structure was not fully formed. The SEM results of the samples with CHI were not similar to the control group; however, their hardness values were closer to the control group than most of the other samples. This was probably due to the gelling properties of CHI; in particular, it was thought that the smooth and more compact structure observed in the sample containing 1% CHI was responsible for the increase in hardness value. The decrease in the hardness values of samples not containing CHI was thought to be due to the larger and more frequent holes observed in SEM results.
Sensory evaluations
The results of the sensory evaluations are shown in . The external appearance of the samples was perceived to be significantly less acceptable than for the control, with the exception of the 0.5% κCGN and 1% λCGN samples. It was found that the color acceptance of the samples produced with 0.5% GG, 0.5% and 1% XTG and 1% CHI was significantly less (p < 0.05) than control, while for the other samples acceptance was less, although not significantly less (p > 0.05). Acceptance of the texture of the 0.5% κCGN and 0.5% λCGN samples had the closest values to the control sample, while other samples received significantly lower values (p < 0.05). The flavor results of the samples were significantly poorer than for the control group, except that for the 0.5% κCNG and 0.5% λCGN samples flavor scores were lower, but not significantly, than the control group scores (p > 0.05). The least acceptable of all the samples was that produced with XTG, which had the lowest values across all the sensory scores. Total acceptability scores of the samples produced with hydrocolloids were significantly lower than the control scores. The value for total acceptability that came closest to the control group was for the sample produced with 0.5% κCGN. Although the texture profile analysis and the SEM images of the 0.5% λCGN sample was most similar to those of the control group, 0.5% κCGN sample was considered more acceptable by the consumers.
Table 6. Sensory evaluation results.
Color measurement results
The lightness values of low-fat frankfurters were affected differently by addition of different hydrocolloids (). While the lightness values of the 0.5% κCGN, 1% κCGN, and 0.5% λCGN samples were significantly higher than for the control, samples containing 1% GG and 0.5% CHI were found to have significantly lower values. Other samples showed lower lightness values that were not significantly different from the control. The redness (a*) values of the samples were lower than that of the control group; however, this decrease was significant only for samples produced with XTG and 0.5% κCGN. Because the redness of the samples was decreased, the yellowness of low-fat frankfurters was increased. The increase in the yellowness of the samples was significant for all samples except for sample produced with 1% CHI. The results obtained were similar to those of Andres et al.[Citation1] who reported that addition of hydrocolloids and whey proteins to chicken frankfurters increased the lightness and yellowness of the frankfurter, while redness was decreased. Furthermore, Lin and Chao[Citation55] reported that addition of different molecular weight CHI resulted in a decrease in the lightness while the redness and the yellowness of the samples were increased. As can be seen from the literature and the results obtained in the current study, addition of hydrocolloids affects the color results of the low-fat frankfurters differently. Color is one of the most important properties influencing the purchase of meat products; consumers demand that frankfurters have a pink–red color. The lowest redness value was for samples produced with XTG, which the panelists also considered to be the least acceptable samples (). Another sample which showed a significantly lower redness value () was the 1% κCGN sample, which also rated a low acceptability by the panelists (). Samples produced with 0.5% κCGN and 0.5% λCGN had the highest acceptability of the low-fat frankfurters; these samples had the highest redness values and best TPA results, and showed similar structures to the control in the SEM results.
Table 7. Color measurement results of frankfurters.
Conclusion
Addition of different hydrocolloids to frankfurters affected the quality properties differently; moreover, they were less acceptable to consumers than the control group. In particular, the sample produced with XTG was the least liked. SEM results showed gel-like structures for most of the frankfurters, which indicates a better structure. The DSC analysis on meat showed three peaks; these were for myosin, sarcoplasmic proteins, and actin. Addition of NaCl to meat decreased the denaturation temperature of the myosin and actin while increasing the denaturation temperature of sarcoplasmic proteins. The decrease in denaturation temperature is a sign of protein destabilization, which makes it more easily denatured. The addition of NaCl, phosphate, or starch caused the peaks of sarcoplasmic proteins and actin to merge, and increased the Tp value of myosin. Hydrocolloids affected the Tp values of proteins differently; nevertheless, increasing the percentage of hydrocolloids used consistently showed significant effects. The fact that changes to the denaturation temperature occurred on addition of hydrocolloids was considered to be a sign of interactions between proteins and hydrocolloids; however, the FTIR results showed no new peaks formed for the samples produced with different hydrocolloids. Studies on the interactions between different hydrocolloids and meat proteins with DSC is a promising method and one for which analyses could be extended in further work. Furthermore, to eliminate the effect of other constituents, the proteins could be extracted and their interactions with individual additives be further investigated with DSC in order to understand the interactions more fully.
Acknowledgments
We would like to thank to Associate Professor Evren Çubukçu and Lütfiye Akın for the SEM analysis, and would like to thank Ayca Aylangan, PhD, for the FTIR analysis.
Funding
The research was financially supported by Hacettepe University, Research Center Office, Project No. 01001602002.
Additional information
Funding
References
- Andres, S.C.; Garcia, M.E.; Zaritzky, N.E.; Califano, A.N. Storage Stability of Low-Fat Chicken Sausages. Journal of Food Engineering 2006, 72, 311–319.
- Foegeding, E.A. Gelation in Meat Batters. Reciprocal Meat Conference Proceedings 1988, 41, 44–47.
- Marchetti, L.; Andrés, S.C.; Califano, A.N. Textural and Thermal Properties of Low-Lipid Meat Emulsions Formulated with Fish Oil and Different Binders. LWT–Food Science and Technology 2013, 51, 514–523.
- Cierach, M.; Modzelewska-Kapituła, M.; Szaciło, K. The Influence of Carrageenan on the Properties of Low-Fat Frankfurters. Meat Science 2009, 82, 295–299.
- Candogan, K.; Kolsarici, N. Storage Stability of Low-Fat Beef Frankfurters Formulated with Carrageenan Or Carrageenan with Pectin. Meat Science 2003, 64, 207–214.
- Garcia-Garcia, E.; Totosaus, A. Low-Fat Sodium-Reduced Sausages: Effect of the Interaction Between Locust Bean Gum, Potato Starch and κ-Carrageenan by a Mixture Design Approach. Meat Science 2008, 78, 406–413.
- de Vries, J. The Obesity Epidemic: Medical and Ethical Considerations. Science and Engineering Ethics 2007, 13(1), 55–67.
- Ahmed, P.O.; Miller, M.F.; Lyon, C.E.; Vaughters, H.M.; Reagan, J.O. Physical and Sensory Characteristics of Low-Fat Fresh Pork Sausage Processed with Various Levels of Added Water. Journal of Food Science 1990, 55(3), 625–628
- Claus, J.R.; Hunt, M.C.; Kastner, C.L. Effects of Substituting Added Water for Fat on the Textural, Sensory and Processing Characteristics of Bologna. Journal of Muscle Foods 1989, 1, 1–21.
- Eilert, S.J.; Blackmer, D.D.; Mandigo, R.W.; Calkins, C.R. Meat Batters Manufactured with Modified Beef Connective Tissue. Journal of Food Science 1993, 58(4), 691–696.
- Leteleir, V.; Kastner, C.L.; Kenney, P.B.; Kropf, D.H.; Hunt, M.C.; Garcia Zepeda, C.M. Flaked Sinew Addition to Low-Fat Cooked Salami. Journal of Food Science 1995, 60(2), 245–249.
- McMindes, M.K. Applications of Isolated Soy Protein in Low-Fat Meat Products. Food Technology 1991, 45(12), 61–64.
- Hughes, E.; Cofrades, S.; Troy, D.J. Effects of Fat Level, Oat Fibre and Carrageenan on Frankfurters Formulated with 5, 12 and 30 % Fat. Meat Science 1997, 45(3), 273–281.
- Lurueña-Martinez, M.A.; Vivar-Quintana, A.M.; Revilla, I. Effect of Locust Bean/Xanthan Gum Addition and Replacement of Pork Fat with Olive Oil on the Quality Characteristics of Low-Fat Frankfurters. Meat Science 2004, 68, 383–389.
- Smith, D.M. Meat Proteins: Functional Properties in Comminuted Meat Products. Food Technology 1988, 42(4), 116–121.
- Vega-Warner, V.; Merkel, R.A.; Smith, D.M. Composition, Solubility and Gel Properties of Salt Soluble Proteins from Two Bovine Muscle Types. Meat Science 1999, 51(3), 197–203.
- Ayadi, M.A.; Kechaou, A.; Makni, I.; Attia, H. Influence of Carrageenan Addition on Turkey Meat Sausages Properties. Journal of Food Engineering 2009, 93, 278–283.
- Baeza, R.I.; Carp, D.J.; Pérez, O.E.; Pilosof, A.M.R. κ-Carrageenan-Protein Interactions: Effect of Proteins on Polysaccharide Gelling and Textural Properties. Lebensmittel-Wissenschaft and Technologie 2002, 35, 741–747.
- Ibanoglu, E. Effect of Hydrocolloids on the Thermal Denaturation of Proteins. Food Chemistry 2005, 90, 621–626.
- Garnier, C.; Michon, C.; Durand, S.; Cuvelier, G.; Doublier, J.L.; Launay, B. Iota-Carrageenan/Casein Micelles Interactions: Evidence at Different Scales. Colloids and Surfaces B: Biointerfaces 2003, 31, 177–184.
- DeFreitas, Z.; Sebranek, J.G.; Olson, D.G.; Carr, J.M. Carrageenan Effects on Thermal Stability of Meat Proteins. Journal of Food Science 1997, 62(3), 544–547.
- Zhou, W.W.; Meng, L.; Li, X.; Ma, L.; Dai, R. Effect of the Interaction Between Carrageenan, Gellan Gum and Flaxseed Gum on Quality Attributes of Starch-Free Emulsion-Type Sausage. Journal of Muscle Foods 2010, 21, 255–267.
- Kibar, E.A.A.; Gönenç, I.; Us, F. Modeling of Retrogradation of Waxy and Normal Corn Starches. International Journal of Food Properties 2011, 14(5), 954–967.
- Li, J.Y.; Yeh, A. Functions of Starch in Formation of Starch/Meat Composite During Heating. Journal of Texture Studies 2002, 33, 341–366.
- Voutila, L.; Ruusunen, M.; Puolanne, E. Comparison of the Thermal Characteristics of Connective Tissue in Loose Structured and Normal Structured Porcine M. Semimembranosus. Meat Science 2002, 80, 1024–1030.
- Akkose, A.; Aktaş, N. Determination of Glass Transition Temperature of Beef and Effects Of Various Cryoprotective Agents on Some Chemical Changes. Meat Science 2008, 80, 875–878.
- Vural, H.; Oztan, A. Meat and Meat Products Quality Control Laboratory Applications. Hacettepe University Publications, Ankara, Turkey 1996; 36.
- Zayas, J.F.; Lin, C.S. Quality Characteristics of Frankfurters Containing Corn Germ Protein. Journal of Food Science 1988, 53, 1587–1591.
- Zayas, J.F.; Lin, C.S. Corn Germ Protein in Frankfurters; Textural, Color and Sensory Characteristics and Storage Stability. Journal of Food Quality 1989, 12, 283–289.
- Öztan, A.; Vural, H. Investigation of Water Holding Capacity and Free Water in Beef. Food 1993, 18(1), 29–33.
- Anonymous. Texture Analyser User Manual. “Warner Bratzler Shear Blade Set” Instructions. Ametek Lloyd Instruments Fareham: UK, 2003.
- Özvural, E.B.; Vural, H.; Özboy-Özbas, Ö. Utilization of Brewer’s Spent Grain in the Production of Frankfurters. International Journal of Food Science and Technology 2009, 44, 1093–1099.
- Anonymous. Turkish Food Codex, Meat and Meat Products Communique. Republic of Turkey, Ministry of Food, Agriculture and Livestock, Ankara, Turkey 2012; No. 2012/74).
- Wallingford, L.; Labuza, T.P. Evaluation of the Water Binding Properties of Food Hydrocolloids by Physical/Chemical Methods and in a Low-Fat Meat Emulsion. Journal of Food Science 1983, 48, 1–5.
- Lin, K.C.; Keeton, J.T.; Gilchrist, C.L.; Cross, H.R. Comparisons of Carboxymethyl Cellulose with Differing Molecular Features in Low-Fat Frankfurters. Journal of Food Science 1988, 53(6), 1592–1595.
- Crehan, C.M.; Hughes, E.; Troy, D.J.; Buckley, D.J. Effects of Fat Level and Maltodextrin on the Functional Properties of Frankfurters Formulated with 5, 12 and 30% Fat. Meat Science 2000, 55, 463–469.
- Svegmark, K.; Helmersson, K.; Nilsson, G.; Nilsson, P.O.; Andersson, R.; Svensson, E. Comparision of Potato Amylopectin Starches and Potato Starches Influence of Year and Variety. Carbohydrate Polymers 2002, 47, 331–340.
- Karlsson, M.E.; Eliasson, A.C. Gelatinization and Retrogradation of Potato (Solanum Tuberosum) Starch in Situ As Assessed by Differential Scanning Calorimetry (DSC). Lebensm.-Wiss. u.-Technology 2003, 36, 735–741.
- Tomšic, M.; Prossnigg, F.; Glatter, O. A Thermoreversible Double Gel: Characterization of a Methylcellulose and Κ-Carrageenan Mixed System in Water by SAXS, DSC and Rheology. Journal of Colloid and Interface Science 2008, 322, 41–50.
- Mundargi, R.C.; Patil, S.A.; Agnihotri, S.A.; Aminabhavi, T.M. Evaluation and Controlled Release Characteristics of Modified Xanthan Films for Transdermal Delivery of Atenolol. Drug Development and Industrial Pharmacy 2007, 33, 79–90.
- Chen, H.H.; Xu, S.Y.; Wang, Z. Interaction Between Flaxseed Gum and Meat Protein. Journal of Food Engineering 2007, 80, 1051–1059.
- Quinn, J.R.; Raymond, D.P.; Harwalker, V.R. Differential Scanning Calorimetry of Meat Proteins As Affected by Processing Treatment. Journal of Food Science 1980, 45, 1146–1149.
- Pighin, D.G.; Sancho, A.M.; Gonzalez, C.B. Effect of Salt Addition on the Thermal Behavior of Proteins of Bovine Meat from Argentina. Meat Science 2008, 79, 549–556.
- Aktaş, N.; Aksu, M.İ.; Kaya, M. Changes in Myofibrillar Proteins During Processing of Pastirma (Turkish Dry Meat Product) Produced with Commercial Starter Cultures. Food Chemistry 2005, 90, 649–654.
- Findlay, C.J.; Barbut, S. A Response Surface Investigation of the Effects of Sodium Chloride and Tripolyphosphate on the Thermal Properties of Beef Muscle. Meat Science 1992, 31, 155–164.
- Dickensen, E. Hydrocolloids at Interfaces and the Influence on the Properties of Dispersed Systems. Food Hydrocolloids 2003, 17, 25–39.
- Donatus, E.A.N.; Xiong, Y.L. Effects of Carrageenan on Thermal Stability of Proteins from Chicken Thigh and Breast Muscles. Food Research International 2001, 34, 247–253.
- Horn, M.M.; Martins, V.C.A.; de Guzzi Plepis, A.M. Interaction of Anionic Collagen with Chitosan: Effect on Thermal and Morphological Characteristics. Carbohydrate Polymers 2009, 77, 239–243.
- Aylangan, A. Investigation of effect of irradiation on quality characteristics, shelf life and determination of irradiation on hamburger meats. PhD Thesis, Hacettepe University, Institute of Science and Technology, 2010.
- Perisic, N.; Afseth, N.K.; Ofstad, R.; Kohler, A. Monitoring Protein Structural Changes and Hydration in Bovine Meat Tissue Due to Salt Substitutes by Fourier Transform Infrared (FTIR) Microspectroscopy. Journal of the Agricultural and Food Chemistry 2011, 59, 10052–10061.
- Fox, J.B.; Ackerman, S.A.; Jenkins, R.J. Effect of Anionic Gums on the Texture of Pickled Frankfurters. Journal of Food Science 1983, 48, 1031–1035.
- Whiting, R.C. Addition of Phosphates, Proteins and Gums to Reduced-Salt Frankfurter Batters. Journal of Food Science 1984, 49, 1355–1357.
- Foegeding, E.A.; Ramsey, S.R. Effect of Gums on Low-Fat Meat Batters. Journal of Food Science 1986, 51, 33–36.
- Ulu, H. Effects of Carrageenan and Guar Gum on the Cooking and Textual Properties of Low-Fat Meatballs. Food Chemistry 2006, 95, 600–605.
- Lin, K.W.; Chao, J.Y. Quality Characteristics of Reduced-Fat Chinese-Style Sausage As Related to Chitosan’s Molecular Weight. Meat Science 2001, 59, 343–351.