
ABSTRACT
Chlorogenic acids contribute great to the quality of green coffee bean extracts. In this article, the qualitative and quantitative analysis of multi-components by single-marker was proposed to simultaneously determine the contents of seven chlorogenic acids (3-CQA, 4-CQA, 5-CQA, 5-FQA, 3,4-diCQA, 3,5-diCQA, and 4,5-diCQA) in 14 samples of green coffee bean extract. 5-CQA was the single-mark to calculate the contents of chlorogenic acids with relative response factors. The reliability and stability of the relative response factors of chlorogenic acids were studied. Taguchi’s method with orthogonal array of L16 was applied in design of experiment and the minitab v16 software was used to analyze the relative response factors. The fluctuation and stability of the relative response factors were determined by analysis of variance statistical approach. The impact and optimization of columns and instruments were also studied by Taguchi Analysis. The combination of Venusil MP column and WUFENG instrument was chosen to determine the chlorogenic acids. As a comparison, the quantitative analysis of multi-components by multiple standards also had been done in this article. The compared results showed that there were no great differences in the contents of chlorogenic acids determined by quantitative analysis of multi-components by multiple standards and quantitative analysis of multi-components by single-marker with relative response factors obtained in this work.
Introduction
Coffee polyphenols are major bioactive compounds largely existing in green coffee bean extracts (GCBE). GCBE is prepared from unroasted coffee beans[Citation1] of Coffea arabica (an allotetraploid, accounts for 70% of the world’s coffee production)[Citation2] or Coffea canephora var. robusta (a diploid, represents approximately 30% of the coffee marketed worldwide)[Citation3] using suitable green solvents and other relevant process.
As a large source of antioxidant polyphenols,[Citation4–Citation11] GCBE as a dietary supplement of function foods and nutraceuticals, has many health benefits: antihypertension,[Citation12–Citation14] and body weight control.[Citation15] Also, the intake of GCBE has been identified to associate with a lower risk of diseases of oxidative etiology, which probably attribute to its high phenolic content.[Citation16] Coffee polyphenols called chlorogenic acids (CHA; chemical structures see ) are including neochlorogenic acid (3-CQA), cryptochlorogenic acid (4-CQA), chlorogenic acid (5-CQA), 5-feruloylquinic acid (5-FQA), 3,4-di-caffeoylquinic acid (3,4-diCQA), 3,5-di-caffeoylquinic acid (3,5-diCQA), and 4,5-di-caffeoylquinic acid (4,5-diCQA). CHA are cinnamic acid derivatives with biological effects mostly related to their antioxidant[Citation17] and anti-inflammatory activities.[Citation18]
Table 1. Chemical structures of seven chlorogenic acids.
To control the quality of GCBE, it is necessary that the determination of bioactive or healthy compositions in GCBE or final products were applied. The content of different compounds such as mycotoxins[Citation19] and caffeine[Citation20] in GCBE has been reported. Some of CHA have been determined in natural product.[Citation21] Green coffee extract was purified by the centrifugal partition chromatography method and the inclusion complexes of CHA with β-CD[Citation22] were confirmed by Electrospray Ionization Mass Spectrometry/Mass Spectrometry (ESI-MS/MS).[Citation23] The analysis of 5-CQA, caffeic acid and ferulic acid by high-performance thin-layer chromatography (HPTLC) and HPLC in GCBE[Citation24] have been studied. But it was only a brief introduction to qualitative determination of these three substances, and not clearly showed the results of the contents. Analysis of cholorogenic acids were studied by other methods, such as chromatography‐electrospray ionization‐tandem mass spectrometry[Citation25] and high-performance liquid chromatography–diode array detector (HPLC-DAD)–ESI/MSn method.[Citation26] Quantitative analysis of multi-components by multiple standards (QAMM) with HPLC is an accurate and simple way to simultaneously determine the amount of CHA.[Citation27] In the determination, multiple reference standards of CHA were essential. However, because of the limited availability and high cost of multiple reference standards, the application of QAMM in quality control of food and drug is limited. Using an easily available single component contained in analytes as a single-marker to determine multiple analogues with relative responses should be a practical method. However, it is restricted to wide application due to unknown fluctuation in relative response factors when it is performed in different experimental conditions. To evaluate the fluctuations of relative response factors, the study of relative response factors should be done. But few articles comprehensively studied the fluctuation and stability of the relative response factors.
In this work, the relative response factors of CHA were studied. Different kinds of LC columns and instruments were performed on the study of response factors. The fluctuation and stability of the relative response factors were determined by analysis of variance (ANOVA) statistical approach. Taguchi’s method[Citation28,Citation29] with orthogonal array of L16[Citation30] was applied in design of experiment (DOE). The impacts of LC columns and instruments to relative response factors were analyzed via Taguchi Analysis. Applicable column and instrument were chosen to determine the contents of CHA. Quantitative analysis of multi-components by single-marker (QAMS) was applied to simultaneously determine the contents of seven CHA in 14 samples of GCBEs by HPLC. 5-CQA was used as the single-marker to directly determine the content of 5-CQA by external standard method, and as the internal standard to calculate the contents of other six components in GCBE by relative response factors. As a comparison, QAMM also had been done in this article.
Materials and methods
Chemicals and samples
Reference standards of 3-CQA, 4-CQA, 5-CQA, 5-FQA, 3,4-diCQA, 3,5-diCQA, and 4,5-diCQA (more than 98% purity for all reference standards) were purchased from Jiangxi Tiangong Technology Co., Ltd. Analytical grade formic acid was purchased from Sinopharm Chemical Reagent Co., Ltd. Acetonitrile, of HPLC grade, was obtained from Meryer Chemical Technology Co., Ltd. High purity water was obtained by Millipore, Milli-Q (Bedford, MA, USA) purification system. Fourteen samples of GCBE collected from markets were supported by Skyherb Ingredients.
Instruments
Quantitative analyses were performed by Wufeng HPLC-100 system with two pumps (Wufeng, LC100) and a ultraviolet-visible (UV-Vis) spectrophotometric absorbance detector with variable detection wavelength. A Venusil MP column (250 × 4.6 mm, 5 µm) was used for separation. Grace Smart (250 × 4.6 mm, 5 µm), Agilent (250 × 4.6 mm, 5 µm), Promasil (250 × 4.6 mm, 5 µm), Kromasil (250 × 4.6 mm, 5 µm), Hedera ODS-2 (250 × 4.6 mm, 5 µm), Phenomenex-luna C18 (250 × 4.6 mm, 5 µm), Ultimate LP (250 × 4.6 mm, 5 µm) reverse C18 columns and SHIMADZU HPLC (SPD-20A) were also used in the study of the relative response factor of CHA. Ultrasonic bath (K250) was used for sample preparation. A CP 225D balance (Sartorius, Germany) was used to weigh the samples.
Chromatographic conditions
A gradient elution system has been developed for the separation of GCBE. The gradient elution was employed with two mobile phases. Mobile phase A was prepared by 250 mL of acetonitrile, 10 mL of formic acid and then diluted to 1000 mL with water. Mobile phase B was made by 100 mL of acetonitrile, 10 mL of formic acid and then diluted to 1000 mL with water. The two mobile phases were filtered through a 0.45 μm Millipore filter before used for HPLC analysis. A linear gradient program (100% B to 0% B over 20 min; hold at 0% B for 2 min, return to 100% B over 10 min. Re-equilibrated at 100% B for 8 min) was performed with the flow-rate at 1.0 mL/min. Considering the sensitivity of ultraviolet absorption of CHA and the interference of other substances, 328 nm was chosen as the detection wavelength. Twenty microliters of the solutions were injected into the column with the temperature set at 30°C.
Preparation of standard solutions
Fifteen milligrams of 3-CQA, 60 mg 5-CQA, 30 mg 4-CQA, 15 mg 5-FQA, 15 mg 3,4-diCQA, 15 mg 3,5-diCQA, and 15 mg 4,5-diCQA were weighed, put into a 25 mL amber volumetric flask and diluted to volume with the mobile phase B to form the standard mixture solution. The standard mixture solution was then serially diluted (dilution factor = 6.25, 8.3, 12.5, 25, 50) to form working solutions to establish calibration curves and to study the response factors.
Preparation of sample solutions
Sample solutions were prepared by placing 45 mg powder of GCBE into 50 mL amber volumetric flask with mobile phase B, sonicated for 30 min, allowed to cool to room temperature, and diluted to volume with mobile phase B. All sample solutions have been filtered through a 0.45 μm millipore filter before HPLC analysis.
Calculation of the relative response factors and the contents of CHA in GCBE samples
The relative response factors of the CHA performed on different LC columns and instruments were studied in this work. From the peak area of each chlorogenic acid in working solution on different LC columns and instruments, the relative response factors of the CHA were calculated by Eq. (1). To calculate the relative response factors of CHA, a suitable reference standard must be selected. 5-CQA, stable, easily obtained, and abundant in each sample, was chosen as the reference standard to calculate the factors of other six CHA. The data of Fx were listed in .
Table 2. The relative response factors of seven chlorogenic acids.
The concentration of the CHA (Cx) was calculated by the ratio between the responses of the CHA in sample solution (Ax) and the responses of 5-CQA in a unit concentration (A5-CQA/C5-CQA), and then calibrated by the relative response factor, Fx. The results were calculated by Eq. (2). The contents of seven CHA were showed in percentage (Eq. [3]). The results were listed in .
Table 3. Contents (%) of seven chlorogenic acids in samples of green coffee bean extractsc.
where A5-CQA and Ax represent the peak area responses of 5-CQA and the CHA in standard solutions or sample solutions. C5-CQA and Cx represent the concentration of 5-CQA and the CHA in standard solutions or sample solutions (mg/mL). wx represents the contents of CHA in samples of green coffee bean extracts (%), while V represents the volume of each sample solutions (mL) and m represents the mass of each sample (g).
Results and discussion
Chromatographic performance of working standard solution and sample solution
shows the chromatogram of seven CHA in working reference standard solution. From the figure, it can be seen that the separation of seven compounds performed well in such chromatographic conditions. The relative retention time (Tx) was the ratio of peak time between analyte (tx) and the single marker: 5-CQA (t5-CQA). Each peak in the sample solution was identified by comparing their relative retention time. indicates the chromatogram of seven compounds in one kind of GCBE sample. It can be seen that a good separation could be achieved within 40 min using the chromatographic conditions described above. The resolution of seven chromatographic peak in the sample solution was about 6.22, 2.32, 2.70, 1.68, 2.28, 3.81, and 2.74 corresponding to 3-CQA, 5-CQA, 4-CQA, 5-FQA, 3,4-diCQA, 3,5-diCQA, and 4,5-diCQA. According to the , there are some other peaks (between 3 and 4) and (between 4 and 5) with the chromatographic conditions obtained in this work. These are possibly other kinds of cinnamic acid derivatives (such as caffeoyltyrosine, caffeoyltryptophan, caffeoyl-feruloyl quinic acid, coumaroyl quinic acid…). These compounds are a mixture of minor compounds but they are totally measurable. However, only the main seven CHA were analyzed in this work.
Figure 1. Representative HPLC chromatograms. a: Working reference standards solution; b: Sample solution of GCBE (1) 3-CQA, (2) 5-CQA, (3) 4-CQA, (4) 5-FQA, (5) 3,4-diCQA, (6) 3,5-diCQA, (7) 4,5-diCQA.
Method validation
From the relevant chromatogram of working solution, the peak areas response of each reference standard versus its concentration can be obtained. Standard curves for each standard were made by plotting concentrations versus peak areas. The square of the correlation of coefficient (R2) were >0.98. The linear relationship, limit of detection (LOD), and limit of quantification (LOQ) were shown in . From , it can be seen that there were low LOQ of 3-CQA, 4-CQA, 5-CQA, 5-FQA with the range of 0.0012–0.0050 µg. In comparison, 3,4-diCQA, 3,5-diCQA, and 4,5-diCQA has a slightly higher LOQ at about 0.0130 µg.
Table 4. Liner range, liner equation, R2, limit of detection (LOD) and limit of quantification (LOQ).
The precision, repeatability experiments were studied, the results were listed in . Stabilities in three different days of samples were analyzed (,). The relative standard deviations (RSD) are less than 5%, precisions and stabilities were satisfactory. So, the method could be considered precise. As shown in , we have studied the recoveries of seven compounds of GCBE in one sample by spiking standards into sample. The recoveries of seven compounds were 96.0–105.9% with the RSD not more than 3.5%. The results indicated that the analytical method in this study was accurate for the determination of GCBE.
Table 5. The relative standard deviation of the precision and repeatability of each standard.
Table 6. Recoveries and relative standard deviations (RSD) of standard compounds (n=3).
Robustness test
To ensure the credibility of the experiment, different circumstances should be controlled. The content of CHA in GCBE were calculated by the relative response factors, so it is necessary to study the stability and fluctuation of relative response factors. LC columns impact the resolution and tailing factor, while the LC instrument may impact the peak areas. In this work, two LC instruments and eight kinds of columns (shown in ) were applied to study the relative response factors of seven CHA.
To evaluate the fluctuations and stabilities of the relative response factors, the two-way ANOVA statistical approach was used. F5-CQA, F3-CQA, F4-CQA, F5-FQA, F3,4-diCQA, F3,5-diCQA, and F4,5-diCQAversus LC columns and instruments were studied. The results of two-way ANOVA to relative response factors were in . It can be seen from that neither LC column nor instrument are significant factor (p > 0.05). It means that the response factors were fixed and stable. The residual plots for F3-CQA were showed in . The residual plots of F4-CQA, F5-FQA, F3,4-diCQA, F3,5-diCQA, and F4,5-diCQA were similar to the residual plots of F3-CQA. The regression line was built during the two variables-columns and instruments. From the normal probability plot, it can be seen that the regression line to the original observation value is good. The “bell” shape of histogram is symmetrical, it also confirmed the stability of the experiment. Versus fits and order plots showed the 16 points residuals of relative response factors distribute randomly at 0. All the residual plots showed the absolute values of the residuals had no abnormal values and with a good normal distribution, so the relative response factors of CHA were stable and potent.
Table 7. The results of two-way ANOVA to relative response factors.
Figure 2. Residual plots for F3–CQA.
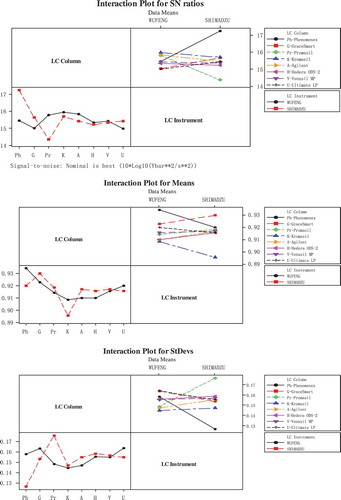
The related parameters-columns and instruments, were optimized by Taguchi Analysis. The response tables for signal to noise ratios (S/N), means and standard deviations showed in . The impact of columns (Delta = 1.27) is larger than instruments (Delta = 0.07) in S/N (Nominal is best (10*Log10 [Ybar**2/s**2]). For means and standard deviations (StDevs), columns (Delta = 0.025 and 0.02) were also have more great influence than instruments (Delta = 0.0007 and 0.001). The results clearly showed that the impact of columns is much more obvious than the instruments. Main effects plots () and interaction plots () of S/N, means, and StDevs were obtained by Taguchi Analysis. From , it is clearly could be seen that under the influence of columns the date means have a larger fluctuation. The result showed that the columns were the more significant factor, which was consistant with the response tables (). The main effects plots of means showed Promasil and Venusil MP columns were most close to the means, while the main effects plots of StDevs showed Venusil MP column was the best. The interaction of columns and instruments was showed in . From , we can see that the combination of Venusil MP column and WUFENG instrument were more close to the means and the standard deviations were smaller than the combination of Venusil MP column and SHIMADZU instrument. At last, WUFENG LC with Venusil MP column was chosen to determine the samples.
Table 8. The response tables for signal to noise ratios, means and standard deviations. Nominal is best (10*Log10(Ybar**2/s**2)).
Figure 3. Main effects plots for signal-to-noise ratios (SN ratios), means, and standard deviations (SDs).
Figure 4. Interaction plots for signal-to-noise ratios (SN ratios), means, and standard deviations (SDs).
Quantification of CHA in GCBE samples
The contents of 5-CQA, 3-CQA, 4-CQA, 5-FQA, 3,4-diCQA, 3,5-diCQA, and 4,5-diCQA in GCBE were determined in order to verify the reliability of QAMS. The contents of CHA were calculated by Eqs. (2) and (3). As a comparison, QAMM also had been done in this article. The results of QAMS and QAMM were showed in . From , it can be seen that 5-CQA account for most of total CHA, while 3,4-diCQA, 3,5-diCQA, and 4,5-diCQA account little in total CHA.
It can be seen from that the content of each chlorogenic acid in one sample had no great differences determined by QAMS and QAMM. The RSD of the results determined by QAMS and QAMM were no more than 5.0%. It illustrated that the calculation of the content of CHA in GCBE by QAMS was reliable and stable. According to this method, 5-CQA, the only standard reference, was chosen to determine different kinds of GCBE. The method was simple and operated. Each kind of GCBE has specific content of CHA. According to the results, we can easily decide which chlorogenic acid was added in GCBE additional, which could effectively control the quality of GCBE.
Conclusions
This work described the QAMS analysis of GCBE using 5-CQA as the single marker to calculate the content of CHA with relative factors. The two-way ANOVA statistical approach was used to evaluate the fluctuations and stabilities of the relative response factors, the result showed the relative response factors were fixed and would not be fluctuated with different LC columns and instruments. The residual plots showed the absolute values of the residuals had no abnormal values and with a good normal distribution, the relative response factors of CHA were stable and potent. The combination of Venusil MP column and WUFENG instrument were chosen as the optimized parameters by Taguchi Analysis to determine the CHA. On the base of reliable relative response factors and the optimized LC column and instrument, QAMS is feasible and simple to simultaneously determine the contents of seven CHA in 14 samples of GCBE compared with QAMM. The method was completely validated and reliable. This method was practical and useful in the related industry to analyze the CHA in GCBE.
Acknowledgments
The authors thank Zhejiang University for providing the necessary facilities to complete this work. The authors also thank the Skyherb Ingredients for supporting the samples.
Related Research Data
References
- Bicho, N.C.; Leitao, A.E.; Ramalho, J.C.; de Alvarenga, N.B.; Lidon, F.C. Identification of Chemical Clusters Discriminators of Arabica and Robusta Green Coffee. International Journal of Food Properties 2013, 16(4), 895–904.
- de Carvalho, K.; Petkowicz, C.L.O.; Nagashima, G.T.; Bespalhok, J.C.; Vieira, L.G.E.; Pereira, L.F.P.; Domingues, D.S. Homeologous Genes Involved in Mannitol Synthesis Reveal Unequal Contributions in Response to Abiotic Stress in Coffee Arabica. Molecular Genetics and Genomics 2014, 289(5), 951–963.
- Silva, A.D.A.; Pinho, D.B.; Costa, H.; Lopes, U.P.; Pereira, O.L. First Report of Leaf Spot Caused by Myrothecium Roridum on Coffea Canephora in Brazil. Plant Disease 2014, 98(11), 1587–1587.
- Higdon, J.V.; Frei, B. Tea Catechins and Polyphenols: Health Effects, Metabolism, and Antioxidant Functions. Critical Reviews in Food Science and Nutrition 2003, 43, 89–143.
- Moo-Huchin, V.M.; Moo-Huchin, M.I.; Estada-Leon, R.J.; Cuevas-Glry, L.; Estra-Mota, I.A.; Ortiz-Vazquez, E.; Betancur-Ancona, D.; Sauri-Duch, E. Antioxidant Compounds, Antioxidant Activity and Phenolic Content in Peel from Three Tropical Fruits Yucatan, Mexico. Food Chemistry 2015, 16, 17–22.
- Bouaziz, M.; Dhouib, A.; Loukil, S.; Boukhris, M.; Sayadi, S. Polyphenols Content, Antioxidant and Antimicrobial Activities of Extracts of Some Wild Plants Collected from the South of Tunisia. African Journal of Biotechnology 2009, 8(24), 7017–7027.
- Ben Ahmed, C.; Ben Rouina, B.; Sensoy, S.; Boukhriss, M.; Ben Adullah, F. Saline Water Irrigation Effects on Antioxidant Defense System and Proline Accumulation in Leaves and Roots of Field-Grown Olive. Journal of Agricultural and Food Chemistry 2009, 57, 11484–11490.
- Durak, A.; Gawlik-Dziki, U.; Pecio, L. Coffee with Cinnamon-Impact of Phytochemicals Interactions on Antioxidant and Anti-Inflammatory in Vitro Activity. Food Chemistry 2014, 16, 81–88.
- Lee, M.E.; Kim, E.; Liu, Y.; March, J.C.; Bentley, W.E.; Payne, G.F. Rapid and Repeatable Redox Cycling of An Insoluble Dietary Antioxidant: Electrochemical Analysis. Journal of Agricultural and Food Chemistry 2014, 62(40), 9760–9768.
- Aladedunye, F.; Matthaus, B. Phenolic Extracts from Sorbus Aucuparia (L.) and Malus Baccata (L.) Berries: Antioxidant Activity and Performance in Rapeseed Oil During Frying and Storage. Food Chemistry 2014, 159, 273–281.
- Sulaiman, S.F.; Ooi, K.L. Antioxidant and Alpha-Glucosidase Inhibitory Activities of 40 Tropical Juices from Malaysia and Identification of Phenolics from the Bioactive Fruit Juices of Barringtonia Racemosa and Phyllanthus Acidus. Journal of Agricultural and Food Chemistry 2014, 62(39), 9576–9585.
- Suzuki, A.; Kagawa, D.; Ochiai, R.; Tokimitsu, I.; Saito, I. Green Coffee Bean Extract and Its Metabolites Have a Hypotensive Effect in Spontaneously Hypertensive Rats. Hypertension Research 2002, 25, 99–107.
- Watanabe, T.; Arai, Y.; Mitsui, Y.; Kusaura, T.; Okawa, W.; Saito, I. The Blood Pressure-Lowering Effect and Safety of Chlorogenic Acid from Green Coffee Bean Extract in Essential Hypertension. Clinical and Experimental Hypertension 2006, 28, 439–449.
- Yamaguchi, T.; Chikama, A.; Mori, K.; Watanabe, T.; Shioya, Y.; Katsuragi, Y.; Tokimitsu, I. Hydroxyhydroquinone-Free Coffee: A Double-Blind, Randomized Controlled Dose-Response Study of Blood Pressure. Nutrition, Metabolism and Cardiovascular Diseases 2008, 18(6), 408–414.
- Vinson, J.A.; Burnham, B.; Nagendran, M.V. Randomized Double-Blind Placebo-Controlled Crossover Study to Evaluate the Efficacy and Safety of a Green Coffee Bean Extract in Overweight Subjects. Diabetes, Metabolic Syndrome and Obesity: Targets and Therapy 2012, 5, 21–27.
- Baeza, G.; Amigo-Benavent, M.; Sarria, B.; Goya, L.; Mateos, R.; Bravo, L. Green Coffee Hydroxycinnamic Acids But Not Caffeine Protect Human HepG2 Cells Against Oxidative Stress. Food Research International 2014, 62, 1038–1046.
- Park, Y.S.; Namiesnik, J.; Vearasilp, K.; Leontowicz, H.; Leontowicz, M.; Barasch, D.; Nemirovski, A.; Trakhtenberg, S.; Gorinstein, S. Bioactive Compounds and the Antioxidant Capacity in New Kiwi Fruit Cultivars. Food Chemistry 2014, 165, 354–361.
- Farah, A.; Monteiro, M.; Donangelo, C.M.; Lafay, S. Chlorogenic Acids from Green Coffee Extract Are Highly Bioavailable in Humans. The Journal of Nutrition 2008, 138(12), 2309–2315.
- Vaclavik, L.; Vaclavikova, M.; Begley, T.H.; Krynitsky, A.J.; Rader, J.I. Determination of Multiple Mycotoxins in Dietary Supplements Containing Green Coffee Bean Extracts Using Ultrahigh-Performance Liquid Chromatography-Tandem Mass Spectrometry (UHPLC-MS/MS). Journal of Agricultural and Food Chemistry 2013, 61(20), 4822–4830.
- Salinas-Vargas, M.E.; Canizares-Macias, Maria P. On-Line Solid-Phase Extraction Using a C18 Minicolumn Coupled to a Flow Injection System for Determination of Caffeine in Green and Roasted Coffee Beans. Food Chemistry 2014, 147, 182–188.
- Nakatani, N.; Kayano, S.; Kikuzaki, H.; Sumino, K.; Katagiri, K.; Mitani, T. Identification, Quantitative Determination, and Antioxidative Activities of Chlorogenic Acid Isomers in Prune (Prunus Domestica L.). Journal of Agricultural and Food Chemistry 2000, 48(11), 5512–5516.
- Budryn, G.; Nebesny, E.; Rachwał-Rosiak, D.; Pałecz, B.; Hodurek, P.; Miśkiewicz, K.; Oracz, J.; Żyżelewicz, D. Inclusion Complexes of β-Cyclodextrin with Chlorogenic Acids from Crude and Purified Aqueous Extracts from Green Robusta Coffee Beans (Caffea Canephora L.). Food Research International 2014, 61, 202–213.
- Kelebek, H.; Kesen, S.; Selli, S. Comparative Study of Bioactive Constituents in Turkish Olive Oils by LC-ESI/MS/MS. International Journal of Food Properties 2015, 18(10), 2231–2245.
- Urakova, I.N.; Pozharitskaya, O.N.; Shikov, A.N.; Kosman, V.M.; Makarov, V.G. Comparison of High Performance TLC and HPLC for Separation and Quantification of Chlorogenic Acid in Green Coffee Bean Extracts. Journal of Separation Science 2008, 31(2), 237–241.
- Matsui, Y.; Nakamura, S.; Kondou, N.; Takasu, Y.; Ochiai, R.; Masukawa, Y. Liquid Chromatography-Electrospray Ionization‐Tandem Mass Spectrometry for Simultaneous Analysis of Chlorogenic Acids and Their Metabolites in Human Plasma. Journal of Chromatography B 2007, 858(1), 96–105.
- Gouveia, S.C.; Castilho, P.C. Validation of a HPLC-DAD–ESI/MSn Method for Caffeoylquinic Acids Separation, Quantification and Identification in Medicinal Helichrysum Species from Macaronesia. Food Research International 2012, 45, 362–368.
- Schrader, K.; Kiehne, A.; Engelhardt, U.H.; Gerhard Maier, H. Determination of Chlorogenic Acids with Lactones in Roasted Coffee. Journal of the Science of Food and Agriculture 1996, 71, 392–398.
- Es’haghi, Z.; Heidari, T.; Mazloomi, E. In Situ Pre-Concentration and Voltammetric Determination of Trace Lead and Cadmium by a Novel Ionic Liquid Mediated Hollow Fiber-Graphite Electrode and Design of Experiments via Taguchi Method. Electrochimica Acta 2014, 147, 279–287.
- Engin, A.B.; Ozdemir, O.; Turan, M.; Turan, A.Z. Color Removal from Textile Dyebath Effluents in a Zeolite Fixed Bed Reactor: Determination of Optimum Process Conditions Using Taguchi Method. Journal of Hazardous Materials 2008, 159, 348–353.
- Elizalde-González, M.P.; García-Díaz, L.E. Application of a Taguchi L16 Orthogonal Array for Optimizing the Removal of Acid Orange 8 Using Carbon with a Low Specific Surface Area. Chemical Engineering Journal 2010, 163, 55–61.