
ABSTRACT
Quality of cookies is profoundly influenced by the physicochemical and rheological properties of wheat grains. Therefore, it is pivotal to explore right choice of wheat cultivar. Current study was designed to gauge the relationship between wheat grain physiognomies and flour rheological behaviour with cookie characteristics. The outcomes depicted that selected wheat varieties varied significantly (p < 0.01) in various parameters like thousand kernel weight, test weight, pearling value, Pelshenke and zeleny value. In correlation, particle size index correlated negatively (r = −0.67) with protein content and positively with water absorption. Spread factor of cookies was influenced by particle size index (r = −0.63), Pelshenke (r = −0.62), water absorption (r = −0.60), and mixographic peak height (r = 0.85). Principal component analysis illustrated that thousand kernel weight, grain length, and width were major components in determining the water absorption of wheat flour. However, spread factor of cookies was partly depicted from Pelshenke value and partly from particle size index.
Introduction
Wheat (Triticum aestivum L.) shares 723 million tones among 2525 million tones production of cereals.[Citation1] Wheat holds major part up to 44% in human diet that acmes it higher rank than other cereals.[Citation2] In Pakistan, wheat is major indispensable food in the form of various products. Various wheat varieties developed in different parts of the world differ in terms of yield, quality of grains, and resistance against insects/pests. Numerous factors like, protein content, hardness, cultivar type, season, and growing conditions are linked to the functionality of flour obtained from wheat varieties.[Citation3] It is estimated that 80% of wheat production is used in unleavened flat bread which is locally known as “chapatti” and other similar products, while 20% is used in bakery products like bread, cakes, pastries, and cookies.[Citation4]
Cookies market in 2011 constituted USD 44,944 million and expected to be more than USD 53,454 million in 2016.[Citation5] Quality of the cookies is primarily based on the nature and quantity of ingredients used. Flour is the key ingredient that has a substantial effect on the quality attributes of baked stuffs. Functionality of flour is affected by many factors like quality and quantity of protein, genotype, season, and conditions of cultivation. Properties of flour dough are prejudiced by protein fractions and glutenin subunits.[Citation3,Citation6] Essential functionality of wheat flour dough like extensibility and elasticity is due to the gluten proteins of wheat grains that make 80–85% of the total protein.[Citation4]
Diameter (D) of cookies is dependent on the availability of moisture to non-gluten constituent of flour which helps in determining the onset spread of cookies.[Citation7] Different studies carried out by various analysts affirm that the grain hardness (particle size index, PSI) of wheat is related essentially with protein content, moisture content, and size of the kernels.[Citation8] Iranian wheat cultivars have been found to contain 7.83–14.98% proteins,[Citation9] and a comparable study reported that protein substance in six most predominant Pakistani wheat cultivars extended from 11.99% to 13.80%.[Citation10] The relationship between protein content and the PSI is unpredictable as PSI amplified with the rise of protein content in a few cultivars, while in some different cultivars it declined with the increase of protein. Higher protein of wheat flour tended to disturb the tenderness and spread factor (SF). However, moisture content (6–18%) indicated a profoundly positive relationship with PSI for delicate wheat cultivars.[Citation11,Citation12] Among physical attributes of wheat, test weight (TW) positively correlated with thousand kernel weight (TKW) (r = 0.66) and negatively correlated with gluten (r = −0.75) and protein (r = −0.83).[Citation13]
Pakistani wheat varieties are classified into hard and soft wheat on the basis of PSI, pearling value (PV), NIR hardness, biochemical and genetic basis.[Citation8] Besides, a comprehensive quantitative and subjective depiction of the impacts of flour ingredients, quality of cookies still remains uncertain to a great extent because of numerous unpredictable collaborations among the flour constituents.[Citation14] The purpose of this study was to examine the suitability of wheat varieties for product, that is cookies and to correlate physical and rheological parameters of wheat varieties through principal component analysis (PCA).
Materials and methods
Procurement of raw material
Commercially available varieties of wheat (T. aestivum L.), “Punjab 2011”, “Millat 2011”, and “Galaxy 2013”, were procured from Wheat Research Institute, Ayub Agricultural Research Institute Faisalabad, Punjab, and three wheat varieties, “SKD-1”, “Hamal”, and “Imdad” from Wheat Research Institute Sakrand, Nawabshah, Sindh, Pakistan.
Physical characteristics
The axial dimensions, namely length (L) and width (W) of 20 grains from each variety were measured by using Vernier calliper having 0.01 mm least count.[Citation15] TKW and TW were determined by following the guidelines of AACC.[Citation16] TKWs were recorded in grams per 1000 kernel, representative sample, that is 50 g of each wheat variety was drawn randomly and TKW was recorded by counting and weighing the clean, unbroken, and sound kernels. The TW of six wheat varieties was recorded by using Schopper Chondrometer (OHAVS, Chicago) and expressed in kilogram per hectoliter (kg/hl) according to the procedure outlined in AACC[Citation16] method number 55-10. Accordingly, sufficient grains were placed in hopper to ensure that kettle overflows. Then hopper was set over kettle, with outlet directly over centre, and allowed the grains to flow into kettle. Excess grains were removed with stroker, and stroker was placed on edge of kettle. Afterwards, kettle was hanged on beam, balanced, and weight was recorded.
Particle size index
Grain hardness of all selected wheat varieties was determined in terms of PSI according to AACC[Citation16] method number 55-30. A 10 g sample was taken and sieved through U.S. no. 200 sieve, accompanied with fitted pan. Then the sample was shaken in sieve for exactly 10 min on sieve shaker with percussion. Any fines adhering to bottom of sieve were brushed into bottom receiving pan and weighed to obtain weight of through. PSI was calculated by using formula given below:
Pearling value
The PV of each sample was estimated by pearling 20 g of wheat grains for 60 s in a barley pearler and then weighing the pearled grains by following the procedure as described by Pasha.[Citation17]
Zeleny value
The zeleny sedimentation of each wheat variety was determined by running the grains through Brabender Kernalyzer (Omeg. Analyzer, Bruins Instruments, Germany) according to the method devised by Pasha.[Citation17]
Milling of wheat
The wheat grains from each variety, tempered at 14% moisture level were milled on Buhler mill into 13 fractions, that is 4 break flour, 5 middlings, 2 tailings, 1 reduction, and 1 low-grade flour. All these fractions were combined to get straight grade flour.[Citation18]
Proximate analysis
Chemical analyses, that is moisture (method number 44-15A), ash (method number 08-01), fat (method number 30-10), fibre (method number 32-10), and protein content (method number 46-10) of wheat flour was carried out according to their respective methods described in AACC.[Citation16] Wet and dry gluten contents in different flour samples were determined by hand washing method as detailed in AACC[Citation16] method number 38-10.
Pelshenke value
The Pelshenke value gives an estimation about wheat gluten strength through gas production and retention capacity of the wheat carbohydrate/protein complex. The whole wheat flour of each wheat variety was tested for Pelshenke value according to AACC (2000) method number 56-50. A dough ball was prepared using a suspension of baker’s yeast in water. The dough ball was placed in beaker having 120 mL water at 30°C in water bath. By fermentation, CO2 was produced within the dough ball. The gluten formed in the dough trapped the gas, which was retained and the ball floated to the surface. The gas pressure became too high with a passage of time and the dough ball broke up and fell to the bottom of the beaker. The difference between time of immersion and disintegration of dough ball was recorded as Pelshenke value in minutes.
Rheological behaviour
Mixographs were recorded electronically using a 10 g bowl (National Mfg. Co. Lincoln, NE, USA) with the spring fixed at 10th position in the scale. For the construction of mixograms, the moisture and protein contents of the samples were determined according to the method as described in AACC.[Citation16] Dough mixing properties of wheat flour were analysed using 50 g Brabender Farinograph (Germany) on 14% moisture basis according to the methods of AACC.[Citation16] The parameters studied were water absorption (WA), dough development time (DDT), mixing tolerance index (MTI), softening of dough (SoD), and dough stability (DS).
Preparation of cookies
Cookies were prepared by following the method 10.50D as described in AACC[Citation16] with some modifications. The basic ingredients used were flour 250 g, sugar 125 g, shortening 125 g, baking powder 1.5 g, eggs 45 g, and water 10–15 mL. After making dough in mechanical mixer (Hobart A200) for 15 min, pieces were cut by a die and baked in oven at 175–180°C for 20–30 min.
Physical analysis of cookies
The diameter and thickness of cookies were measured by following the procedure of Kaur et al.[Citation3], six cookies were placed edge to edge and total diameter (CD) was measured in centimetres by using a ruler. The cookies were rotated at an angle of 90° for duplicate reading. This act was repeated thrice and average CD was reported in millimetres. Similarly, six cookies were kept on top of one another and total height was measured in millimetres with Vernier calliper. This practice was repeated thrice to get an average value and results were recorded in centimetres as thickness (CT). The SF was measured by taking ratio of cookie diameter (CD) and cookie thickness.
Textural hardness of cookies was evaluated according to Piga et al.[Citation19] using Texture Analyzer (TA-XT2, Plus, Stable Microsystems, Surrey, UK) interfaced with a computer. To compare the hardness and fracturability of cookies, 2 mm cylinder probe (P/2) using 5 kg load cell equipped with heavy duty platform (HDP/90) was used and for the data analysis, the Texture Exponent 32 programme, version 4.0.9.0, was used. Three repeated measurements were taken for every formulation, and mean values were calculated.
Sensory evaluation
Sensory attributes of cookies were evaluated in scores by following the method explained by Lawless and Heymann.[Citation20] The sensory evaluation of cookies was carried out by a panel of eight members (male = 5, female = 3) from National Institute of Food Science and Technology, University of Agriculture, Faisalabad. Panellists were 24–40 years of age with sound health and good sensory perceptions. Cookies were characterized in terms of colour, flavour, taste, texture, and overall acceptability by using nine-point hedonic scale. The evaluation was carried out in a well-ventilated, odourless, and quiet environment.
Statistical analysis
All analyses were carried out in triplicate and the data were reported as means ± standard deviation. Significant difference among treatments was evaluated through analysis of variance (ANOVA) under completely randomized design (CRD) according to the methods described by Montgomery.[Citation21] Means ± standard deviation and graphs were computed through Microsoft Excel, version 2013. However, ANOVA and PCA were applied through JMP, version 10 (Statistical Discovery Software) from SAS.
Results and discussion
Physical characteristics
Wheat varieties have been evaluated for physical parameters like grain length (L), width (W), TKW, and TW. Results depicted that TKW and TW vary significantly (p < 0.01), while L and W non-significantly (p < 0.05) in selected wheat varieties. Highest values of L, W, TKW, and TW were 6.63 ± 0.047 mm (SKD-I), 3.47 ± 0.023 mm (SKD-I), 41.61 ± 1.460 g (Galaxy 2013), and 77.83 ± 1.650 kg/hl (SKD-I), respectively, while the lowest values were 6.27 ± 0.041 mm (Hamal), 3.21 ± 0.025 mm (Imdad), 32.83 ± 1.590 g (Hamal), and 72.20 ± 1.600 kg/hl (Galaxy 2013), respectively (). The results regarding L and W are in line with the findings of Iqbal et al.,[Citation22] who reported that Pakistani wheat varieties ranged from 5.39 to 6.11 mm and 3.09 to 3.19 mm in terms of L and W, respectively. TKW and TW are potential indicators of milling yield, and grading of the wheat grains is merely dependent on TW because it provides basis for wheat selling. The significant variation in TKW and TW might be due to the environmental and genotypic variation that existed in wheat cultivars. Previously, Khan et al.,[Citation4] reported that TKW ranged from 28 to 40 g and TW ranged from 66 to 78 kg/hl in different Pakistani spring wheat varieties. Similarly, Butt et al.,[Citation23] Safdar et al.,[Citation13] Keskin and Ozkaya,[Citation24] and Kasraei et al.[Citation15] evaluated physical characteristics of different wheat varieties and concluded that genetic make-up and environmental conditions during growing season are major contributor for these variations.
Table 1. The mean values of different quality parameters of grains and flours of different spring wheats.
Particle size index
PSI is an indicator of wheat hardness, and results depicted that PSI varied significantly (p < 0.01) among wheat varieties and values ranged from 23.02 ± 1.704 to 32.14 ± 1.629% in “Punjab 2011” and “Hamal”, respectively (). Results indicated that “Punjab 2011” and “Imdad” are harder varieties as compared with other varieties evaluated in this study. Pasha[Citation17] evaluated 50 wheat varieties and observed that PSI ranged from 16.33 to 30.33%. Butt et al.[Citation23] found PSI in the range of 17.32–24.41% after evaluating 30 Pakistani wheat varieties, and Anjum and Ahmad[Citation25] concluded that Pakistani wheat varieties fell into the category of semi-hard group. The correlation of PSI and protein showed a significant (p < 0.05) but negative relation (r = −0.67) as illustrated in . Result portrayed that PSI varied accordingly with the variation in protein but in reverse fashion, showing wheat varieties with high protein content would have lower PSI. It can be explained that wheat varieties having low protein could be milled into fine particles, while varieties having high protein would resist milling process and produce flour having coarser particles (lower PSI). Such a negative correlation between PSI and protein was also observed by Kasraei et al.[Citation15] after correlating the results of 10 Iranian wheat varieties. They observed lower value of PSI in wheat varieties which had more protein content (fell under category of hard wheat).
Figure 1. Mixograms of selected spring wheats.
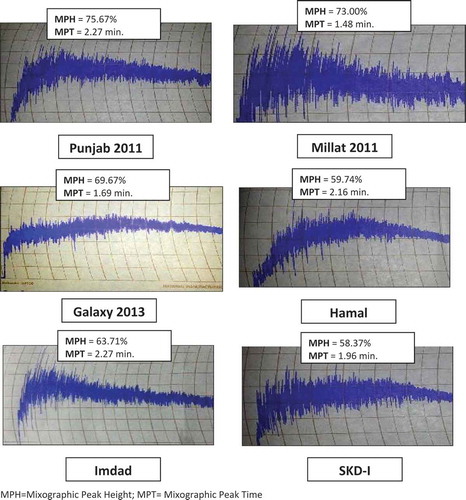
Figure 2. Scatterplots regarding relationship of cookies with different rheological and physical parameters.
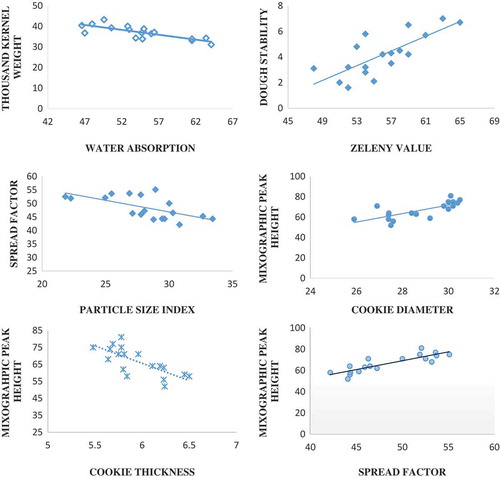
Figure 3. A graph showing correlation between PSI and protein of different wheat cultivars.
Pearling and zeleny value
Results regarding PV and zeleny value (ZV) have been presented in , showing significant (p < 0.01) variation among selected wheat varieties with respect to these traits. The PV ranged from 56.1 ± 8.517% (SKD-I) to 93.8 ± 6.072% (Millat 2011), likewise, ZV ranged from 51.3 ± 3.055 (Hamal) to 62.3 ± 3.055 (Imdad). PV indicates the hardness of wheat varieties contributed by the bindings of grain components with each other. The current results are similar to the findings of Pasha,[Citation17] who found that PV ranged from 62% to 87% in different Pakistani wheat varieties. The differences in the present results may be due to the difference in shape of the grains, as angular grains are more easily pearled than rounded grains, and may appear to be softer than they are, by the pearling test.[Citation8] Anjum and Walker[Citation10] found that hardness of wheat kernels were influenced by cultivar type, area, and years. Quality of gluten is expressed on the basis of ZV as higher quantity and quality of gluten results in higher ZV. Higher quantity and better quality of gluten content resulted in higher sedimentation and increased ZV.[Citation26,Citation27] This variation may be attributed to genetic variation in the tested wheat varieties. Current results revealed that five varieties showed ZV more than 55 and only “Millat 2011” showed ZV less than 55.
Chemical characteristics of wheat flour
Mean values of Pelshenke test showed non-significant (p > 0.05) variation among selected wheat varieties (), the highest mean value was 94.62 ± 12.635 min observed in “Imdad”, while lowest value was 82.65 ± 3.603 min observed in “Galaxy 2013”. Wheat researchers mostly use this parameter to find out the gluten strength of their varieties, as higher Pelshenke value indicated high quality/amount of gluten. Among selected wheat varieties, “Millat 2011” showed 29.11 min (Pelshenke value), while all other varieties demonstrated Pelshenke value more than 36 min. The current results are in accordance to the previous results which indicated that Pakistani wheat varieties showed Pelshenke value in the range of 51–108 min.[Citation4] Genotype had a strong influence on Pelshenke value which tended to increase with the late application of nitrogen and sulphur containing fertilizers. In addition to protein content, the environment appears to affect the composition and quality of other wheat flour components that affect Pelshenke value to an extent that overshadows the quantitative and qualitative effect of protein.[Citation28] Therefore, the results suggested that gluten strength was not only an inherit character but it also affected by non-genetic factors.
The statistical results regarding wet and dry gluten content of different wheat varieties in showed non-significant (p > 0.05) variation. The wet and dry gluten content ranged from 30.1% to 34.9% and 10.1% to 11.7%, respectively. The highest value of wet and dry gluten contents (34.9% and 11.7%, respectively) was observed in “Millat 2011”, while lowest value (30.1% and 10.1%, respectively) was observed in “Galaxy 2013”. The results of different wheat varieties relating to wet and dry gluten contents are comparable with the results of Randhawa et al.[Citation29] and Khan et al.[Citation4] who reported that wet and dry gluten contents ranged from 26.40% to 38.41% and 8.40% to 11.41%, respectively, in different wheat varieties. Miralbés[Citation30] viewed wet gluten contents in the range of 15.6–39.3%, and Lin et al.[Citation31] reported wet gluten contents in the range of 20.5–45.6% and dry gluten contents in the range of 8.44–11.77%. The protein contents have direct correlation with the gluten contents which was influenced by environmental conditions such as temperature, rainfall, and humidity.[Citation32]
Proximate composition of wheat varieties
As far as proximate composition of wheat varieties is concerned, non-significant (p > 0.05) results were observed except moisture and NFE contents which exhibited significant (p < 0.05) variation (). The highest mean values of moisture, crude fat, ash, protein, fibre, and NFE were 11.83 ± 0.711%, 1.28 ± 0.286%, 0.95 ± 0.023%, 13.07 ± 1.033%, 1.15 ± 0.168%, and 75.99 ± 0.431%, respectively. Moisture content determines the storability of wheat grains and play a role in determining the margin of profit in milling. Difference in moisture content might be due to the difference in climate and post-harvest practices. Similarly, NFE varied significantly due to the significant variation in moisture content of wheat cultivars. Current results regarding moisture and NFE are in close proximity of Ahmad et al.,[Citation33] who observed significant variation in these characters. Findings of proximate composition of wheat varieties are in accordance with the results of previous researchers who evaluated various Pakistani wheat varieties in different physicochemical aspects and expressed that range of proximate composition was 11.46–12.45% (crude protein), 1.50–1.55% (ash), 1.95–2.95% (crude fat), 1.25–1.40% (crude fibre), and 71.56–74.17% (NFE), respectively.[Citation4,Citation8,Citation29,Citation34]
Rheological properties of wheat flour
Rheological characteristics of wheat flour were determined through farinographic and mixographic studies, and results are presented in and graphical view of mixograph is accessible in . It disclosed significant (p < 0.01) variation among wheat varieties in terms of WA, DDT, DS, MTI, and SoD having values ranging from 48.07 to 63.00%, 1.87 to 3.27 min, 2.30 to 7.13 min, 445.67 to 488.33 BU, and 91 to 188.33 BU (Brabender unit), respectively. WA, DDT, and DS were directly correlated to flour quality, suggesting that good-quality flour (suitable for bread) would possess higher values for all these parameters, while SoD is negatively correlated to quality of wheat flour, suggesting that flour with higher SoD value would be low in quality. Singh et al.[Citation35] found a positive correlation of DS with end bakery products and concluded that varieties having lower value of DS are suitable for preparation of biscuit and cookies. The current outcome is correlated with the findings of Mohammed et al.,[Citation36] who measured rheological behaviour of composite wheat flour and found that WA, DDT, DS increased and SoD decreased with the addition of high protein containing chickpea flour in wheat flour. Brorsen et al.[Citation37] evaluated hard red wheat samples of 4 years crop and concluded that water absorption was significantly affected by hardness of wheat kernels. Water absorption is one of the important characters of wheat and positively affected by hardness (based on protein content) of wheat cultivars.[Citation38]
Furthermore, dough rheology of each wheat variety observed through mixograph and results regarding MPT and MPH specified in indicate significant (p < 0.05) variation in terms of MPH and MPT. The values of wheat varieties ranged from 1.48 to 2.27 min (MPT) and 58% to 75.67% (MPH); and among selected wheat varieties, “Punjab 2011” showed higher MPH and “SKD-I” showed lower value. Mixographic parameters are directly related with flour quality, as good-quality flour (higher protein and gluten) produces dough having higher MPH and MPT. Anjum and Walker[Citation10] studied mixographic peak time and peak height of different Pakistani wheat varieties and observed that variation in mixographic parameters was due to genotypic and environmental diversity. They found that MPT ranged from 1.9 to 5.0 min and MPH from 43.4% to 51.5% in selected Pakistani wheat varieties. MPT is an indicator of time required for the dough development (DDT) and it ranged from 2.55 to 6.97 min.[Citation35]
Physical characteristics of cookies
Cookies prepared from different wheat varieties were used to measure hardness using texture analyser, while SF was calculated by dividing diameter over thickness, measured by Vernier calliper. Cookies prepared from flour of different wheat varieties did not show significant variation in terms of physical measurements. Six cookies were used in calculating diameter and thickness of cookies and resultant values ranged from 26.73 to 30.30 cm (D) and 5.66 to 6.31 cm (T), respectively (). Hardness and SF ranged from 3.27 to 3.50 and 43.50 to 53.50, respectively. It depicted that dough of all selected wheat varieties showed similar behaviour in baking. Variation in SF is due to the variation in diameter and thickness of cookies, which are further affected by some intrinsic factors, that is protein/gluten content of flour and ingredients used in the preparation of cookies, mainly fat and sugar. It was reported that higher fat levels increase the oil phase in baking, which, in turn, increases mobility in the system, and as a consequence, results in a higher spread rate.[Citation39,Citation40] Beside these, another factor is viscosity and mobility of dough as gravity and the amount of leavening agents are constant, the flow of the dough controls the viscosity. Similarly, the dough viscosity controls spread rate of cookies, as amount of leavening agent and gravity are constant factor in all cookies.[Citation41]
In terms of hardness, cookies prepared from flour of “Imdad” showed less value of hardness which may be due to the lower protein content of that variety than others. Hardness of the cookies is affected by amount and distribution of bran particles in the matrix and have negative correlation with them. Less amount of bran particles mixed well in dough matrix and produced cookies with hard texture, while higher amount of bran particles tend to produce soft-texture cookies.[Citation42]
Sensory evaluation
Results regarding sensory evaluation of cookies presented that cookies prepared from each variety vary non-significantly (p > 0.05) in terms of colour, taste, and flavour, while significantly (p < 0.05) with respect to texture and overall acceptability (). Range of scores regarding colour, flavour, and taste were ranged from 6.33 to 7.00, 6.67 to 7.17, and 5.83 to 7.00, respectively. However, as far as texture is concerned cookies prepared from “Millat” got highest score (7.75), while cookies prepared from “Hamal” got least score (5.42). Similar trend of highest score was observed in overall acceptability where cookies prepared from “Millat” got highest score, while cookies prepared from “Punjab 2011” got least score. Hardness of cookies is partly dependent on water absorption of wheat flour, that is flour of good quality (high protein) would absorb more water and would produce cookies of hard texture.[Citation43] Another reason might be the gluten quality and quantity[Citation44] varied due to intrinsic characters of wheat that ultimately were affected by genotype and growth environment.[Citation45]
Correlation among physicochemical and rheological characteristics with characteristics of cookies
Values of correlation coefficient (r) among studied parameters, summarized in , reflect the ratio of explained variation to that of total variation. For example if r = 0.70, it means that 70% of variation in dependent variable is due to independent variable. It was clear from the results that the cookies’ characteristics CD, CT, and SF were significantly (p < 0.05) correlated to PSI, Pelshenke value, and WA of the grain and flour characteristics. Cookie diameter (CD) was negatively correlated to PSI (r = −0.49), to Pelshenke value (r = −0.59), and to WA (r = −0.48); however, CT was positively correlated to PSI (r = 0.62), to Pelshenke value (r = 0.47), and to WA (r = 0.56). Similarly, cookie SF was correlated negatively to PSI (r = −0.63), to Pelshenke value (r = −0.62), and to WA (r = −0.60). Rheological characteristics (farinographic and mixographic) also showed a good response to explain the characteristics of cookies, that is hardness, CD, CT, and SF. Hardness of the cookies depicted significant (p < 0.01) but negative correlation (r = −0.63) with MPH. It means that flour having high value of MPH would produce cookies having less hardness. MPH is an indicator of gluten (network) strength and it showed a positive relation with cookie thickness and factors, while negative to CD (). It can be suggested from the results that flour showing high value of MPH would produce cookies broader in length and less in height. In this case, increase in SF is merely due to decrease in thickness of cookies, as cookie thickness had an inverse relation with SF of cookies. ZV exhibited significant (p < 0.01) correlation with Pelshenke (r = 0.48), DDT (r = 0.67), DS (r = 0.76), and negative relation with SoD (r = −0.69) which can be viewed in . It means that wheat varieties having higher ZV tend to produce dough having high stability. Significant (p < 0.05) negative correlation (r = −0.48) of PV was observed with Pelshenke value. Among grain characteristics, TKW had negative correlation with TW (r = −0.67), WA (r = −0.79), and significant (p < 0.05) but positive correlation with SF (r = 0.47) of cookies. The relation of SF with TKW was not much stronger to predict the trend of final product just from TKW. L (mm) of the grain was positively correlated to W (mm) (r = 0.70) and ZV (r = 0.48), meaning that long grains would have high ZV as they contained higher amount of endosperms in them. Positive correlation (r = 0.876, p < 0.005) of grain diameter was observed with TKW, meaning that varieties having higher grain diameter would have higher TKW.[Citation3,Citation46] PSI showed significant (p < 0.05) and negative correlation (r = −0.67) with protein contents of wheat varieties, and portrayed that with increase in protein contents the PSI reduced ().[Citation15]
Table 2. Correlation among studied parameters.
PCA
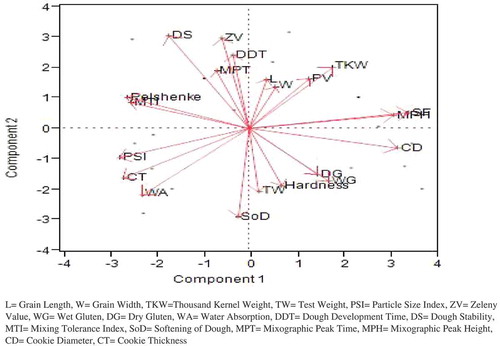
Different grain characteristics, flour rheological properties, and cookie characteristics are studied through PCA to get outline of relationship among these parameters. The loading plot () depicted the liaison of these parameters with each other. PCA showed principal component 1 (PC1) accounted for 27.65% of variation with MPH, SF, and PSI being the major factors. PSI and WA were closely located on the same side of the loading plot indicating major contributors of dough strength, while DG, WG, and hardness were located closely on the other side of the loading plot. The results depicted that there was no direct relation of DG and WG in the development of strong dough with high MPH and in the textural hardness of cookies. Principal component 2 (PC2) accounted for 24.46% variation with flour rheological properties, that is DDT, ZV, DS, and MPT being the major contributors. It was clear from that wheat varieties with high value of TW would produce dough having stability against mixing, high DDT, and more water absorption. Principal component 3 attributed 10.77% alteration in computed data, with Pelshenke value, MTI, and CD being the major contributors. TKW, PV, L (mm), and W (mm) were closely located on opposite side of WA, indicating that there was direct positive relation between water absorption, PV, and TKW. MPH and SF were closely located to each other on one side but opposite to PSI (which was on the other side), indicating that flour of wheat varieties having high value of PSI would produce dough with more height in mixograph and cookies with increased SF (due to larger particle size). It also indicated the resistance provided by the dough during mixing up to development of gluten network. Pelshenke value and MTI of wheat flour were closely located to each other on one side of the plot indicating that both impart same effect on CD, which was on opposite side of the plot. Katyal et al.[Citation46] concluded that during PCA, grain diameter (D) and TKW lie close to each other on same side of the plot indicating non-significant difference between them. Similarly, Kaur et al.[Citation47] applied PCA on different physical and rheological parameters of wheat varieties and concluded that wheat varieties with increased hardness would produce flour having coarser particles that in turn produce dough having high DDT.
Figure 4. Bi-plot regarding the relationship of wheat grains, flour rheological properties with cookie making potential of different wheat cultivars.
Conclusion
It was concluded that cookies prepared from “Millat 2011” showed best results in sensory evaluation and other rheological parameters. Protein showed a strong negative correlation with PSI of different wheat varieties. Wheat varieties showed a significant difference in TKW, TW, PSI, Pelshenke value, and rheological traits (mixographic and farinographic studies). SF of cookies was influenced by PSI, Pelshenke value, WA, and mixographic peak height. PCA depicted that TKW, length (L), and width (W) were major components in determining the water absorption and rheological properties of wheat flour. MPH and SF were closely located to each other on one side but opposite to PSI (which was on the other side), indicating that flour of wheat varieties having high value of PSI would produce dough with more height in mixograph and cookies with increased SF (due to larger particle size). However, SF of cookies was partly depicted from Pelshenke value and partly from PSI.
Acknowledgments
The authors are obliged to Higher Education Commission (HEC) for providing full support in conducting this research and Wheat Research Institute, Ayub Agricultural Research Institute, Faisalabad, Punjab, and Wheat Research Institute Sakrand, Nawabshah, Sindh, for providing wheat varieties.
References
- FAOSTAT. 2016. http://Www.Fao.Org/Worldfoodsituation/Csdb/En/ (accessed March 28, 2016).
- Uthayakumaran, S.; Wrigley, C. Wheat: Characteristics and Quality Requirements. In Cereal Grains Assessing and Managing Quality; Woodhead Publishing Limited, India. 2010; 59–111.
- Kaur, A.; Singh, N.; Ahlawat, A.K.; Kaur, S.; Singh, A.M.; Chauhan, H.; Singh, G.P. Diversity in Grain, Flour, Dough and Gluten Properties amongst Indian Wheat Cultivars Varying in High Molecular Weight Subunits (Hmw-Gs). Food Research International 2013, 53, 63–72.
- Khan, M.R.; Anjum, F.M.; Zahoor, T.; Nawaz, H. Biochemical and Technological Characterization of Pakistani Spring Wheats. Pakistan Journal of Agricultural Science 2009, 46, 271–279.
- MarketLine. 2013. http://Www.Reuters.Com/Article/Market-Publishers-Idusnbw076574a+100+Bsw20130507 (accessed Mar 28, 2016).
- Nadeem, M.; Anjum, F.M.; Khan, M.R.; Sajjad, M.; Hussain, S.; Arshad, M.S. Electrophoretic Characteristics of Gluten Proteins as Influenced by Crop Year and Variety. International Journal of Food Properties 2016, 19, 897–910.
- Pareyt, B.; Van Steertegem, B.; Brijs, K.; Delcour, J.A. The Role of Gluten Proteins in Production and Quality of a Yeast Leavened Sugar and Fat Rich Wheat Based Food Model System – 2. Impact of Redox Agents. Food Research International 2015, 67, 169–174.
- Pasha, I.; Anjum, F.M.; Morris, C.F. Grain Hardness: A Major Determinant of Wheat Quality. Food Science and Technology International 2010, 16, 511–522.
- Majzoobi, M.; Farahnaky, A.; Amiri, S. Physicochemical Characteristics of Starch Component of Wheat Flours Obtained from Fourteen Iranian Wheat Cultivars. International Journal of Food Properties 2011, 14, 685–696.
- Anjum, F.; Walker, C. Grain, Flour and Bread‐Making Properties of Eight Pakistani Hard White Spring Wheat Cultivars Grown at Three Different Locations for 2 Years. International Journal of Food Science and Technology 2000, 35, 407–416.
- Saiedirad, M.; Tabatabaeefar, A.; Borghei, A.; Mirsalehi, M.; Badii, F.; Varnamkhasti, M.G. Effects of Moisture Content, Seed Size, Loading Rate and Seed Orientation on Force and Energy Required for Fracturing Cumin Seed (Cuminum Cyminum Linn.) under Quasi-Static Loading. Journal of Food Engineering 2008, 86, 565–572.
- Yücel, C.; Baloch, F.S.; Özkan, H. Genetic Analysis of Some Physical Properties of Bread Wheat Grain (Triticum aestivum L. Em Thell). Turkish Journal of Agriculture and Forestry 2009, 33, 525–535.
- Safdar, M.N.; Naseem, K.; Amjad, M.; Mumtaz, A.; Raza, S. Physiochemical Quality Assessment of Wheat Grown in Different Regions of Punjab. Pakistan Journal of Agricultural Research 2009, 22, 18–23.
- Fustier, P.; Castaigne, F.; Turgeon, S.L.; Biliaderis, C.G. Flour Constituent Interactions and Their Influence on Dough Rheology and Quality of Semi-Sweet Biscuits: A Mixture Design Approach with Reconstituted Blends of Gluten, Water-Solubles and Starch Fractions. Journal of Cereal Science 2008, 48, 144–158.
- Kasraei, M.; Nejadi, J.; Shafiei, S. Relationships between Grain Physicochemical and Mechanical Properties of Some Iranian Wheat Cultivars. Journal of Agricultural Science and Technology 2015, 17, 635–647.
- AACC. Approved Methods of the American Association of Cereal Chemists; AACC International, St. Paul, MN, U.S.A., 2000.
- Pasha, I. Biochemical Characterization of Pakistani Wheats in Relation to Grain Hardness; University of Agriculture: Faisalabad, 2006, 33–36.
- Fustier, P.; Castaigne, F.; Turgeon, S.L.; Biliaderis, C.G. Semi-Sweet Biscuit Making Potential of Soft Wheat Flour Patent, Middle-Cut and Clear Mill Streams Made with Native and Reconstituted Flours. Journal of Cereal Science 2007, 46, 119–131.
- Piga, A.; Catzeddu, P.; Farris, S.; Roggio, T.; Sanguinetti, A.; Scano, E. Texture Evolution of “Amaretti” Cookies During Storage. European Food Research and Technology 2005, 221, 387–391.
- Lawless, H.T.; Heymann, H. Scaling. In: Sensory Evaluation of Food: Principles and Practices; Springer Science Business Media, Dordrecht Heidelberg London, 2010.
- Montgomery, D. Experiments with a Single Factor: The Analysis of Variance. In: Design and Analysis of Experiments; John Wiley & Sons, Inc., Hoboken, New Jersey, USA. 2008.
- Iqbal, Z.; Pasha, I.; Abrar, M.; Masih, S.; Hanif, M.S. Physico-Chemical, Functional and Rheological Properties of Wheat Varieties. Journal of Agricultural Research 2015, 53, 253–267.
- Butt, M.S.; Anjum, F.M.; Van Zuilichem, D.J.; Shaheen, M. Development of Predictive Models for End‐Use Quality of Spring Wheats through Canonical Analysis. RaInternational Journal of Food Science & Technology 2001, 36, 433–440.
- Keskin, S.; Ozkaya, H. Effect of Storage and Insect Infestation on the Technological Properties of Wheat. CyTA-Journal of Food 2015, 13, 134–139.
- Anjum, F.M.; Ahmad, I.; Butt, M.S.; Sheikh, M.; Pasha, I. Amino Acid Composition of Spring Wheats and Losses of Lysine During Chapati Baking. Journal of Food Composition and Analysis 2005, 18, 523–532.
- Igrejas, G.; Guedes-Pinto, H.; Carnide, V.; Clement, J.; Branlard, G. Genetical, Biochemical and Technological Parameters Associated with Biscuit Quality. Ii. Prediction Using Storage Proteins and Quality Characteristics in a Soft Wheat Population. Journal of Cereal Science 2002, 36, 187–197.
- Branlard, G.; Dardevet, M.; Saccomano, R.; Lagoutte, F.; Gourdon, J. Genetic Diversity of Wheat Storage Proteins and Bread Wheat Quality. In Wheat in a Global Environment; Bedo, Z.; Lang, L.; Eds.; Kluwer Academic Publishers: Netherland, 2001; 157–169.
- Luo, C.; Branlard, G.; Griffin, W.B.; McNeil, D.L. The Effect of Nitrogen and Sulphur Fertilisation and Their Interaction with Genotype on Wheat Glutenins and Quality Parameters. Journal of Cereal Science 2000, 31, 185–194.
- Randhawa, M.A.; Anjum, F.M.; Butt, M.S. Physico-Chemical and Milling Properties of New Spring Wheats Grown in Punjab and Sind for the Production of Pizza. International Journal of Agriculture & Biology 2002, 4, 482–484.
- Miralbés, C. Prediction Chemical Composition and Alveograph Parameters on Wheat by near-Infrared Transmittance Spectroscopy. Journal of Agricultural and Food Chemistry 2003, 51, 6335–6339.
- Lin, P.F.; Chiang, S.H.; Chang, C.Y. Comparison of Rheological Properties of Dough Prepared with Different Wheat Flours. Journal of Food and Drug Analysis 2003, 220–225.
- Ćurić, D.; Karlović, D.; Tušak, D.; Petrović, B.; Đugum, J. Gluten as a Standard of Wheat Flour Quality. Food Technology and Biotechnology 2001, 4, 353–361.
- Ahmad, I.; Ashraf, M.; Saeed, M. Profile Analysis (Tpa) of Cakes Supplemented with Soy Flour. Pakistan Journal of Science 2010, 62, 22–26.
- Safdar, M.N.; Naseem, K.; Siddiqui, N.; Amjad, M.; Hameed, T.; Khalil, S. Quality Evaluation of Different Wheat Varieties for the Production of Unleavened Flat Bread (Chapatti). Pakistan Journal of Nutrition 2009, 8, 1773–1778.
- Singh, N.; Kaur, A.; Katyal, M.; Bhinder, S.; Ahlawat, A.K.; Singh, A.M. Diversity in Quality Traits Amongst Indian Wheat Varieties Ii: Paste, Dough and Muffin Making Properties. Food Chemistry 2016, 197, 316–324.
- Mohammed, I.; Ahmed, A.R.; Senge, B. Dough Rheology and Bread Quality of Wheat–Chickpea Flour Blends. Industrial Crops and Products 2012, 36, 196–202.
- Brorsen, B.W.; Rayas-Duarte, P.; Ji, D. Predicting Rheological Properties of Wheat Dough Based on Wheat Characteristics. Journal of Agricultural Science 2012, 4, 79.
- Amjad, M.; Safdar, M.N.; Mumtaz, A.; Naseem, K.; Raza, S.; Khalil, S. Comparison of Different Wheat Varieties Grown in Punjab for Leavened Flat Bread (Naan) Production. Pakistan Journal of Nutrition 2010, 9, 146–150.
- Khouryieh, H.; Aramouni, F. Physical and Sensory Characteristics of Cookies Prepared with Flaxseed Flour. Journal of the Science of Food and Agriculture 2012, 92, 2366–2372.
- Nawaz, M.A.; Fukai, S.; Bhandari, B. Effect of Different Cooking Conditions on the Pasting Properties of Flours of Glutinous Rice Varieties from Lao Pdr. International Journal of Food Properties 2015, 19, 2113–2126.
- HadiNezhad, M.; Butler, F. Effect of Flour Type and Dough Rheological Properties on Cookie Spread Measured Dynamically During Baking. Journal of Cereal Science 2009, 49, 178–183.
- Sozer, N.; Cicerelli, L.; Heiniö, R.-L.; Poutanen, K. Effect of Wheat Bran Addition on In Vitro Starch Digestibility, Physico-Mechanical and Sensory Properties of Biscuits. Journal of Cereal Science 2014, 60, 105–113.
- Ajila, C.M.; Leelavathi, K.; Prasada Rao, U.J.S. Improvement of Dietary Fiber Content and Antioxidant Properties in Soft Dough Biscuits with the Incorporation of Mango Peel Powder. Journal of Cereal Science 2008, 48, 319–326.
- Barak, S.; Mudgil, D.; Khatkar, B.S. Relationship of Gliadin and Glutenin Proteins with Dough Rheology, Flour Pasting and Bread Making Performance of Wheat Varieties. LWT - Food Science and Technology 2013, 51, 211–217.
- Kaya, Y.; Akcura, M. Effects of Genotype and Environment on Grain Yield and Quality Traits in Bread Wheat (T. aestivum L.). Food Science and Technology (Campinas) 2014, 34, 386–393.
- Katyal, M.; Virdi, A.S.; Kaur, A.; Singh, N.; Kaur, S.; Ahlawat, A.K.; Singh, A.M. Diversity in Quality Traits amongst Indian Wheat Varieties I: Flour and Protein Characteristics. Food Chemistry 2016, 194, 337–344.
- Kaur, A.; Singh, N.; Kaur, S.; Ahlawat, A.K.; Singh, A.M. Relationships of Flour Solvent Retention Capacity, Secondary Structure and Rheological Properties with the Cookie Making Characteristics of Wheat Cultivars. Food Chem 2014, 158, 48–55.