
ABSTRACT
Boletus edulis and Boletus tomentipes are two well-known mushroom species which are widely consumed in Yunnan province due to their high nutritional and medicinal values. Fourier transform mid-infrared spectroscopy can determine exclusive spectra fingerprint of a sample and further analyse its quality when combined with appropriate chemometrics. In this study, identification and discrimination of B. edulis and B. tomentipes mushrooms from different geographical locations were performed based on Fourier transform mid-infrared spectroscopy and chemometrics. Principal component analysis, hierarchical cluster analysis, and partial least squares discriminant analysis allowed us to identify and discriminate mushroom samples depending on their unique metabolic spectral fingerprints. The range of 1800–400 cm−1, which exhibited major characteristics of mushroom samples was selected for next analysis. The unsupervised principal component analysis and hierarchical cluster analysis showed that mushroom samples from different geographical locations could be effectively identified. Furthermore, the supervised partial least squares discriminant analysis method was used to predict unknown mushroom samples successfully based on developed calibration model. In conclusion, these results indicated that Fourier transform mid-infrared technique combined with appropriate chemometrics can be used as an effective and rapid strategy for quality control of B. edulis and B. tomentipes mushrooms with respect to their geographical locations. In addition, this technique also can be applied in other mushroom species for this purpose when coupled with reasonable chemometrics.
Introduction
In recent years, there has been sustaining increase of commercial interest in mushrooms in pharmaceutical and food industries due to their wide usages as both food and medicine in many countries.[Citation1] So far, a great amount of benefits of wild-grown mushrooms have been associated to the life of human. For example, most wild-grown mushrooms are rich in polysaccharides, proteins, amino acids, vitamins, and minerals, which can provide a high nutritional value for health.[Citation2,Citation3] In addition, many fungi have been proved to possess the immunomodulatory, anti-neoplastic, and antioxidant activities because of their basic metabolic constituents.[Citation4–Citation6] Therefore, there is a growing concern on the quality of edible mushrooms over the world due to their unique nutritional and medicinal values.
Boletus edulis and Boletus tomentipes belonging to genus Boletus are two well-known edible mushrooms which mainly grow in Yunnan province of China at the altitudes of 1000–2200 m, while B. edulis is also abundant and widely consumed in Europe.[Citation7] To our best knowledge, these two fungi have higher economic value due to their high nutrition, delicious flavour, and considerable production in Yunnan province. According to modern nutritional and pharmacological studies, these species can also exhibit some features of the functional food because of their anti-oxidant, anti-tumour, and anti-diabetic functions, since abundant polysaccharide compounds have been isolated.[Citation8–Citation10] However, the natural sources of these mushrooms are always widely distributed under different surrounding conditions, and many factors such as precipitation, temperature, and parasitic plant may lead to the variation of nutritional and medicinal components.[Citation11,Citation12] For instance, Yang et al.[Citation12] have developed ultraviolet (UV) spectroscopy to analyse the difference of B. tomentipes mushrooms from different geographical locations effectively. In addition, according to previous literatures, some trace elements in these two mushrooms also showed obvious variations depending on their sites and especially most hazardous elements such as Hg, Cd, Pb.[Citation13,Citation14] In some natural sites which are impacted by industrial production, the mushrooms may be contaminated seriously with hazardous elements. Therefore, geographical locations may have an important influence on both the quality and safety of these mushrooms.
At present, some appearance features, in particular texture and colour, are always related to the consumption of mushrooms, and therefore in the markets they are priced and graded according to these visual observations.[Citation15] However, this strategy may be too subjective to estimate the intrinsic quality which is determined by many bioactive metabolites, such as polysaccharides and proteins. On the other hand, many instrumental methods, such as gas chromatography-mass spectrometry and molecular methods also have been developed for identification of fungi samples.[Citation16–Citation18] However, these methods are expensive, complicated, and time-consuming. Therefore, a novel, reliable, and rapid analytical method suited for quality control of B. edulis and B. tomentipes remains a call urgently.
To the best of our knowledge, spectroscopic techniques can present a rapid, simple, and low-cost approach to classify samples of any type, in terms of the vibrations and rotations of special molecular structures.[Citation19] Among them, Fourier transform mid-infrared (FT-MIR) spectroscopy is an effective tool which can scan the overall chemical composition of a sample in the mid-infrared region (4000–400 cm−Citation1) and thus the metabolic fingerprint created by this technique can represent sample’s authentic quality.[Citation20–Citation22] However, these spectral fingerprints cannot be identified directly only by visual inspection due to a large amount of variables. The chemometrics including supervised and non-supervised methods which have been subjected to an increased application in recent years can be used for the interpretation and evaluation of such amounts of data.[Citation23] In general, principal component analysis (PCA), hierarchical cluster analysis (HCA), and partial least squares discriminant analysis (PLS-DA) are the most common chemometrics for analysing these spectra fingerprints.[Citation24–Citation26] Up to now, FT-MIR spectroscopy coupled to chemometrics has been applied to determinate geographical locations of foods and medicines widely, demonstrating that this technique can be used as a promising technique for this aim. For example, the rapid identification of fresh and frozen chicken has been achieved based on FT-MIR and chemometrics successfully by Grunert and collaborators.[Citation24] What’s more, Zhao et al.[Citation27] also have applied FT-MIR spectroscopy in combination with chemometrics to discriminate Gentiana rigescens Franch materials from different geographical origins effectively. However, according to previous literatures, there has been no report on the identification and discrimination of wild-grown B. edulis and B. tomentipes samples from different geographical locations using FT-MIR spectroscopy and chemometrics.
Starting from these considerations, the aim of this study was to give a complete metabolic fingerprint of these mushroom samples, and further investigating the feasibility of FT-MIR spectroscopy and chemometrics (PCA, HCA, and PLS-DA) for the identification and discrimination of wild-grown B. edulis and B. tomentipes mushrooms from different geographical locations. This study may provide a rapid and reliable method in the practice of quality control of mushrooms.
Materials and methods
Samples preparation
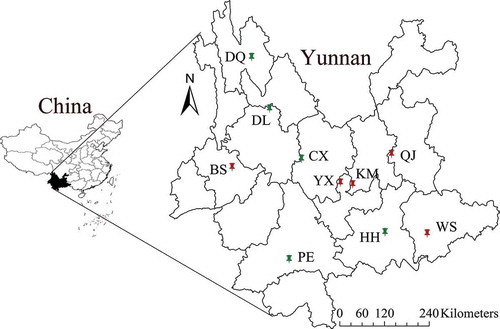
In this study, a total of 60 fruiting bodies of wild-grown B. edulis and B. tomentipes mushrooms were collected in July 2014 and 2015 from 10 localities in Yunnan province, China. The details of these experimental materials are displayed in and . In the laboratory, these mushroom materials were dried in a drying oven at 60°C to constant weight. Subsequently, all samples were pulverised using a grinder (Tianjin Huaxin Instrument Factory, China) and sieved by an 80 μm mesh. Finally, the powder of experimental samples was stored for further analysis.
Table 1. Information about B. edulis and B. tomentipes mushrooms from different geographical locations.
Figure 1. Geographical locations of B. edulis and B. tomentipes mushrooms.
Instruments and reagents
The FT-MIR spectrometer (PerkinElmer, USA) equipped with a DTGS detector was used to scan the spectra data of mushroom samples. The spectral range was 4000–400 cm−1 with resolution of 4 cm−1. For each spectrum, a total of 64 scans were performed in this study. KBr which was analytical grade was purchased from Fengchuan Fine Chemical Research Institute (Tianjin, China).
FT-MIR spectra acquisition
The powder of each sample (1.5 ± 0.2 mg) and KBr (100 ± 2 mg) was weighed by the electronic balance (Precisa, Switzerland). They were mixed uniformly and then pressed into a tablet using the tablet press (Shanghai Shanyue Instrument, Inc., China). Then, the tablet was scanned by FT-MIR spectrometer. Background absorptions which were caused by H2O and CO2 were deducted automatically when scanning the samples. Each sample was scanned in triplicate, and the average spectrum was calculated for next analysis.
Chemometrics
Prior to chemometrics analysis, the pretreatment methods were performed on these raw spectra by software of OMNIC (version 8.2, Thermo Fisher Scientific, Inc., USA). Among them, baseline correction was used for obtaining an excellent visual classification.[Citation28] Second derivation (SD) was applied to eliminate the overlap peaks and baseline shifts.[Citation29] Multiplicative scatter correction (MSC) was used to eliminate the noise signal caused by light scattering effect of particles.[Citation30]
PCA is one of the most used unsupervised pattern recognition algorithms, which can provide a visual overview of similarities and differences among objective samples.[Citation31] Based on dimensionality reduction, this method can transform large amounts of original variables into some new variables, which are known as principal components (PCs).[Citation32] In addition, the PC loadings are applied to evaluate the contribution of these spectra information to PCA classification.[Citation32] In this study, the first two PCs were used to present the overall clustering trends of mushroom samples from different geographical locations and the PC loadings were used to exhibit some meaning variables related to this identification.
HCA is also an unsupervised chemometrics which is applied widely for clustering. This method also can classify different samples into groups according to similarities and differences among objective samples.[Citation33] As a consequence, samples divided into the same groups are similar, whereas samples in different groups are different. Compared with PCA, this method can present the relationships of different samples more directly and clearly by observing a dendrogram in this study.
PLS-DA is one of the most popular supervised discriminant classification techniques, which is widely used in previous studies.[Citation25,Citation27] In these studies, this method was applied to screen the variables that make more contribution to the discrimination from the spectra data (X) according to their maximum covariance with a defined group (Y). In general, Y defined as 1 indicates that this sample belongs to specific group, whereas Y defined as 0 shows that this sample does not belong to this group. In general, establishment of a suitable calibration is critical step for predicting unknown samples. Thereby, some parameters, such as coefficient of determination (RCitation2), root mean square error of estimation (RMSEE), and root mean square error of cross validation (RMSECV), were used to evaluate the performance of calibration model. For unknown sample, predicted value between 0.5 and 1.5 is considered as the correct recognition. In our study, PLS-DA was used to discriminate mushroom samples from different geographical locations, and further predicting unknown mushroom samples based on developed calibration model. All chemometrics methods in this paper were carried out by the software of SIMCA (version 13.0, Umetrics, Umeå, Sweden).
Results and discussion
Analysis of original spectra
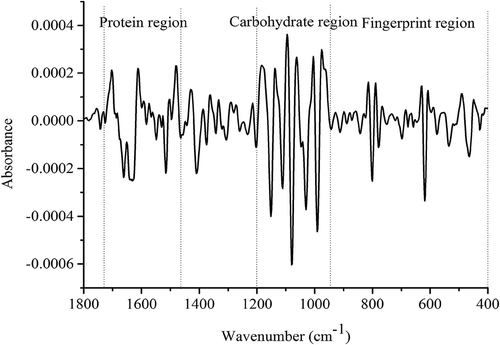
In this study, 60 FI-MIR spectra of these two mushroom species (30 of B. edulis and 30 of B. tomentipes) were obtained and average spectra are presented in . These spectra can give overall and comprehensive metabolic fingerprints of B. edulis and B. tomentipes mushrooms. The band between 3500 and 3200 cm−Citation1 which may be caused by strong water absorption mainly represents the O–H stretching.[Citation25] The region of 3100–2800 cm−Citation1 is mainly related to fatty acids and the obvious absorption peak at 2928 cm−Citation1 in this range expresses stretch of methylene group of lipid.[Citation27] In addition, a weak peak around 2855 cm−Citation1 may be caused by pyranose ring.[Citation34] According to previous literatures, the band of 1700–1000 cm−Citation1 is the dominating region which is attributed by organic material in macrofungi.[Citation34,Citation35] Among them, the peak around 1650 cm−Citation1 is mainly caused by protein amide II and the band around 1550 cm−Citation1 belongs to protein amide II absorption.[Citation36,Citation37] Hence, this region of 1720–1480 cm−Citation1 is highly relevant to protein substances. Both major peaks around 1085 and 1030 cm−Citation1 are assigned to C–C stretching which is attributed as structures of chitin.[Citation38] The chitin is the main structural polysaccharide compounds in mushrooms and therefore, the region of 1200–950 cm−Citation1 mainly corresponds to the absorptions of carbohydrate.[Citation39] Besides, the peak at 1408 cm−Citation1 which is attributed to C–O–H and C–H bending may be the result of pyranose ring.[Citation34] Weak band around 1310 cm−Citation1 is due to C–O–H and CH2 bending may come from pyranose ring too.[Citation34] As mushrooms are always rich in protein and carbohydrate compounds[Citation2,Citation3] and in order to remove the interference of H2O absorption, the region of 1800–400 cm−Citation1 is selected for next chemometrics analysis. The average spectrum (B. edulis) which is preprocessed by MSC and 2D is shown in . However, just by visual inspection, it may be difficult to identify the B. edulis and B. tomentipes samples from different geographical locations. Hence, appropriate chemometrics may be needed to achieve the identification and discrimination aim.
Figure 2. Original spectra of B. edulis and B. tomentipes mushrooms.
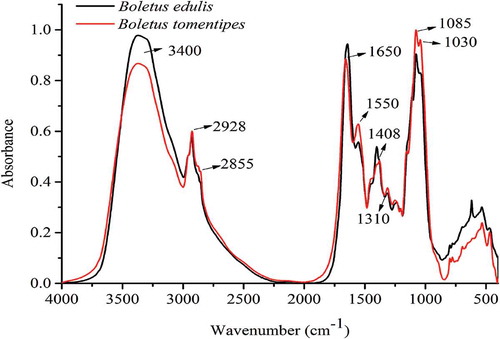
Figure 3. Preprocessed spectrum of B. edulis mushroom by 2D and MSC.
Unsupervised PCA and HCA
In order to present the difference among mushroom samples, PCA was first carried on to identify B. edulis and B. tomentipes mushrooms from different geographical locations, respectively. The classification result of B. edulis samples is shown in . The PC 1 makes the highest variance contribution of 37.2% and the PC 2 makes second variance contribution of 21.3% for this identification. It can be seen from that these five geographical locations (BS, WS, KM, YX, and QJ) of B. edulis are determined successfully. This result demonstrates that the variation of metabolic profile among B. edulis samples is obvious according to their geographical locations. In addition, by preliminary observation, samples from YX and BS locations have a closer relationship compared with other three places (KM, WS, and QJ), which is separated by PC 2, showing that the quality of B. edulis from YX and BS localities may be similar. As can be seen from , the KM, WS, and QJ localities are located in the eastern part of Yunnan province. This can demonstrate that there is a close relation between the quality of mushrooms and their geographical locations. However, sampling locations of KM and YX have the nearest distance (), whereas B. edulis mushrooms from these areas show a more obvious separation in . This appearance also indicates that besides the geographical location, many other factors such as soil and symbiotic plant[Citation40] may have an influence on the quality of these mushrooms.
Figure 4. PCA score plots of B. edulis (A) and B. tomentipes samples (B).
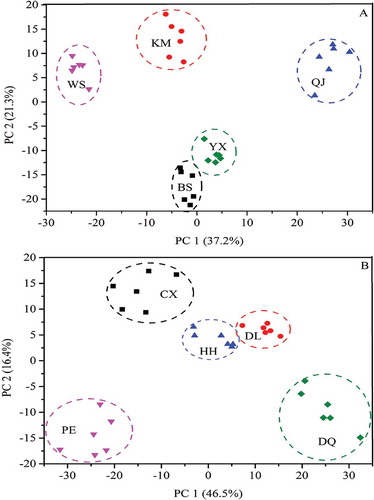
On the other hand, the shows the classification result of B. tomentipes samples from different geographical locations. The first two PCs account for total variation of 62.9% for this identification. It is observed from that all B. tomentipes samples are clearly separated and well distinguished with respect to their geographical locations (CX, PE, HH, DQ, and DL), showing that the composition of B. tomentipes mushrooms is also different according to their geographical locations. In particular, the geographical locations of DQ and PE are located in northwest and southwest corner of Yunnan province, respectively. In addition, the locality of DQ is closer to DL and the locality of PE is more near to HH, comparatively (). These may be responsible for the positions of B. tomentipes samples from these locations in the score plot (). However, the relationship between the quality of B. tomentipes mushroom and their geographical locations may be not completely corresponding, which is similar to B. edulis. For example, although there is an obvious distance between HH and DL, the quality of mushroom from these locations is similar. Anyway, by PCA method, B. edulis and B. tomentipes mushrooms can be identified successfully with respect to their geographical locations based on the variations of metabolic fingerprints presented in FT-MIR spectra.
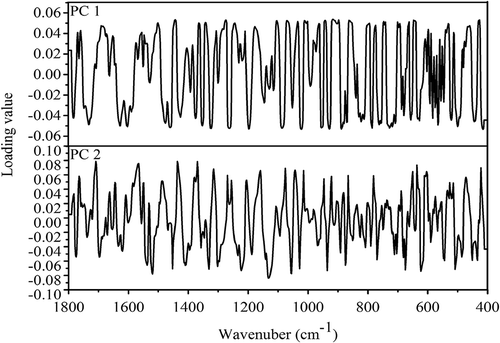
According to preliminary PCA method, the quality variations of B. edulis and B. tomentipes mushrooms from different geographical locations are classified effectively using the first two PCs. Thus, PC 1 and PC 2 are sufficient to describe the difference of chemical profile in different mushroom samples. To identify the wavenumbers that make high contributions to identifications, the loading plots of first two PCs for identifying different B. edulis and B. tomentipes samples are abstracted in and , respectively. For the classification of B. edulis (), peaks which make important contribution to PC 1 include 1521, 1490, 1367, 1332, 1230, 1093, 1043, 1033 cm−Citation1, and so on, while peaks with important contribution to PC 2 are 1594, 1554, 1415, 1382, 1357, 1062 cm−Citation1, and so on. With respect to the classification of B. tomentipes (), peaks which make significant contribution rate to PC 1 include 1461, 1442, 1324, 1272, 1257, 1195, 1087, 1033, 1010 cm−Citation1, and so on, while peaks with important contribution rate to PC 2 are 1708, 1565, 1521, 1436, 1369,1130, 1054 cm−Citation1, and so on. According to above analysis of peak assignments ( and ), maybe the conclusion can be drawn that the carbohydrate metabolic compounds make higher contributions than protein profile for the identifications of both B. edulis and B. tomentipes samples. Previous literatures have demonstrated that total carbohydrate is the main compound in mushroom fruiting body.[Citation2] In addition, the fingerprint regions also make larger contributions for these identifications as well.
Figure 5. Loading plot for identification of B. edulis samples.
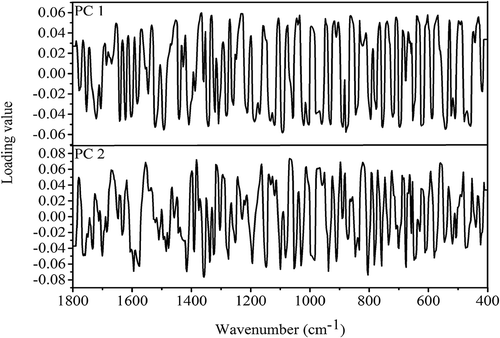
Figure 6. Loading plot for identification of B. tomentipes samples.
However, the PCA score plots only can describe the relationship among samples ambiguous because they are two dimensional. In order to observe the intrinsic relationship directly, HCA was used to analyse B. edulis and B. tomentipes samples from different geographical locations. The dendrogram which is used to describe the clustering of spectra is presented in . It is observed that all mushroom samples are divided into three parts. All the B. edulis samples are clustered together first in the right side, while B. tomentipes samples are separated into two parts in the left side. This result may demonstrate that B. edulis mushrooms in Yunnan province have a more stable quality than B. tomentipes mushrooms.
Figure 7. Dendrogram of HCA.
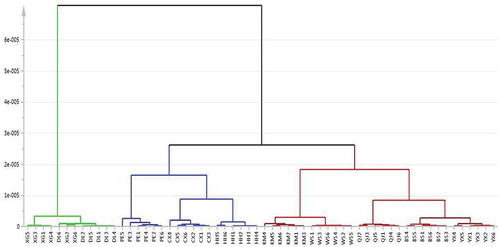
With respect to B. edulis, samples from YX and BS sites are distinguished as a cluster as their metabolic profiles are more similar. This result is coincided with the conclusion by PCA. As well, the chemical information of KM and WS may be sampleable because samples from these two locations are classified as cluster with a small distance. Mushroom samples from QJ locality are classified as a single cluster and this classification also can be observed in PCA score plot ().
On the other hand, B. tomentipes mushrooms exhibit a more complicated relationships compared with B. edulis species. First, samples from DQ and DL sites are identified as a class with some misclassifications. This result shows that B. tomentipes mushrooms from these sites have the most similar characters. In , the distance of these collection sites is close that they are located in the northwest of Yunnan province. Samples from HH, CX, and PE sites are distinguished as a cluster with the distance around 0.00002. However, samples from these three sites are identified together with the B. edulis mushrooms. This finding indicates that the variations of B. tomentipes mushrooms caused by geographical locations are very significant and the chemical information of these two species may be similar. In addition, except some misclassifications of the mushrooms from DQ and DL, all samples are first identified as a cluster according to their geographical locations. Therefore, HCA method can confirm the conclusion obtained from PCA and further depicts the relationships among these mushrooms from different geographical origins.
Supervised PLS-DA
To our best knowledge, PCA and HCA only can provide a preliminary judgment according to the similarity and difference of experimental samples. When unknown samples are involved, these unsupervised chemometrics are powerless. However, PLS-DA can be used to predict whether an unknown sample belongs to a particular class or not, by building the calibration model in advance.[Citation41] In general, the training samples need to be selected elaborately in order to ensure the robustness of the calibration model. The classic Kernnard–Stone algorithm[Citation42] was used to screen the training set and the rest of the samples were regarded as unknown samples (test set). Subsequently, PLS-DA was applied to investigate the potential of FI-MIR spectra for predicting unknown mushroom samples from different geographical locations.
In this study, 40 samples containing B. edulis and B. tomentipes mushrooms were used to build discriminate rule carefully. In this procedure, mushroom samples from each site were calibrated by coding their “Y” values as 1 and other samples’ “Y” values were coded as 0, respectively. The calibration parameters of RCitation2, RMSEE, and RMSECV of each geographical site are presented in . Generally, the better the calibration model is, the larger RCitation2 values are and the lower RMSEE and RMSECV values are. As shown in , all the RCitation2 values are higher than 0.95 and the RMSEE and RMSECV values are lower than 0.2, demonstrating that calibration model is reliable and practicable. In addition, the RCitation2Y is the cumulative interpretation ability, and QCitation2Y shows the cumulative prediction ability of the present model based on cross validation. When the QCitation2Y is higher than 0.5, it shows an acceptable prediction ability of the calibration model.[Citation43] In our study, the RCitation2Y and QCitation2Y are computed to be 0.976 and 0.762, respectively. This result also suggests that this discriminate model is valid and well-fit for next prediction of unknown samples.
Table 2. Calibration parameters of PLS-DA calibration model.
Based on the developed model, remaining 20 mushroom samples from different geographical locations were determined in this study. The predicted values of these unknown samples are presented in . According to predicted values, all unknown samples are predicted accurately according to their geographical locations. Especially, as can be seen in , all predicted values are higher than 0.8, which are close to the Y value of 1. These results demonstrate that the predicted ability of developed PLS-DA model is satisfactory and therefore FT-MIR spectroscopy in combination with PLS-DA method can be used to discriminate B. edulis and B. tomentipes mushrooms from different geographical locations and predict unknown mushroom samples successfully.
Table 3. Predicted values of unknown mushroom samples by PLS-DA model.
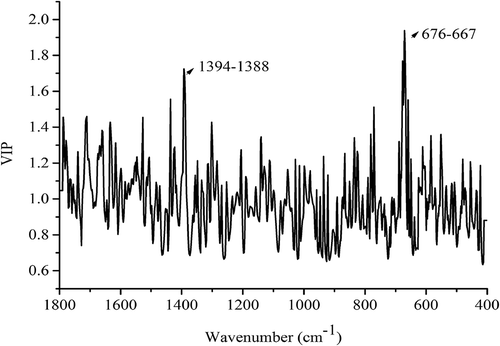
Variable importance in the projection (VIP) is the criterion which is built into PLS-DA procedure for exploring the important variables of models, and variable with the VIP value higher than 1 is significant.[Citation44] In this study, VIP plot is extracted in , which can show the important FT-MIR band for this discrimination. As can be seen in , the bands which make a higher contribution to this model mainly focus on the ranges of 1394–1388 cm−Citation1 and 676–667 cm−Citation1. Among them, the band of 1394–1388 cm−Citation1 may be resolved from the peak at 1408 cm−Citation1 (), which may come from pyranose ring.[Citation34] In addition, the band of 667–676 cm−Citation1 in fingerprint region may be related to CH2 groups of polysaccharides or some inorganic compounds in these mushroom species.[Citation45]
Figure 8. VIP plot of PLS-DA.
Conclusion
In this study, the feasibility of FT-MIR spectroscopy combined with chemometrics for identifying and discriminating B. edulis and B. tomentipes mushrooms from different geographical locations was investigated. Based on unsupervised PCA and HCA techniques, samples of these two mushrooms can be effectively classified and identified, according to their varying metabolic fingerprint characteristics. By supervised PLS-DA technique, B. edulis and B. tomentipes samples were also discriminated successfully with respect to their geographical locations, and further predicting the unknown mushroom samples accurately. Therefore, FT-MIR spectroscopy may represent a rapid and reliable tool for quality control of B. edulis and B. tomentipes mushrooms from different geographical locations. In addition, this technique also can be applied for other mushrooms for the same aim when combined with appropriate chemometrics.
Funding
This work was supported by National Natural Science Foundation of China (numbers 31460538, 31660591, and 21667031).
Additional information
Funding
Related Research Data
References
- Sanmee, R.; Dell, B.; Lumyong, P.; Izumori, K.; Lumyong, S. Nutritive Value of Popular Wild Edible Mushrooms from Northern Thailand. Food Chemistry 2003, 82, 527–532.
- Ulziijargal, E.; Mau, J.L. Nutrient Compositions of Culinary-Medicinal Mushroom Fruiting Bodies and Mycelia. International Journal of Medicinal Mushrooms 2011, 13, 343–349.
- Kalač, P. Chemical Composition and Nutritional Value of European Species of Wild Growing Mushrooms: A Review. Food Chemistry 2009, 113, 9–16.
- Olson, E.J.; Standing, J.E.; Griego-Harper, N.; Hoffman, O.A.; Limper, A.H. Fungal Beta-Glucan Interacts with Vitronectin and Stimulates Tumor Necrosis Factor Alpha Release from Macrophages. Infection and Immunity 1996, 64, 3548–3554.
- Šandula, J.; Kogan, G.; Kačuráková, M.; Machová, E. Microbial (1→ 3)-Β-D-Glucans, Their Preparation, Physico-Chemical Characterization and Immunomodulatory Activity. Carbohydrate Polymers 1999, 38, 247–253.
- Zaidman, B.Z.; Yassin, M.; Mahajna, J.; Wasser, S.P. Medicinal Mushroom Modulators of Molecular Targets as Cancer Therapeutics. Applied Microbiology and Biotechnology 2005, 67, 453–468.
- Frankowska, A.; Ziółkowska, J.; Bielawski, L.; Falandysz, J. Profile and Bioconcentration of Minerals by King Bolete (Boletus edulis) from the Płocka Dale in PolandFood Additives and Contaminants: Part B 2010, 3, 1–6.
- Luo, A.; Luo, A.; Huang, J.; Fan, Y. Purification, Characterization and Antioxidant Activities in Vitro and in Vivo of the Polysaccharides from Boletus edulis Bull. Molecules 2012, 17, 8079–8090.
- Zhang, A.; Xiao, N.; He, P.; Sun, P. Chemical Analysis and Antioxidant Activity in Vitro of Polysaccharides Extracted from Boletus edulis. International Journal of Biological Macromolecules 2011, 49, 1092–1095.
- Yang, T.W.; Li, T.; Zhang, J.; Li, J.Q.; Liu, H.G.; Wang, Y.Z. Discrimination of Boletus tomentipes from Different Regions Based on Infrared Spectrum Combined with Principal Component Analysis and Cluster Analysis. Spectroscopy and Spectral Analysis 2016, 36, 1726–1730.
- Zhou, Z.J.; Liu, G.; Ren, X.P. A Study of Boletus bicolor from Different Areas Using Fourier Transform Infrared Spectrometry. Spectroscopy and Spectral Analysis 2010, 4, 911–914.
- Yang, T.W.; Li, T.; Zhang, J.; Li, J.Q.; Liu, H.G.; Wang, Y.Z. Ultraviolet Spectrum Identification of Boletus tomentipes from Different Regions. Environmental Monitoring and Assessment 2015, 36, 301–305.
- Falandysz, J.; Frankowska, A.; Mazur, A. Mercury and Its Bioconcentration Factors in King Bolete (Boletus edulis) Bull. Fr. Journal of Environmental Science and Health Part A 2007, 42, 2089–2095.
- Zhang, J.; Liu, H.; Li, S.J.; Li, J.Q.; Wang, Y.; Li, T. Arsenic in Edible and Medicinal Mushrooms from Southwest China. International Journal of Medicinal Mushrooms 2015, 17, 601–605.
- Heleno, S.A.; Barros, L.; Sousa, M.J.; Martins, A.; Santos-Buelga, C.; Ferreira, I.C. Targeted Metabolites Analysis in Wild Boletus Species. LWT-Food Science and Technology 2011, 44, 1343–1348.
- Brondz, I.; Høiland, K.; Ekeberg, D. Multivariate Analysis of Fatty Acids in Spores of Higher Basidiomycetes: A New Method for Chemotaxonomical Classification of Fungi. Journal of Chromatography B 2004, 800, 303–307.
- Petersen, R.H.; Hughes, K.W. Phylogeographic Examples of Asian Biodiversity in Mushrooms and Their Relatives. Fungal Divers 2003, 13, 95–109.
- Izumitsu, K.; Hatoh, K.; Sumita, T.; Kitade, Y.; Morita, A.; Gafur, A.; Ota, Y. Rapid and Simple Preparation of Mushroom DNA Directly from Colonies and Fruiting Bodies for PCR 2012, 53, 396–401.
- Sahu, R.K.; Mordechai, S. Spectroscopic Techniques in Medicine: The Future of Diagnostics. Applied Spectroscopy Reviews 2016, 51, 484–499.
- Cheng, C.; Liu, J.; Wang, H.; Xiong, W. Infrared Spectroscopic Studies of Chinese Medicines. Applied Spectroscopy Reviews 2010, 45, 165–178.
- Vodnar, D.C.; Socaciu, C.; Rotar, A.M.; Stanila, A. Morphology, FTIR Fingerprint and Survivability of Encapsulated Lactic Bacteria (Streptococcus thermophilus and Lactobacillus delbrueckii Subsp. Bulgaricus) in Simulated Gastric Juice and Intestinal Juice. International Journal of Food Science & Technology 2010, 45, 2345–2351.
- Erwanto, Y.; Muttaqien, A.T.; Sugiyono, S.; Rohman, A. Use of Fourier Transform Infrared (FTIR) Spectroscopy and Chemometrics for Analysis of Lard Adulteration in “Rambak” Crackers. International Journal of Food Properties 2016, 19, 2718–2725.
- Casale, M.; Oliveri, P.; Casolino, C.; Sinelli, N.; Zunin, P.; Armanino, C.; Lanteri, S. Characterisation of PDO Olive Oil Chianti classico by Non-Selective (Uv-Visible, NIR and MIR Spectroscopy) and Selective (Fatty Acid Composition) Analytical Techniques. Analytica Chimica Acta 2012, 712, 56–63.
- Grunert, T.; Stephan, R.; Ehling-Schulz, M.; Johler, S. Fourier Transform Infrared Spectroscopy Enables Rapid Differentiation of Fresh and Frozen/Thawed Chicken. Food Control 2016, 60, 361–364.
- Hirri, A.; Bassbasi, M.; Platikanov, S.; Tauler, R.; Oussama, A. FTIR Spectroscopy and PLS-DA Classification and Prediction of Four Commercial Grade Virgin Olive Oils from Morocco. Food Analytical Methods 2016, 9, 974–981.
- Muhtar, I.; Mengyue, G.; Fang, P.; Aiguo, S.; Jiming, H. Discrimination of Natural Gas-Related Bacteria by Means of Micro-Raman Spectroscopy. Vibrational Spectroscopy 2016, 82, 44–49.
- Zhao, Y.; Zhang, J.; Jin, H.; Zhang, J.; Shen, T.; Wang, Y. Discrimination of Gentiana rigescens from Different Origins by Fourier Transform Infrared Spectroscopy Combined with Chemometric Methods. Journal of AOAC International 2015, 98, 22–26.
- Liland, K.H.; Almøy, T.; Mevik, B.H. Optimal Choice of Baseline Correction for Multivariate Calibration of Spectra. Applied Spectroscopy 2010, 64, 1007–1016.
- Roy, I.G.; On Computing First and Second Order Derivative Spectra. Journal of Computational Physics 2015, 295, 307–321.
- Dhanoa, M.S.; Lister, S.J.; Sanderson, R.; Barnes, R.J. The Link between Multiplicative Scatter Correction (MSC) and Standard Normal Variate (SNV) Transformations of NIR Spectra. Journal of near Infrared Spectroscopy 1994, 2, 43–47.
- Cheajesadagul, P.; Arnaudguilhem, C.; Shiowatana, J.; Siripinyanond, A.; Szpunar, J. Discrimination of Geographical Origin of Rice Based on Multi-Element Fingerprinting by High Resolution Inductively Coupled Plasma Mass Spectrometry. Food Chemistry 2013, 141, 3504–3509.
- Ambrose, A.; Lohumi, S.; Lee, W.H.; Cho, B.K. Comparative Nondestructive Measurement of Corn Seed Viability Using Fourier Transform Near-Infrared (FT-NIR) and Raman Spectroscopy. Sensors and Actuators B: Chemical 2016, 224, 500–506.
- Buchgraber, M.; Ulberth, F.; Anklam, E. Cluster Analysis for the Systematic Grouping of Genuine Cocoa Butter and Cocoa Butter Equivalent Samples Based on Triglyceride Patterns. Journal of Agricultural and Food Chemistry 2004, 52, 3855–3860.
- Mohaček-Grošev, V.; Božac, R.; Puppels, G.J. Vibrational Spectroscopic Characterization of Wild Growing Mushrooms and Toadstools. Spectrochimica Acta Part A: Molecular and Biomolecular Spectroscopy 2001, 57, 2815–2829.
- Nie, M.; Luo, J.; Xiao, M.; Chen, J.; Bao, K.; Zhang, W.; Chen, J.; Li, B. Structural Differences between Fusarium Strains Investigated by FT-IR Spectroscopy. Biochemistry 2007, 72, 61–67.
- Fischer, G.; Braun, S.; Thissen, R.; Dott, W. FT-IR Spectroscopy as a Tool for Rapid Identification and Intra-Species Characterization of Airborne Filamentous Fungi. Journal of Microbiological Methods 2006, 64, 63–77.
- Zervakis, G.I.; Bekiaris, G.; Tarantilis, P.Α.; Pappas, C.S. Rapid Strain Classification and Taxa Delimitation within the Edible Mushroom Genus Pleurotus through the Use of Diffuse Reflectance Infrared Fourier Transform (DRIFT) Spectroscopy. Fungal Biology 2012, 116, 715–728.
- O’Gorman, A.; Downey, G.; Gowen, A.A.; Barry-Ryan, C.; Frias, J.M. Use of Fourier Transform Infrared Spectroscopy and Chemometric Data Analysis to Evaluate Damage and Age in Mushrooms (Agaricus bisporus) Grown in Ireland. Journal of Agricultural and Food Chemistry 2010, 58, 7770–7776.
- Mellado-Mojica, E.; López, M.G. Identification, Classification, and Discrimination of Agave Syrups from Natural Sweeteners by Infrared Spectroscopy and HPAEC-PAD. Food Chemistry 2015, 167, 349–357.
- García, M.Á.; Alonso, J.; Melgar, M.J. Lead in Edible Mushrooms: Levels and Bioaccumulation Factors. Journal of Hazardous Materials 2009, 167, 777–783.
- Hou, W.; Tian, Y.; Liao, T.; Huang, Y.; Tang, Z.; Wu, Y.; Duan, Y. Development of the Mass Spectral Fingerprint by Headspace-Solid-Phase Microextraction-Mass Spectrometry and Chemometric Methods for Rapid Quality Control of Flavoring Essence. Microchemical Journal 2016, 128, 75–83.
- Kennard, R.W.; Stone, L.A. Computer Aided Design of Experiments. Technometrics 1969, 11, 137–148.
- Alexander, D.L.J.; Tropsha, A.; Winkler, D.A. Beware of R2: Simple, Unambiguous Assessment of the Prediction Accuracy of QSAR and QSPR Models. Journal of Chemical Information and Modeling 2015, 55, 1316–1322.
- Pérez-Enciso, M.; Tenenhaus, M. Prediction of Clinical Outcome with Microarray Data: A Partial Least Squares Discriminant Analysis (PLS-DA) Approach. Human Genetics 2003, 112, 581–592.
- Tănase, C.; Odochian, L.; Balaeş, T.; Lisă, G.; Gherca, D.; Pui, AStudy of Thermal Behaviour of Some Edible Mushrooms. Journal of Thermal Analysis and Calorimetry 2014, 115, 947–953.