
ABSTRACT
This study deals with the occurrences that take place during the cooking of chicken soups under different conditions as well as their implications on the sensory quality. For that, the effect of temperature (103°C and 85°C) and time (3, 4, and 5 h) of cooking on taste compounds and sensory attributes of chicken soups was investigated. Amino acids, nucleotides, and equivalent umami showed the highest values at 103°C and 5 h soups and the lowest at 85°C and 3 h. Taste compounds increased with temperature and cooking time. Sensory attributes obtained higher scores at 103°C than at 85°C. Inosine-5’-monophosphate and guanosine-5’-monophosphate and minor amino acids (α-aminoadipic acid, ornithine, tryptophan, cystine, and methionine) influenced taste compounds notably. In addition, this study firstly uses an easy and rapid method for amino acid analysis, with sarcosine, α-aminobutiric acid, ß-aminoisobutiric acid, allo-isoleucine, and α-aminoadipic acid being detected for the first time in soups.
Introduction
Soups are defined as “thin clear liquids obtained either by cooking of suitable protein-rich substances or their derivatives with water with or without the addition of seasonings and/or flavouring substances, edible fats, sodium chloride, spices and their natural extracts or distillates or other foodstuffs to improve their taste or by reconstitution of an equivalent mixture of dehydrated ingredients according to the directions for use.”[Citation1]
Chicken and beef as meat, onion, carrot, and celery as vegetables, and salt, pepper and parsley as spices are highly used in customary recipes. Prescriptions on the cooking of soups are so variable. For example, the cooking time for beef soup: 6–8 h,[Citation2] 5–6 h or more if bones are cooked by themselves before adding meat,[Citation3], minimum 4 h;[Citation4] add only hot water to a simmering soup;[Citation4] add only cold water to a simmering soup.[Citation3] Start with cold water, heat slowly and only simmer, skim frequently throughout the cooking time are the most common recommendations[Citation2–Citation5] This action helps to improve the extraction and clarity, allowing proteins to coagulate slowly and form large aggregates easily skimmed off. However, cooking temperature is not usually specified, only indicating boiling or simmering. Nevertheless, it indicates the importance of accurately determining the heat treatment, since intermediate treatments yielded beef broths of good quality, less intense treatments produced broths with raw meat and bloody and metallic flavours, and intensely heated broths had a warmed-over or sour and astringent flavour. Therefore, the flavour of boiled meat is produced in the presence of water at temperatures around 100°C or below.[Citation6]
During the cooking of soups, there is a diffusion process of different compounds from the solid ingredients added to the water, which contributes to the characteristics of soups. Proteins, mainly collagen, lipids, and carbohydrates are responsible for the texture of soups. There are also non-volatile and water-soluble compounds, mainly free amino acids, nucleotides, and some organic acids and sugars, influence on the taste of soups,[Citation7,Citation8] Maillard reactions also take place during the cooking of soups, affecting the aroma and colour of this food.[Citation9] Other chemical reactions, such as lipid oxidation, starch gelatinisation, or vitamin degradations, are also given during the soup preparation.
Amino acids can be ascribed with different taste characteristics.[Citation10,Citation11] Alanine and glycine are related to sweet taste. Valine, tyrosine, isoleucine, leucine, phenylalanine, and tryptophan have relatively bitter savour. The acidity is characteristic of aspartic and glutamic acids, histidine and asparagine, and aspartic and glutamic acids also participate in salty savour. Nucleotides have been ascribed to take part in meat flavour.[Citation12] For example, guanosine-5’-monophosphate (GMP) and inosine-5’-monophosphate (IMP) contribute to the umami taste and are important flavour potentiators,[Citation13] while hypoxanthine (HX) may contribute to the bitter taste of meat.[Citation14] In soups, IMP, HX, and GMP are the major nucleotides,[Citation15] with IMP being the most contributor to the meat flavour of this food.[Citation16,Citation17]
Besides the four basic tastes, the umami is considered the fifth taste in mouth perception. It is also called the palatable taste or the perception of satisfaction. It is induced or enhanced by monosodium glutamate (MSG).[Citation18] Umami gives a pleasant taste and is commonly provided by soups.[Citation16] The L-amino acid structure with five carbon atoms, such as aspartic and glutamic acid, and 5’-nucleotides are associated with umami taste.[Citation19] Components related to umami have been considered to be important to the sensory quality.[Citation20] The equivalent umami concentration (EUC) is calculated based on the contents of these components.[Citation21] The EUC value is the concentration of MSG equivalent to the umami intensity, which is given by the mixture of MSG and 5’-nucleotide. EUC had been calculated in order to understand the umami-like taste characteristics.[Citation22]
The amino acid analysis usually requires an extraction procedure previously to the derivatisation and chromatographic procedures. In soups, sulfosalicylic acid[Citation15,Citation17] or HCl[Citation16,Citation23] have been used for extraction. For derivatisation, phenylthiocarbamil,[Citation15,Citation17] o-phthalaldehyde[Citation16] or N-Methyl-N-(tert-butyldimethylsilyl)trifluoroacetamide (MTBSTFA)[Citation23] have been used, the last one giving more stable derivatives. High performance liquid chromatography (HPLC), coupled to ultraviolet[Citation15,Citation17] or fluorescence detectors,[Citation16] is the most used technique for the amino acid determination in soups. Nevertheless, gas chromatography with mass selective detector (GC-MS) has also been proved, obtaining accurate results.[Citation23] These methodologies are tedious, involve the use of high sample amount and solvent volume and take long run time. At this respect, it would be of great interest having a simpler, easier and quicker technique, such us commercial kits.
Considering all these aspects, it is appealing to know the occurrences that take place during the cooking of soup under different conditions as well as their implications on sensory quality. Thus, this study was aimed to analyse the effect of temperature and time of cooking on the content of taste compounds (amino acid and nucleotides) in chicken soups, as well as their impact on sensory attributes, trying to set a range of optimum cooking conditions for this kind of soup. The use of a commercial kit for amino acid analysis was also tested for first time.
Experimental state
Design of the study
Soups were made with chicken carcass (400 g), chicken thigh (300 g), onion (100 g), one garlic, two cloves, and mineral water (4 L) using an induction cooking equipped with a controlled temperature feature with a precision of ± 1°C (PIB.675L34E, Bosch, Germany). All ingredients were put into stainless steel pots and simmer (103°C) for 5 min. From this point, soups were cooked under six different combinations of temperature (103 and 85°C) and time (3, 4, and 5 h). This leads to six different chicken soups, each one being performed 3 times (i.e. in triplicate). Temperature of soups during cooking was recorded using a thermometer probe (Testo 735-2, Lenzkirch, Germany). shows the recorded temperature in the soups cooked for 5 h. As can be seen, temperature did not fluctuate during the cooking at both 103 and 85°C. After cooking, the solid ingredients were removed. Continuously, volume of the soups was measured in order to calculate evaporative losses. Then, samples were stored at −80°C until analysis.
Figure 1. Record of temperatures in chicken soups cooked at 103 °C (♦) and 85 °C (■) for 5 h.
Taste compounds determination
Amino acid analysis
The determination of amino acids was carried out using a commercial kit (Phenomenex, Germany), and following its procedure. It consists of a sample preparation by solid phase extraction: 100 μL of the sample and 100 μL the internal standard (norvaline, 200 nmol mL−Citation1) were mixed into a preparation vial, which was passed through a sorbent tip previously attached to a 1.5 mL syringe. Continuously, 200 μL of n-propanol were also passed through the sorbent tip. Then, solution in the sorbent tip is drained and collected in 200 μL of sodium hydroxide:n-hexane (3:2). 50 μL of propyl chloroformate were added to this solution, being homogenised by vortex for 6–8 s and left to rest for 1 min. Then, derivatisation was carried out by adding 100 μL of iso-octane, repeating homogenisation and resting. And finally, 100 μL of hydrochloric acid 1N were added, and again homogenised and rested, obtaining two separated phases. The upper organic phase was collected for being analysed by gas-chromatographic (Agilent 6890N) with flame ionisation detector (GC-FID), following conditions of the commercial kit. A portion of 2 μL of the derivatised extract was injected in split mode (1:15) onto the column (Zebron ZB-AAA, 10 m × 0.25 mm, film composition 50% phenyl 50% dimethyl polysiloxane). Oven temperature programming started at 110°C, increasing 35°C/min to 320°C. Each run takes 6.5 min. Injector and detector temperatures were 250 and 320°C, respectively. The carrier gas was helium at a flow rate of 1.5 mL. Individual amino acid peaks were identified by comparing their retention times with those of standards (Phenomenex, Germany). Amino acid quantification was carried out by the standard addition method. For each amino acid, a calibration curve (amino acid peak area/internal standard peak area versus amino acid amount/internal standard amount) was constructed, obtaining RCitation2 values of 0.99 for all of amino acids in the range 50–4000 nmol µL−Citation1. The final results were expressed in nmol µL−Citation1. Amino acid peak detection was in concordance with examples shown in the commercial kit.
Nucleotide analysis
The nucleotide determination was done following the method of Watanabe et al.[Citation24] with some modifications. Samples (5 g) were homogenised with 0.6 N perchloric acid (20 mL) using an Ultraturrax (T18 basic, IKA, Staufe, Germany). The supernatant was filtered through paper Whatman no 54, and the procedure was repeated. The pH of the filtrated was adjusted to pH = 7 with 6 N hydroxide potassium, cooled at 0°C, and filter through paper Whatman no 54. The extracts were stored at −80°C until analysis. The analysis was developed by HPLC and diode array detector (HPLC-DAD). It was used an analytical HPLC unit (Shimazdu, Tokyo, Japan) equipped with a DGU-20A5 degasser, a LC-20AD pump, a SPD-M20A multiwavelength detector, and a SIL-20A autosampler injector. LC Solutions software (Shimazdu, Tokyo, Japan) was also used. A 15 μl portion of the final extract was injected onto a Supelcosil LC-18-T column (5 μm, 250 mm length, 4.6 mm i.d.) (Supelco, Bellefonte, PA). Chromatographic separation was performed using a gradient elution of 0.1 M potassium phosphate buffer/4 mM tertrabutylammonium hydrogen sulphate, pH = 6 (A) and A:methanol (70:30) (B). The linear gradient program used was t = 0–5 min, 0% B; t = 8 min, 30% B; t = 13 min, 51.4% B; t = 18 min, 60% B; t = 21 min, 100% B; t = 21–18 min 100% B; t = 28.5 min, 0% B; t = 28.5–43.5 min, column rinse and re-equilibration. The flow rate was 0.9 ml/min, and separations were carried out at room temperature. DAD detection was set at 248 nm for HX, IMP, and inosine (INO), and at 258 nm for GMP. Peak identification was carried out by comparing retention times and spectra of unknown peaks with reference standards. For nucleotides quantification, standard calibration curves (0.16–0.36 μg μL−1) were constructed for each nucleotide, obtaining RCitation2 values of 0.9999. The final results were expressed in mg of nucleotide per 100 µL sample.
Equivalent umami concentration
The equivalent umami concentration (EUC) was calculated according to the equation given by Dai et al.[Citation25]
where Y = EUC expressed as g MSG kg−Citation1 sample; ai = g kg−Citation1 of each amino acids (aspartic acid and glutamic acid); bi = relative umami concentration for each amino acid (0.077 for aspartic acid and 1 for glutamic acid); aj = g kg−Citation1 of each nucleotide (GMP and IMP); bj = relative umami concentration for each nucleotide (2.3 for GMP and 1 for IMP).
Sensory analysis
A hedonic test was carried out in accordance with UNE 87004 (1979): visual appearance, odour, texture, taste, and acceptability were analysed following a mixed hedonic scale (5: very good; 4: good; 3: average; 2: poor; 1: very poor). Untrained (75) subjects (consumers), including university students, professors, and staff recruited at the School of Veterinary Sciences (University of Extremadura, Cáceres, Spain) formed the tasting panel. Analyses were developed in tasting rooms with the conditions specified in UNE regulation (UNE 87004, 1979). All sessions were conducted at ambient temperature in a sensory room equipped with white fluorescent lighting. Chicken soups (25–30 mL) were served hot on see-through plastic glasses to panelists. The panel sessions were held around 12–13 h in the morning.
Statistical analysis
Each soup cooked at the corresponding temperature and time combination was prepared 3 times (i.e. in triplicate). In addition, for each sample, the measurements of the response variables were made in duplicate. The effect of temperature and time on taste compounds (amino acids, nucleotides and EUC) were analysed using a two-way analysis of variance (ANOVA) according to the general linear model procedure. When a significant effect (p < 0.05) was detected, paired comparisons between means were conducted using the Tukey’s test, in order to distinguish the different batches. The Friedman nonparametric test was used for determining differences between groups in the sensory analysis. Pearson’s correlation between taste compounds and sensory attributes and a principal components analysis (PCA) of the taste compounds of chicken soups were carried out. All statistical analyses were performed using the SPSS package (v.20.0).
Results and discussion
Taste compounds
Amino acids
As our knowledge this is the first study on soups at analysing free amino acid by using a commercial kit. It consists on an easy and rapid sample preparation followed by a GC-FID analysis of 6.5 min run (). In comparison to previous described methods in soups[Citation15,Citation17,Citation23] the use of the present methodology allows a notable reduction in terms of sample amount (from 2–10 mL to 100 μL), solvent volume (from 10–50 mL to 200 μL in the case of the preparation solvent) and run time (from 42–46 min to 6.5 min). Twenty-five amino acids were detected in the chicken soups of this study (). Most of these amino acids have been previously reported in meat soups,[Citation16,Citation17,Citation23] except for sarcosine, α-aminobutiric acid, ß-aminoisobutiric acid, allo-isoleucine, and α-aminoadipic acid. These amino acids have been described in soups for first time in this study. It is worth noting the detection of α-aminoadipic acid, which has been described as an oxidation product of lysine and a reliable marker of protein oxidation.[Citation26] The detection of this compound is usually carried out by costly and time consuming HPLC techniques coupled to mass selective[Citation27] or fluorescent detectors.[Citation28] The relevance of this methodology is significant from a scientific point of view, since it allows an easy and quick detection of twenty-five compounds, reducing sample amount, solvent volume and time of analysis.
Table 1. Amino acid content (nmol µL−Citation1) in chicken soups cooked at different combinations of temperature (T) and time (t).
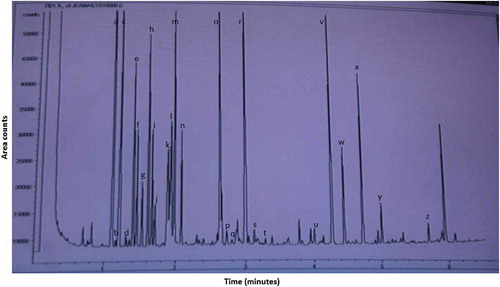
Figure 2. GC-FID separation* of amino acids after preparation and derivatisation with the EZfaast kit.
*Photograph of chromatogram.a:alanine; b:sarcosine; c:glycine; d:homoalanine; e:valine; f:ß-aminoisobutiric acid; g:internal standard; h:leucine; i:allo-isoleucine; j:isoleucine; k:threonine; l:serine; m:proline; n:asparagine; o:aspartic acid; p:methionine; q:glutamic acid; r:phenilalanine; s:α-aminoadipic acid; t:glutamine; u:ornithine; v:lysine; w:histidine; x:tyrosine; y: tryptophan; z:cystine.
As seen in , aspartic acid, alanine, glycine, threonine, serine, and proline were major amino acids in the chicken soups of this study, while glutamic acid, valine, aspargine, leucine, and lysine were in a second place in terms of abundance. In chicken soups reconstituted from broth cubes, twelve free amino acids were found at very low level, with glutamic acid being the major one.[Citation16] In beef soups, most abundant amino acids were histidine, alanine, cysteine, glutamine, and glutamic acid.[Citation17] Thus, there are some differences in the profile of amino acids between these studies, which could be ascribed to the method of analyses and also to the ingredients and cooking conditions, i.e. chicken carcass and thigh were used in this study, while Chiang et al.[Citation16] elaborated chicken soups from broth cubes, and minced meat was used by Pereira-Lima et al.[Citation17] for preparing beef soups.
Temperature and time of cooking influence significantly on the content of most amino acids detected in chicken soups, whereas the combined effect temperature-time was significant only in five amino acids (serine, phenylalanine, allo-isoleucine, aspartic, and glutamic acids). Thus, it can be observed that the effect of both temperature and time are synergistic. Content of most amino acid are higher when cooking at 103°C than at 85°C, this effect being notable at 3 and 5 h of cooking but not at 4 h. In general, the content of most amino acids increased with the cooking time, this effect being marked from 4 h at 85°C and from 5 h at 103°C. Thus, in most amino acids and in the total sum, it can be observed the highest content in 103°C-5 h soups and the lowest in 85°C-3 h soups, with similar values when cooking at 103°C-4 h, 103°C-3 h, 85°C-4 h, and 85°C-5 h. According to these results, other authors[Citation16] did not found differences in the content of amino acids in chicken soups cooked at 99°C and 85°C for 4 h. On the contrary, Pereira-Lima et al.[Citation17] observed that the content of most amino acids decreased significantly in beef soups cooked at temperatures above 75°C for 2 h or more. These authors considered that the thermal treatment increases the activity of the meat enzymes up to a certain temperature (75°C), although at higher temperatures the proteolytic activity decreases and Maillard reaction and Strecker degradation reactions are potentiated. However, the results found in this study support the assertion that proteolysis and diffusion of amino acids from meat chicken take place notably when cooking chicken soups at controlled temperature between 85°C and 103°C for 3, 4, and 5 h, while Strecker degradation and Maillard reactions are less marked reactions under these conditions. In fact, Maillard reaction depends directly on the processing temperature and time and is greatly heightened by long exposure to high heat.[Citation29] It is affected by food composition and the method and conditions of the industrial or culinary preparation[Citation30] It has been also reported that culinary treatments such as frying or baking have a greater impact on these reactions than boiling[Citation31]
It is worth noting that α-aminoadipic acid did not show the same the trend than most amino acid that showed their highest content in 103°C-5 h soups. However, the highest values of α-aminoadipic acid were found in 85°C-4 h soups. This is quite in concordance with a previous study on cooked lamb loins meat, where samples cooked at 60°C showed an increased in this amino acid throughout cooking time, their amounts remained more or less constant when cooking at 70°C, and there was a decrease when cooking at 80°C.[Citation32] These compounds may be involved in different types of reactions with other components like non-modified amino acid residues forming cross-links and Schiff base, which may lead to their degradation[Citation33]
Nucleotides
shows the nucleotides content in chicken soups cooked at different combination of temperature and time. HX, INO, IMP, and GMP were detected. INO was the major nucleotide, followed by HX, IMP, and GMP in decreasing order. These results are quite in concordance with those found in beef soups, being HX, INO, and IMP the most important nucleotides quantitatively, representing together between 80 and 90% of the total.[Citation17] In these soups, adenosine-5’-diphosphate, adenosine-5’-triphosphate, and GMP were also detected, but at very low concentrations. However, in chicken broth cubes, GMP and INO were the most abundant nucleotides.[Citation16] It was found that content of nucleotides in the chicken soups increased significantly with the temperature and time of cooking. In addition the combined effect of temperature-time was also significant on the four detected nucleotides. It is also observed that the effect of time and temperature are synergistic, being more notable in soups cooked at 103°C than at 85°C. Other authors also found that IMP concentration increased with increasing temperature, which they explained by an improvement in ATP enzymatic degradation and in extraction of water-soluble substances.[Citation17] The results obtained from this study seem to indicate that the ATP degradation and the diffusion of the resulting metabolites are highly enhanced by the time of cooking at high temperatures (103°C). The results on taste compounds could be of interest for the industrial preparation of soups that should consider the remarkable effect of the temperature on the generation and diffusion of amino acids and nucleotides.
Table 2. Nucleotide content (g/Kg) in chicken soups cooked at different combinations of temperature (T) and time (t).
Equivalent umami concentration
Equivalent umami concentration is a measure of the umami intensity that provides a pleasant taste in soups.[Citation16] The EUC was calculated in the chicken soups cooked at different combination of temperature and time (). EUC values in these soups ranged between 2.62 and 9.80 g MSG/kg sample, which are in agreement with results obtained in chicken, mushroom, pork and seafood soups (3.10–7 g MSG/kg sample).[Citation16] As expected, EUC values increased significantly with temperature and time of cooking (p<0.001 for both effects). As occurred with the nucleotides, the effect of time and temperature are synergistic, being significant at 103°C and not at 85°C. The effect of temperature-time combination also influenced significantly on EUC, finding the highest values in chicken soups at 103°C for 5 h, and the rest of soups showing similar values. Thus, it seems that the highest umami intensity would be found in of chicken soups cooked at 103°C-5 h, without differences between 103°C-4 h, 103°C-3 h, 85°C-5 h, 85°C-4 h, and 85°C-3 h. Nevertheless, according to previous studies,[Citation16] EUC values of all chicken soups of this study would be perceived to have slight umami taste.
Figure 3. Equivalent umami concentration (EUC) in chicken soups cooked at 103°C (♦) and 85°C (■) for 3, 4, and 5 h.
Different letters indicate significant differences between batches.
Sensory analysis
The results on the sensory analysis are exposed in . All soups obtained scores between average and good for odour, texture, taste and acceptability, which indicate the appropriateness of cooking chicken soups under controlled temperature at 103°C and 85°C for 3, 4, and 5 h. However, the attribute visual appearance was between poor and average, which could be explained by the presence of solid particles in the soups, due to they are not filtered. In addition, the results on the Friedman nonparametric test showed statistical differences in odour (p = 0.046), texture (p = 0.025), taste (p = 0.015), and acceptability (p = 0.040) between soups. In general, soups cooked at 103°C obtained higher scores for these attributes than 85°C soups. This result is supported by the higher content in taste compounds (amino acid and nucleotides) found in the soups cooked at 103°C. However, scores of sensory attributes did not vary as a function of time. Previous studies on beef broths also found that temperature plays a more important role than cooking time in the development of the sensory properties.[Citation6] Thus, it could be recommend to prepare chicken soups at around 100°C for 3–5 h.
Figure 4. Results on sensory analysis of chicken soups cooked at different temperatures and times.
It could be thought that evaporative losses could also influence on sensory attributes, the content of taste compound and EUC in the chicken soups. As expected, evaporative losses increased with temperature and time of cooking: 103°C-5 h (65%) > 103°C-4 h (65.25%) > 103°C-3 h (38.75%) > 85°C-5 h (33.75%) > 85°C-4 h (25%) > 85°C-3 h (13.75%). However, these differences in evaporative losses between chicken soups cooked at different temperature and time combinations did not follow the same trend than amino acids (103°C-5 h > 103°C-4 h, 103°C-3 h, 85°C-5 h, 85°C-4 h > 85°C-3 h), nucleotides (103°C-5 h > 103°C-4 h > 103°C-3 h > 85°C-5 h, 85°C-4 h, 85°C-3 h), EUC (103°C-5 h > 103°C-4 h, 103°C-3 h, 85°C-5 h, 85°C-4 h, 85°C-3 h), nor sensory traits (103°C-5 h, 103°C-4 h, 103°C-3 h > 85°C-5 h, 85°C-4 h, 85°C-3 h). So, the observed evaporative losses seem to be more a consequence of the different temperature and time of cooking than an influencing factor on taste compounds and sensory traits of chicken soups. In fact, this issue has not been considered in previous studies at elaborating soups.[Citation15,Citation17]
Relationships between sensory traits and taste compounds
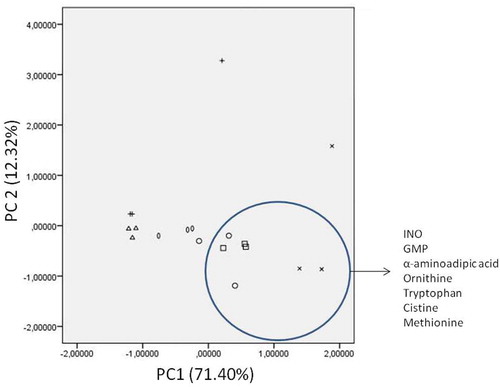
Pearson’s correlation analyses have shown significant and positive R values (>0.75) between the taste attribute and INO, GMP, sarcosine, α-aminobutiric acid, valine, leucine, asparagine, methionine, α-aminoadipic acid, ornithine, lysine, histidine, tryptophan, and cystine. Moreover, principal components analysis (PCA) was performed using the amino acid and nucleotides data that showed significant correlation with taste. Two first Principal Components (PC1 and PC2) accounted for 71.40% and 12.32% of the total variance, respectively (). The projection of the samples onto the PC space showed that soups cooked at 85°C were in the lower left quadrant, this area not being defined by any of the taste compounds included in this analysis. Soups cooked at 103°C were located in the lower right quadrant, corresponding to INO, GMP, α-aminoadipic acid, ornithine, tryptophan, cystine, and methionine. This indicates the positive effect of these compounds on the taste of chicken soups. It is remarkable that most of them are minor compounds, except for GMP that is the major nucleotide. Chiang et al.[Citation16] have also reported the importance of INO and GMP in the taste of soups. GMP and cystine gave a meaty flavour.[Citation16,Citation17] Methionine and sarcosine participate in the sweet taste and tryptophan and ornithine in the bitter.[Citation17] From the compounds related to the EUC (aspartic and glutamic acid, INO and GMP), only the nucleotides seem to influence on the general taste of chicken soups. α-aminoadipic acid, which usually described as a degradation product of lysine and as marker of protein oxidation,[Citation26,Citation28] also seems to affect the taste of soups.
Figure 5. Score plot of principal component analysis of chicken soups cooked at different combination of temperature and time (85°C-3 h: Δ, 85°C-4 h: +, 85°C-5 h: 0, 103°C-3 h: ◯, 103°C-4 h: ⁏, 103°C-5 h: X).
Conclusion
This paper firstly shows the capability of a simple and quick analysis of free amino acids in soups by using a commercial kit, allowing the GC-FID separation of 25 compounds in 6.5 min, with sarcosine, α-aminobutiric acid, ß-aminoisobutiric acid, allo-isoleucine, and α-aminoadipic acid being detected for first time in soups. During chicken soup preparation, generation and diffusion of amino acids and nucleotides are enhanced by temperature around 100°C and long cooking time (5 h). However the effect of time is temperature dependent, being more notable at higher temperatures. Similar effects take place on equivalent umami concentration, although the low values of this measurement indicates slight umami in all chicken soups. In relation to sensory attributes of chicken soups, cooking temperature around 100°C influences them positively, while the time of cooking does not affect. Hence, it could be proposed to cook chicken soups at around 100°C for 3–5 h. There are significant correlations between the content of amino acids and nucleotides and the taste of chicken soups, with inosine-5’-monophosphate and guanosine-5’-monophosphate and minor amino acids (α-aminoadipic acid, ornithine, tryptophan, cystine, and methionine) influencing positively on this attribute.
Acknowledgments
The authors wish to acknowledge to the Dr. Antonio Silva from the Research Institute of Meat and Meat Products for their direct contribution and support.
References
- Codex Alimentarius Comission. Report of the First Session of the Codex Committee on Soups and Broths. Berne, 3–7 November 1975.
- The Culinary Institute of America. The Professional Chef; John Wiley & Sons: Hoboken, EEUU, 2006.
- Peterson, J. Classical and Contemporary Sauce Making; John Wiley & Sons: Hoboken, EEUU, 2008.
- Larousse, D.P. The Soup Bible; John Wiley & Sons: New York, EEUU, 1997.
- This, H. Building a Meal - from Molecular Gastronomy to Culinary Constructivism. Columbia University Press: New York, EEUU, 2009.
- Cambero, M.L.; Pereira-Lima, C.; Ordóñez, J.A.; García de Fernando, G.D. Beef Broth Flavour: Study of Flavour Development. Journal of the Science of Food and Agricultural 2000, 80, 1510–1518.
- Spanier, A.M.; McMillin, K.W.; Miller, J.A. Enzyme Activity in Beef: Effect of Postmortem Aging and End-Point Cooking Temperature. Journal of Food Science 1990, 55, 318–326.
- Imafidon, G.I.; Spanier, A.M. Unraveling the Secret of Meat Flavor. Trends in Food Science and Technology 1994, 5, 315–321.
- Huyghues-Despointes, A.; Yaylayan, V. A Multidetector HPLC System for the Analysis of Maillard Reaction Mixtures, CIFST 36th Annual Conference, Toronto, Canada, 1993.
- Fuke, S.; Shimizu, T. Umami Flavour as a Means of Regulating Food Intake and Improving Nutrition and Health. Trends in Food Science and Technology 1993, 4, 246–251.
- MacLeod, G. The Flavour of Beef. In Flavor of Meat and Meat Products; Shahidi, F.; Ed.; Blackie: London, UK, 1994.
- Reina, R.; Sánchez del Pulgar, J.; López-Buesa, P.; Garcia, C.Amino Acid and Nucleotide Contents and Sensory Traits of Dry-Cured Products from Pigs with Different Genotypes. Meat Science 2014, 96, 230–236.
- Aristoy, M.C.; Toldrá, F. Nucleotides and its Derived Compounds. In Handbook of Muscle Foods Analysis; Nollet, M.L., Toldrá, F.; Eds.; CRC Press: Boca Raton, EEUU, 2009.
- Tikk, M.; Tikk, K; Torngren, M.A.; Meinert, L.; Aaslyng, M.D.; Karlsson, A.H.; Andersen, H.J. Development of Inosine Monophosphate and its Degradation Products during Aging of Pork of Different Qualities in Relation to Basic Taste and Retronasal Flavor Perception of the Meat. Journal of Agricultural and Food Chemistry 2006, 54, 7769–7777.
- Cambero, M.I.; Jaramillo, C.J.; Ordóñez, J.A.; Cobos, A.; Pereira-Lima, C.I.; García de Fernando, G.D. Effect of Cooking Conditions on the Flavour Compounds and Composition of Shrimp (Parapenaeus longirostris) Broth. Z Lebensm Unters Forsch A 1998, 206, 311–322.
- Chiang, P-D.; Yen, C-T.; Mau, J-L. Non-Volatile Taste Components of Various Broth Cubes. Food Chemistry 2007, 101, 932–937.
- Pereira-Lima, C.I.; Ordóñez, J.A.; García de Fernando, G.D.; Cambero, M.I. Influence of Heat Treatment on Carnosine, Anserine and Free Amino Acid Composition of Beef Broth and its Role in Flavour Development. European Food Research and Technology 2000, 210, 165–172.
- Yamaguchi, S. The Umami Taste. In Food Taste Chemistry; Boudreau, J.C., Ed.; American Chemical Society: Washington, EEUU, 1979.
- Maga, J.A. Umami flavour of meat. In Flavor of Meat and Meat Products; Shahidi, F., Ed; Blackie: London, UK, 1994.
- Yimdee, T.; Wang, X-C. Comparison of Odor and Taste of Commercial Brand Fish Sauces from East and South East Asian Countries. International Journal of Food Properties 2016, 19, 873–896.
- Mau, J-L. The Umami Taste of Edible and Medicinal Mushrooms. International Journal of Medicinal Mushrooms 2005, 7, 113–119.
- Wang, W-K.; Zhu, Y.; Tang, Y.; Ji-Ling Song, N-L.;, Yuan, W-D.; Jia, Y. Non-Volatile Taste Components of Different Cultivated Mushrooms at Mycelia, Primordium, and Fruit Body Cultivation Stages. International Journal of Food Properties 2016, 19, 1938–1948.
- Jiménez-Martín, E.; Ruiz, J.; Pérez-Palacios, T.; Silva, A.; Antequera, T. Gas Chromatography−Mass Spectrometry Method for the Determination of Free Amino Acids as their Dimethyl-Tert-Butylsilyl (TBDMS) Derivatives in Animal Source Food. Journal of Agricultural and Food Chemistry 2012, 60, 2456−2463.
- Watanabe, A.; Tsuneishi, E.; Takimoto, Y. Analysis of ATP and Its Breakdown Products in Beef by Reversed-Phase HPLC. Journal of Food Science 1989, 54, 1169–1172.
- Dai, Y.; Chang, H-J.; Cao, S-X.; Liu, D-Y.; Xu, X-L.; Zhou, G-H. Nonvolatile Taste Compounds in Cooked Chinese Nanjing Duck Meat following Postproduction Heat Treatment. Journal of Food Science 2011, 75, 674–679.
- Sell, D.R.; Strauch, C.M.; Shen, W.; Monnier, V.M. 2-Aminoadipic Acid is a Marker of Protein Carbonyl Oxidation in the Aging Human Skin: Effects of Diabetes, Renal Failure and Sepsis. Biochemical Journal 2008, 404, 269–277.
- Armenteros, M.; Heinonen, M.; Ollilainen, V.; Toldrá, F.; Estévez, M. Analysis of Protein Carbonyls in Meat Products by using the DNPH Method, Fluorescence Spectroscopy and Liquid Chromatography–Electrospray Ionization–Mass Spectrometry (LC–ESI–MS). Meat Science 2009, 83, 104–112.
- Utrera, M.; Morcuende, M.; Rodríguez-Carpena, J.G.; Estévez, M. Fluorescent HPLC for the Detection of Specific Protein Oxidation Carbonyls – α-Aminoadipic and γ-Glutamic Semialdehydes – in Meat Systems. Meat Science 2011, 89, 500–506.
- Hardy, J.; Parmentier, M.; Fanni, J. Functionality of Nutrients and Thermal Treatments of Food. Proceedings Nutrition Society 1999, 58, 579–585.
- Li, H.C.; Risch, S.J.; Reineccius, G.A. Flavour Formation during Frying and Subsequent Losses during Storage and Microwave Reheating in Pancakes. In Thermally Generated Flavours: Maillard, Microwave and Extrusion Process; Parliament, M.J., McGorrin, R.J., Eds.; American Chemical Society: Washington, EEUU, 1994.
- Chao, P.; Hsu, C.; Yin, M. Analysis of Glycative Products in Sauces and Sauce-Treated Foods. Food Chemistry 2009, 113, 262–266.
- Roldán, M.; Antequera, T.; Armenteros, M.; Ruiz, J. Effect of Different Temperature–Time Combinations on Lipid and Protein Oxidation of Sous-Vide Cooked Lamb Loins. Food Chemistry 2014, 149, 129–136.
- Estévez, M.; Ventanas, S.; Heinonen, M. Formation of Strecker Aldehydes between Protein Carbonyls – A-Aminoadipic And-Glutamic Semialdehydes – and Leucine and Isoleucine. Food Chemistry 2011, 128, 1051–1057.