
ABSTRACT
Quality changes induced in fresh papaya slices after cutting were evaluated using digital image analysis of colour and fractal metrics besides structural changes. Radial slices of papaya (65% and 85% ripe) were exposed to a controlled environment to simulate extreme conditions on a salad bar. Colour variation and mechanical-structural changes depended on surface dehydration, exposure time, and ripening stage. Relationship between fractal dimension, lacunarity, and time showed evidence of patterns associated with non-homogeneous colour changes related to structural variations. Fractal metrics had potential to reflect noticeable colour changes that would be useful for monitoring shelf stability of minimally processed papaya.
Introduction
Papaya fruit is well known for its delicate taste and high nutritional value[Citation1] and is considered to be a good source of carotenes (α, β carotene, β-criptoxantin, and lycopene); minerals, such as potassium; enzymes; and phenolic compounds.[Citation2,Citation3] Additionally, papaya is an important source of pantothenic acid, folic acid, vitamins C and D, minerals, and fibre.[Citation4] The consumption of this fruit has increased worldwide due to its health properties such as cholesterol reduction[Citation3] and anticancer activity.[Citation5] Fresh-cut papaya as a ready-to-eat, minimally processed product represents a promising opportunity for reducing post-harvest losses, which can reach up to 25%.[Citation6] However, ripening is induced as a consequence of cutting, which causes changes in the colour, taste, aroma, appearance, and texture of the fruit.
Colour has been reported to be the most important attribute in customers’ decisions to purchase.[Citation7] Traditionally, colour attributes have been evaluated by models that conceptualise colour spaces established from image attributes. RGB colour space is limited to represent colour as perceived by humans.[Citation8] CIELAB is a colour space that is considered to be reliable and is also the standard space used to compare colours.[Citation9] CIELAB measurements represent the average colour and standard deviation from all evaluated pixels from the region of interest. However, this evaluation could be restrictive when colour heterogeneity is inherent to sample nature.[Citation10] Image texture and fractal metrics may be other options that can be used to quantify the intensity of the changes in pixels containing colour information from non-homogeneous coloured objects. The fractal dimension (FD) is a parameter of image texture, which is evaluated as a Hausdorff dimension and measures the roughness of both spatial and time series data based on the concept of self-similarity.[Citation11] For a given object or part of it that occupies a Euclidean space, FD can be evaluated by using the box-counting algorithm. In this case, the spatial location (x, y) can be covered with N number of boxes of size r. FD is then defined by Eq. (1).[Citation11] A higher fractal dimension indicates a greater surface roughness.[Citation12] This concept has been used to monitor colour changes in the mottled skin of bananas,[Citation13] apples,[Citation14] and pears,[Citation15] among other fruits.
In contrast, lacunarity, L, explains the image homogeneity and symmetry based on the distribution of the pixels,[Citation16] where the ratio of the square of the standard deviation σ and the square of the mean (μ) change according to the size of the boxes, r. This parameter takes values from 0 to ∞, where 0 indicates homogeneity. The lacunarity, L, complements FD to measure the filled spaces as objects of limited self-similarity. These attributes are useful for evaluating complex textural patterns.[Citation11] Lacunarity analyses have been utilised to describe apple pores and melon skins.[Citation16,Citation17]
The perception of colour has been associated with other food quality attributes, such as flavour and nutritional value.[Citation8] Evaluating colour changes after cutting must also consider other attribute variations to understand the consequences of damage.[Citation18] FD is strongly correlated with the perception of surface roughness.[Citation19] Hence, FD and L evaluation could be applied, as a novel tool, to describe non-homogeneous colour changes. The purpose of this study was to evaluate the changes in the quality induced in fresh papaya after cutting by means of digital image analysis (DIA) via investigating the colour attributes and fractal parameters associated with structural variations in two ripening stages during environmental exposure to a simulated extreme environment of a salad bar-sale condition without a cold chain.
Materials and methods
Vegetal material
Hermaphroditic papaya of the variety Tainung from a crop in Valle del Cauca was selected, (3°25ʹN, 76° 36ʹ W Pacific region, Colombia), and samples were acquired from a local market (22.3 ± 2.2-cm maximum length, 11.6 ± 1.1-cm maximum diameter). Slices 65% and 85% ripe, range commonly accepted for processing and consume as ready-to-eat fresh fruit, were collected from the central zone of the papaya () according to a colour chart indicating the advance of ripeness related to the yellowness of the peel.[Citation7,Citation20]
Figure 1. Schematic representation of sampling and image analysis processing.
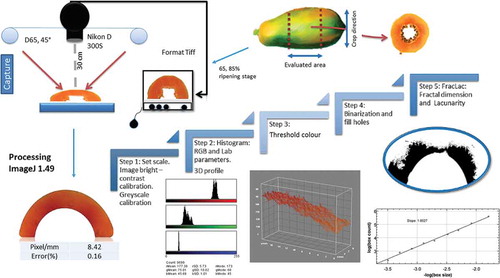
After the peel and seeds were manually separated, the papaya flesh was cut into slices (8 ± 1 mm thick) with an automatic electrical cutter (Professional food slicer, Continental, USA) equipped with a circular stainless steel blade with a diameter of 19.5 cm. The slices were exposed to 35 ± 0.5°C and 60% relative humidity (RH) (Oven FD115 BINDER, Bohemia, NY, USA) to simulate extreme market sale conditions for fresh-cut fruit without a cold chain. The slices were categorised according to the US Food and Drug Administration (FDA) regulatory norms for ready-to-eat food as fresh papaya for a salad bar.[Citation21] Additionally, the moisture (AOAC 934.06), total soluble solids (TSS), acidity, (expressed as citric acid equivalents according to AOAC 932.13 and AOAC 942.15), and water activity (assessed with an Aqualab dew point water activity metre 4TE [Pullman, WA, USA]) were determined. The moisture loss was calculated on a fresh weight basis (%FW) after 210 min of exposure to the environment. The initial tissue condition was used as the control, taking into account consumer expectations of maximum freshness immediately after cutting.
Image acquisition
Digital images were acquired after colour calibration under standardised conditions. A digital camera was placed vertically at a distance of 30 cm from the sample (Nikon D300 s) inside a wooden box with black walls. The illumination system included two fluorescent daylight lamps with a colour temperature of 6500 K (22 W) covered with light diffusers at a 45° angle from the sample plane and an angle of observation of 2° to avoid the presence of shadows.[Citation22] Images were captured every 30 min for 3.5 h with a resolution of 3664 * 2748 * 3 pixels (Length × Width × Colour Channel) and saved without compression in TIFF format. The system was calibrated with 16-colour charts and compared with a colorimeter ColorQuest XE (HunterLab, Reston, VA, USA).[Citation22] Optical microscopy images were acquired using a Nikon Eclipse Ti (Nikon corporation, Surrey, UK).
Colour and fractal analysis
Red-green-blue (RGB) parameters were collected from the colour histogram and transformed to CIELAB as described by Saldaña et al. 2014.[Citation22] The slope of the intensity values from the red channel was obtained by the plugin 3D surface plot v2.32 for ImageJ. The RGB attributes were evaluated as a* (redness: red for positive values and green for negative values), b* (yellowness: yellow for positive values and blue for negative values), Lab* (lightness), Cab* (chromaticity) as a saturation index (Eq. (2)), and Hab (hue) (Eq. (3)). The total colour change, ∆E*ab, was evaluated as the Euclidean distance between two points in the 3D colour space defined by (L*, a*, b*) according to Eq. (4),[Citation9,Citation23] corresponding to the relative change between the initial conditions and the value at time t.
FD and L were obtained using the ImageJ 1.49 software (National Institutes of Health, USA), as shown in . The size and greyscale values were standardised in all images using a calibrated greyscale. The fractal analysis was performed with the Fraclac Plugin in the ImageJ software using the Sliding Lacunarity Box Counting algorithm (SLAC). The lacunarity was evaluated with a combination of fixed-size boxes of between 2 and 128 pixels.[Citation24]
Instrumental texture analysis
The firmness of the fresh papaya subjected to each treatment was analysed with a Texture Analyser (TA.XT plus, Stable Micro Systems, Godalming, Surrey, UK).[Citation25] Cubic portions were obtained from slices exposed to the environment and collected every 30 min for 4 h. Samples obtained immediately after cutting were used as the control. A 25-mm stainless steel probe was applied under compression with a 0.5-mm/s test rate and a load cell of 5 kg, causing deformation of 3 mm. To establish the response to a penetration force, cylindrical samples with diameters of 3 cm obtained under the same conditions and frequency were placed on a heavy-duty plate. Then, a normal force was applied with a cylindrical probe (diameter: 6 mm) with a deformation rate of 0.8 mm/s.
Statistical analysis
Data from a non-structured experimental design for two ripening conditions at 8 time points were collected in triplicate, resulting in a total of 144 observations. An analysis of variance (ANOVA), Duncan’s, and Dunnet’s tests were performed in SPSS 21 (IBM, USA) to determine the effect of time by comparing each ripening stage with the initial conditions, which served as the control. The level of significance was assumed to be 2α = 0.05.
Results and discussion
Sample characterisation and the effect of moisture
The initial samples were characterised, and the corresponding information is presented in . Significant variations (p < 0.05) were observed in the moisture content and the moisture reduction according to the ripeness stage and exposure time. A previous study of unripe fresh-cut papaya reported a water loss of 13–14% after cutting,[Citation26] in agreement with the results of the current study. No differences in the water activity were noted as a result of ripening; however, the effect of time was significant for both ripeness conditions (). The sugar content (TSS) was likely affected by water binding via hydrogen bonding.
Table 1. Characterisation of attributes for each ripening condition.
Firmness and structural integrity
shows the firmness changes with time and ripeness. The results obtained for the initial conditions agreed with those reported by other studies evaluating the effect of refrigeration on texture.[Citation26] As expected, increasing the exposure time resulted in a soft texture that might be associated to pectin hydrolase activity from enzymes, such as polygalacturonase and pectin methyl esterase, which promote cell wall disruption.[Citation27] Tissue texture softening was also related to water loss. Moreover, after 90 min of environmental exposure, the formation of a protective layer because of tissue dehydration was observed.
Figure 2. Firmness variation during time per ripening condition. Left image corresponds to compression test, and right image explains the mechanical response under tissue penetration after cutting (papaya 85% ripening stage).
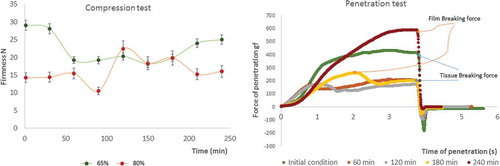
The 65% ripe samples showed a final average firmness reduction of 13.4%, whereas the 85% ripe samples exhibited an average increase of 12.6%. The ripeness was observed to be relevant to the final firmness: The 65% ripe samples were firmer than the 85% ripe samples after environmental exposure. At the end of the exposure time, the firmness values of both ripening stages were not significantly different from the initial condition (p < 0.05) because internal softening and surface dehydration occurred simultaneously after cutting. Some studies reported several simultaneous effects in fresh fruit after cutting, including humidity loss, electrolyte leakage,[Citation28] lipid peroxidation, pectin hydrolysis,[Citation29] and the development of a surface layer in fresh-cut papaya.[Citation30]
The development of a protective layer depends on the capability of vegetable cells to detect changes in osmotic pressure and mechanical damage and to preserve cell wall integrity via molecular signalling mechanisms and active proteins that defend tissues against dehydration, wounding, and microbial growth.[Citation31] Inevitable cellular damage after cutting because of cell wall breakage leads to lipid peroxidation that affects the cell membranes.[Citation29]
The evaluation of the texture by penetration with a 6-mm-diameter cylinder allowed to estimate the resistance of the protective layer by the firmness peak reached before and after cutting. (right) shows the structural changes with time related to the first positive peak coincident with the breaking force of the layer, a second firmness peak (2f) reflecting the tissue firmness, and the work required as the area under the curve. The results indicated that the breaking force and distance to rupturing increased with time until the end of the experiment. However, at a depth of 3 mm under the protective layer, the tissue continued to soften because of the enzyme activity of polygalacturonase.[Citation27]
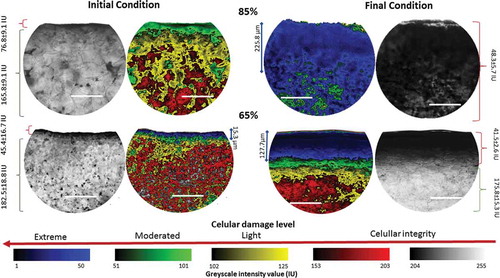
Significant differences in firmness were found at different time points and ripeness values (p < 0.05). Surface dehydration and the development of the protective layer affected tissue firmness, as indicated by the penetration test and the compression evaluation results. shows the structural damage revealed by photomicroscopy images. When determining the greyscale value and applying a 5-coloured code, it was possible to identify different levels of cell damage: Extreme damage level, between 0 and 50 IU; moderated level between 51 and 101; light level between 102 and 152 IU; and cellular integrity between 153 and 255. The arrows in indicate the deepness of this protective layer, which was remarkably different between the initial and final conditions for each ripeness stage. However, these findings must be confirmed in future studies using other techniques.
Figure 3. Structural damage after exposure per ripening stage. Greyscale intensity, at the external side of the images, shows the differences between normal and damaged tissue. Reference table, at the bottom of the figure, indicates the damage level. The extent of the extreme damage is indicated at the internal side of the images. All scale lines indicate 100 µm, and IU is intensity units.
Colour changes by CIELAB and RGB attributes
shows the changes in RGB with time and summarises the changes in the distribution of the RGB values in terms of ripeness and time of exposure. Each bin represents the probability of an intensity between 1 and 255, with an increase of one frequency unit for each pixel in the R, G, and B channels. The R, G, and B distribution depended on the ripeness and time. Indeed, the R-channel values described changes related to red saturation; however, when considering the amount of information contained in an image, the average variables of the RGB images did not reflect the local changes in the colour features.[Citation32]
Figure 4. RGB variation during observation time. First line shows variation for samples 85% ripening (Left) and 65% ripening (Right). Figures below illustrate histograms of RGB values for each ripening condition. Columns represent the frequency of RGB values for the same amount of pixels per image.
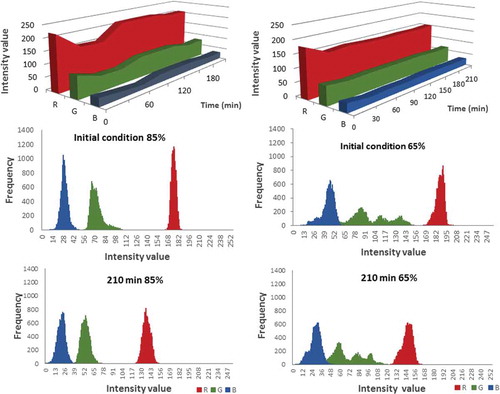
The CIELAB and RGB attributes did not readily indicate the visual redness of the papaya. It is important to note that other studies have noted some limitations of the traditional evaluation of RGB and CIELAB attributes due to the limitations of these techniques when imaging data are averaged without discriminating visually significant changes or considering the dependence on the texture and colour composition and the RGB distribution.[Citation32] The values of R and a* exhibited significant differences only at 30 and 60 min and depended on the ripeness and the time (p < 0.05).
The CIELAB attributes described the global colour but few differences in local features.[Citation32] The luminosity values of the 65% ripe samples increased by 19.8% but decreased by 15.6% for the 85% ripe samples at the end of the evaluation period (). The respiration rate and enzyme activity could be responsible for this phenomenon, as indicated by a previous study, in which the L* value increased with storage time and produced yellowness with no evidence of browning, as is common for other fruits.[Citation33] Carrots slices under a forced air drying process show first-order kinetics for the decrease in L at 45°C because of carotene degradation under such conditions.[Citation34] Dehydration of the papaya may also induce a decrease in colour luminosity after 4 days of storage at 4°C.[Citation35] This process was more rapid in 85% ripe samples, which were more sensitive to water loss. The polyphenol, tannin, and flavonoid levels could also affect the differences in the colour attributes because ripe papayas contain higher levels of these components.[Citation36]
Figure 5. Time progression of CIELAB attributes for each ripening stage. Arrows in Cab* vs. H°ab show the change in direction. Arrows in the a* vs. b* graph show the spots distribution into the red-yellow quadrant. Spots in those circles indicate significant differences between initial and final condition per each ripening stage.
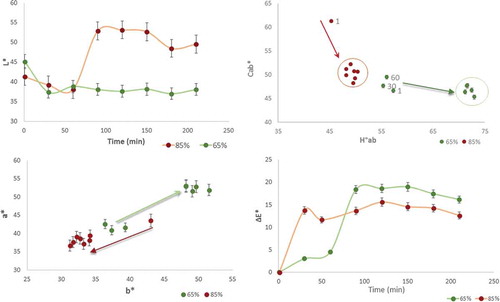
In contrast, the total colour differences (∆E) were 12.4 and 16.4 for the 85% and 65% ripe fruits, respectively, at the end of the experiment (). A similar colour variation was reported in slices of papaya var. Tainung after 4 days of storage at 4°C.[Citation35] The significant difference between the samples indicated higher redness in the 65% ripe papaya, meaning that partially unripe papaya could develop a pleasant colour after 60 min of environmental exposure, increasing consumer preference.
In , the relationship between Cab* and H°ab indicated that a decrease in saturation and an increase in hue promoted yellowness. The direction of the changes in a* vs. b* indicated the progression of redness for the 65% ripe samples and of yellowness for the 85% ripe samples. All of the colour differences were compared to the initial condition, and spot separation, highlighted by circles, showed no drastic variations after a maximum time of 60 min (p < 0.05).
Redness advance evaluation
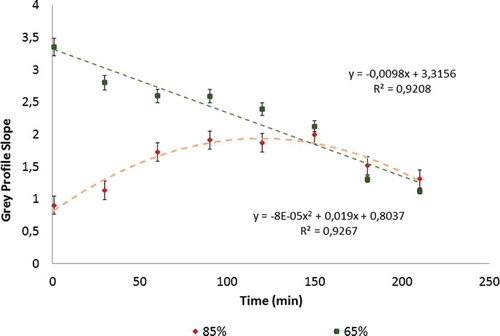
The 3D surface plot of the red channel shows the spatial distribution of colour from the centre of the slice towards the peel. The arrows in indicate the spreading direction of the redness from the centre of the slice towards the peel. The greyscale values from the red channel varied with the distance along the papaya slice. The intensity values were proportional to the height on the graph, and a higher intensity reflected a lower red saturation (). The slope described the red variation as a redness profile. An increase in the slope of this gradient reflected the advancement of the redness profile. The trend over time presented a significant correlation, as shown in . The 65% ripe samples showed a linear correlation with a decreasing slope over time. The trend of the 85% ripe samples indicated that a maximum change occurred after 90 min, according to the CIELAB results.
Figure 6. Three-dimensional surface plot of greyscale distribution in the papaya slices. Top images correspond to samples of papaya 85% ripening at different time after cutting. The arrows in the image reflect the redness direction in slices from the centre of the fruit to the papaya peel. Right 3D surface graphs reflect the progressive increase of the slope of grayscale intensity values along the papaya slices. Graph of greyscale intensity values describes the slope calculation from 3D surface of a sample 210-min exposure.
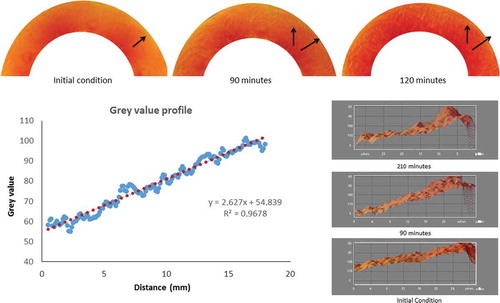
Figure 7. Greyscale intensity slope changes over exposure time for each ripening stage.
Redness and fractal descriptors
The fractal dimension and lacunarity (FD and L) were evaluated principally using the image information from the red channel. shows images of samples demonstrating the primary colour changes in 65% and 85% ripe papayas. Each image was obtained in a greyscale format and repainted with pseudo-colours by using a 16-colour LUT, which transformed the greyscale value into a set of 16 colours that reflected the difference in the greyscale intensity.[Citation37] Those colours show the pattern of changes in the red profile from light (yellow) as minimum, to dark (blue) as maximum. FD increased, and an inverse trend was observed for L, indicating a filling of the plane and the spreading of the redness profile. The filled plane’s shape was similar to the polycarpellary structure of this fruit.[Citation38]
Figure 8. Red channel intensity variation by image texture parameters. Top images show variation for 65% ripening while the bottom images illustrate changes for 85% ripening condition, reflecting heterogeneous distribution of red colour. Binarised images show the fingerprint of colour spreading with the respective fractal dimension and lacunarity values.
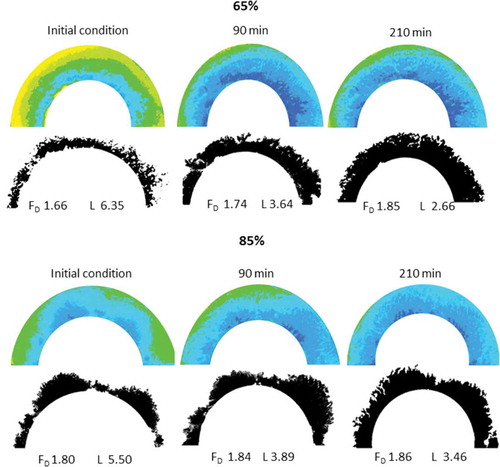
FD indicated patterns of redness associated with non-homogeneous colour changes in the papaya slices. (right) shows that 85% ripe slices exhibited a maximum change and then a reduced rate of change in FD, whereas the 65% ripe samples showed a rapid change in this parameter during the evaluation period. Consequently, an increment of FD resulted in higher complexity after exposure and a heterogeneous decrease in the colour parameters evaluated (here, luminosity and chromaticity). Because ripening may increase the respiration rate and local ethylene action,[Citation33] the 65% ripe samples may have been more strongly affected, as indicated by its trends towards decreased luminosity and saturation, whereas the 85% ripe samples tended to show a decrease in Cab*. Avocado fruits experiencing enzymatic browning have been reported to exhibit a similar behaviour of FD.[Citation39] Additionally, L showed no significant dependence on the ripeness but significant dependence on exposure time (p < 0.05). Exposure to temperatures exceeding 50°C and high oxygen pressure has been reported as a significant factor affecting carotene stability, whereas light exposure has not been found to be a significant factor.[Citation40] Nevertheless, structural changes caused by the breakdown of tissues after cutting could be the primary factor allowing carotene migration while simultaneously protecting the carotenes from oxidation by covering them with pectin hydrolysis products, as confirmed by other studies.[Citation41]
Figure 9. Image texture parameters. Fractal dimension variation with time for both ripening conditions (Left image). Lacunarity variation vs. greyscale intensity slope for both ripening conditions (Right image).
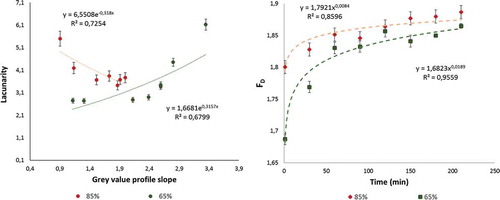
A relationship between L and the slope of the redness profile was found. The relationship described by the trend line equations in (left) had Pearson correlation coefficients of 0.84 and 0.82 for 65% and 85% ripe samples, respectively. However, a linear fit was not adequate to describe these trends. The negative slope indicates an inverse process, with ripening fruits tending to show reduced colour heterogeneity over time. However, partially unripe fruit tended towards redness, increasing its complexity. Hence, over time, partially unripe papaya will take on a similar appearance to ripening papaya but have a more stable structure. Moreover, FD and L were useful for describing the complex colour changes in papaya slices that were statistically associated with moisture loss and exposure time (p < 0.05). All of this information might be useful for promoting the consumption of partially ripe papaya as part of a healthy diet, allowing the fruit to be stored for a longer time before consumption while retaining better stability and quality.
Conclusion
The maximum variation in the CIELAB and RGB colour attributes was detected at 60 min and did not change until the end of the evaluation period for either ripeness stages (p < 0.05). Papaya ripeness and the exposure time after cutting affected the colour changes. The firmness of the tissue depended on the surface dehydration and the development of the protective layer. The relationship among FD, L, and environmental exposure showed patterns of redness spreading associated with non-homogeneous colour changes on the surface of the papaya slices, with a steeper gradient exhibited by the 65% ripe papayas. The image texture attributes (FD and L) were useful for describing the non-homogenous colour and reflecting remarkable visually perceived colour changes. Thus, they are important attributes that should be considered for monitoring freshness after cutting minimally processed papaya.
Funding
Thanks are due to the Special Endowment Fund of the Universidad de La Sabana (Project 117-2010) for providing a grant for the first author and the financial resources for the development of this project and to the Escuela Nacional de Ciencias Biológicas from the Instituto Politécnico Nacional of México for the counselling process (SIP 20150613).
Additional information
Funding
References
- Jayathunge, K.G.L.R.; Gunawardhana, D.K.S.N.; Illeperuma, D.C.K.; Chandrajith, U.G.; Thilakarathne, B.M.K.S.; Fernando, M.D.; Palipane, K.B. Physico-Chemical and Sensory Quality of Fresh Cut Papaya (Carica papaya) Packaged in Micro-Perforated Polyvinyl Chloride Containers. Journal of Food Science and Technology 2014, 51, 3918–3925. doi:10.1007/s13197-013-0952-8.
- Schweiggert, R.M.; Kopec, R.E.; Villalobos-Gutierrez, M.G.; Högel, J.; Quesada, S.; Esquivel, P.; Schwartz, S.J.; Carle, R. Carotenoids are More Bioavailable from Papaya than from Tomato and Carrot in Humans: A Randomised Cross-Over Study. British Journal of Nutrition 2014, 111, 490–498. doi:10.1017/S0007114513002596.
- Saeed, F.; Arshad, M.U.; Pasha, I.; Naz, R.; Batool, R.; Khan, A.A.; Nasir, M.A.; Shafique, B. Nutritional and Phyto-Therapeutic Potential of Papaya (Carica papaya Linn.): An Overview. International. Journal of Food Properties 2014, 17, 1637–1653. doi:10.1080/10942912.2012.709210.
- Vij, T.; Prashar, Y. A Review on Medicinal Properties of Carica papaya Linn. Asian Pacific Journal of Tropical Disease 2015, 5, 1–6. doi:10.1016/S2222-1808(14)60617-4.
- Li, Z.-Y.; Wang, Y.; Shen, W.-T.; Zhou, P. Content Determination of Benzyl Glucosinolate and Anti–Cancer Activity of its Hydrolysis Product in Carica papaya L. Asian Pacific Journal of Tropical Medicine 2012, 5, 231–233. doi:10.1016/S1995-7645(12)60030-3.
- Mishra, B.B.; Gautam, S.; Chander, R.; Sharma, A. Characterization of Nutritional, Organoleptic and Functional Properties of Intermediate Moisture Shelf Stable Ready-to-Eat Carica papaya Cubes. Food Biosciences 2015, 10, 69–79. doi:10.1016/j.fbio.2015.02.001.
- Costa, C.; Antonucci, F.; Pallottino, F.; Aguzzi, J.; Sun, D.-W.; Menesatti, P. Shape Analysis of Agricultural Products: A Review of Recent Research Advances and Potential Application to Computer Vision. Food Bioprocess Technology 2011, 4, 673–692. doi:10.1007/s11947-011-0556-0.
- Pathare, P.B.; Opara, U.L.; Al-Said, F.A.J. Colour Measurement and Analysis in Fresh and Processed Foods: A Review. Food Bioprocessing Technology 2013, 6, 36–60. doi:10.1007/s11947-012-0867-9.
- Bansal, S.; Aggarwal, D. Color Image Segmentation Using Cielab Color Space Using Ant Colony Optimization. International Journal of Computer Applications 2011, 1, 415–420.
- Rodríguez-Pulido, F.J.; Gordillo, B.; González-Miret, M.L.; Heredia, F.J. Analysis of Food Appearance Properties by Computer Vision Applying Ellipsoids to Colour Data. Computers and Electronics in Agriculture 2013, 99, 108–115. doi:10.1016/j.compag.2013.08.027.
- Arzate-Vázquez, I.; Chanona-Pérez, J.J.; De Perea-Flores, M.J.; Calderón-Domínguez, G.; Moreno-Armendáriz, M.A.; Calvo, H.; Godoy-Calderón, S.; Quevedo, R.; Gutiérrez-López, G. Image Processing Applied to Classification of Avocado Variety Hass (Persea americana Mill.) during the Ripening Process. Food Bioprocess Technology 2011, 4, 1307–1313. doi:10.1007/s11947-011-0595-6.
- Li, J.; Du, Q.; Sun, C. An Improved Box-Counting Method for Image Fractal Dimension Estimation. Pattern Recognition 2009, 42, 2460–2469. doi:10.1016/j.patcog.2009.03.001.
- Quevedo, R.; Mendoza, F.; Aguilera, J.M.; Chanona, J.; Gutiérrez-López, G. Determination of Senescent Spotting in Banana (Musa Cavendish) Using Fractal Texture Fourier Image. Journal of Food Engineering 2009, 84, 509–515. doi:10.1016/j.jfoodeng.2007.06.013.
- Quevedo, R.; Jaramillo, M.; Diaz, O.; Pedreschi, F.; Aguilera, J.M. Quantification of Enzymatic Browning in Apple Slices Applying the Fractal Texture Fourier Image. Journal of Food Engineering 2009, 95, 285–290. doi:10.1016/j.jfoodeng.2009.05.007.
- Quevedo, R.; Díaz, O.; Caqueo, A.; Ronceros, B.; Aguilera, J.M. Quantification of Enzymatic Browning Kinetics in Pear Slices Using Non-Homogenous L* Color Information from Digital Images. LWT - Food Science and Technology 2009, 42, 1367–1373. doi:10.1016/j.lwt.2009.03.011.
- Mendoza, F.; Verboven, P.; Tri Ho, Q.; Kerckhofs, G.; Wevers, M.; Nicolaï, B. Multifractal Properties of Pore-Size Distribution in Apple Tissue Using X-Ray Imaging. Journal of Food Engineering 2010, 99, 206–215. doi:10.1016/j.jfoodeng.2010.02.021.
- Li, L.; Chang, L.; Ke, S.; Huang, D. Multifractal Analysis and Lacunarity Analysis: A Promising Method for the Automated Assessment of Muskmelon (Cucumis melo L.). Epidermis Netting. Computers and Electronics in Agriculture 2012, 88, 72–84. doi:10.1016/j.compag.2012.06.006.
- Wang, Q.; Cantwell, M. Quality Changes and Respiration Rates of Fresh‐Cut Sunchoke Tubers (Helianthus tuberosus L.). Journal of Food Processing and Preservation 2015, 39, 634–644. doi:10.1111/jfpp.12271.
- Backes, A.R.; Casanova, D.; Bruno, O.M. Color Texture Analysis Based on Fractal Descriptors. Pattern Recognition 2012, 45, 1984–1992.
- Basulto, F.S.; Duch, E.S.; Y-Gil, F.E.; Díaz Plaza, R.; Saavedra, A.L.; Santamaría, J.M. Postharvest Ripening and Maturity Indices for Maradol Papaya. Interciencia 2009, 34, 583–588.
- US Food and Drug Administration. Food Code 2013; US Health and Human Services: College Park, MD, 2013; 768 pp.
- Saldaña, E.; Siche, R.; Castro, W.; Huamán, R.; Quevedo, R. Measurement Parameter of Color on Yacon (Smallanthus sonchifolius) Slices Using a Computer Vision System. LWT - Food Science and Technology 2014, 59, 1220–1226. doi:10.1016/j.lwt.2014.06.037.
- Rasband, W.S. ImageJ: Image Processing and Analysis in Java. Astrophysics Source Code Library 2012, 1, 06013.
- Fernández-Vázquez, R.; Stinco, C.M.; Hernanz, D.; Heredia, F.J.; Vicario, I.M. Colour Training and Colour Differences Thresholds in Orange Juice. Food Quality and Preference 2013, 30, 320–327. doi:10.1016/j.foodqual.2013.05.018.
- Alam, M.S.; Kaur, B.; Gupta, K.; Kumar, S. Studies on Refrigerated Storage of Minimally Processed Papaya (Carica papaya L.). Agricultural Engineering International: CIGR Journal 2013, 15, 275–280.
- Tirkey, B.; Pal, U.S.; Bal, L.M.; Sahoo, N.R.; Bakhara, C.K.; Panda, M.K. Evaluation of Physico-Chemical Changes of Fresh-Cut Unripe Papaya during Storage. Journal of Food Packaging and Shelf Life 2014, 1, 190–197. doi:10.1016/j.fpsl.2014.02.002.
- Fabi, J.P.; Broetto, S.G.; DA Silva, S.L.; Zhong, S.; Lajolo, F.M.; Do Nascimento, J.R.O. Analysis of Papaya Cell Wall-Related Genes during Fruit Ripening Indicates a Central Role of Polygalacturonases during Pulp Softening. Plos One 2014, 9, e105685. doi:10.1371/journal.pone.0105685.
- Xiao, C.; Zhu, L.; Luo, W.; Song, X.; Deng, Y. Combined Action of Pure Oxygen Pretreatment and Chitosan Coating Incorporated with Rosemary Extracts on the Quality of Fresh-Cut Pears. Journal of Food Chemistry 2010, 121, 1003–1009. doi:10.1016/j.foodchem.2010.01.038.
- Carvalho, R.L.; Cabral, M.F.; Germano, T.A.; De Carvalho, W.M.; Brasil, I.M.; Gallão, M.I.; Mourad, C.F.; Lopes, M.M.; De Miranda, M.R.A. Chitosan Coating with Trans-Cinnamaldehyde Improves Structural Integrity and Antioxidant Metabolism of Fresh-Cut Melon. Postharvest Biology and Technology 2016, 113, 29–39. doi:10.1016/j.postharvbio.2015.11.004.
- Hamann, T. Plant Cell Wall Integrity Maintenance as an Essential Component of Biotic Stress Response Mechanisms. Frontiers in Plant Science 2012, 3, 77. doi:10.3389/fpls.2012.00077.
- Argañosa, A.S.J.; Raposo, M.F.J.; Teixeira, P.C.M.; Morais, A.M.M.B. Effect of Cut‐Type on Quality of Minimally Processed Papaya. Journal of the Science of Food and Agriculture2008, 88, 2050–2060. doi:10.1002/jsfa.3309.
- Thyagharajan, K.K.; Minu, R.I. Prevalent Color Extraction and Indexing. International Journal of Engineering and Technology 2013, 5, 4841–4849.
- Morais, A.M.; Argañosa, A.C.S. Quality during Storage of Fresh-Cut Papaya (Carica papaya L.) in Various Shapes. The Philippine Agricultural Scientist 2010, 93, 88–96.
- Demilay, E.; Tulek, Y. Color Degradation Kinetics of Carrot (Daucus carota L.) Slices during Hot Air Drying. Journal of Food Processing and Preservation 2015, 39, 800–805. doi:10.1016/j.fbio.2015.02.001.
- Chien, P.; Lin, H.; Su, M. Effects of Edible Micronized Chitosan Coating on Quality and Shelf Life of Sliced Papaya. Food and Nutrition Sciences 2013, 4, 9–13. doi:10.4236/fns.2013.49A2002.
- Annegowda, H.V.; Bhat, R.; Yeong, K.J.; Liong, M.-T.; Karim, A.A.; Mansor, S.M. Influence of Drying Treatments on Polyphenolic Contents and Antioxidant Properties of Raw and Ripe Papaya (Carica papaya L.). International Journal of Food Properties 2014, 17(2), 283–292. doi:10.1080/10942912.2011.631248.
- Schindelin, J.; Arganda-Carreras, I.; Frise, E.; Kaynig, V.; Longair, M.; Pietzsch, T.; Preibisch, S.; Rueden, C.; Saalfeld, S.; Schmid, B.; Tinevez, J.Y. Fiji: An Open-Source Platform for Biological-Image Analysis. Nature Methods 2012, 9, 676–682. doi:10.1038/nmeth.2019.
- Aryal, R.; Jagadeeswaran, G.; Zheng, Y.; Yu, Q.; Sunkar, R.; Ming, R. Sex Specific Expression and Distribution of Small RNAs in Papaya. BMC Genomics 2014, 15, 20. doi:10.1186/1471-2164-15-20.
- Quevedo, R.; Valencia, E.; Bastías, J.M.; Cárdenas, S. Description of the Enzymatic Browning in Avocado Slice Using GLCM Image Texture. in Image and Video Technology. in Pacific-Rim Symposium on Image and Video Technology; New York, USA: Springer, 2013; 93–101 pp.
- Dias, M.G.; Camões, M.F.G.; Oliveira, L. Carotenoid Stability in Fruits, Vegetables and Working Standards–Effect of Storage Temperature and Time. Journal of Food Chemistry 2014, 156, 37–41. doi:10.1016/j.foodchem.2014.01.050.
- Xu, D.; Wang, X.; Jiang, J.; Yuan, F.; Gao, Y. Impact of Whey Protein–Beet Pectin Conjugation on the Physicochemical Stability of Β-Carotene Emulsions. Food Hydrocolloids 2012, 28, 258–266. doi:10.1016/j.foodhyd.2012.01.002