
ABSTRACT
The prevalence of type 2 diabetes is increasing rapidly across the world, particularly in Asian countries. This has necessitated the development of hypoglycaemic foods. In this study, the effect of selected ingredients such as barley, oats, gluten, and guar gum on in vitro starch digestibility and in vitro glycaemic index (GI) of four Indian traditional foods (idli, dosa, upma, and chapatti) was investigated. Barley and oats were added at levels of 1–9 g/100 g flour, while gluten and guar gum were added at levels of 1–5 g/100 g flour. An increase in the content of all the four ingredients increased the slowly digestible and resistant starch while decreasing the rapidly digestible starch in all the products under study. A linear decrease in GI was observed with an increase in the levels of added ingredients. Oats and guar gum were more effective in reducing starch digestibility and GI. Oats at 9 g/100 g flour and guar gum at 5 g/100 g flour decreased the GI of idli by 22.67 and 15.82%, of dosa by 17.79 and 17.76%, of upma by 15.43 and 16.59%, and of chapatti by 19.88 and 18.08%, respectively. A strong positive correlation was observed between GI and RDS, while GI showed a strong negative correlation with SDS and RS.
Introduction
Cereal-based foods are a major source of energy in the daily diet of people worldwide due to the presence of starch as the main carbohydrate component. The rate and extent of starch digestion are nutritionally significant, particularly in populations with high prevalence of lifestyle diseases like diabetes. Starch can be classified into rapidly digestible starch (RDS), slowly digestible starch (SDS), and resistant starch (RS) on the basis of the rate of enzymatic digestion.[Citation1] The RDS fraction is responsible for a sudden surge in levels of blood glucose, SDS fraction undergoes slower digestion in the small intestine, while RS escapes digestion and is eventually fermented in the large intestine.[Citation2] Thus, the relative proportions of RDS, SDS, and RS determine the glycaemic response of a food. A study by Sharavathy et al.,[Citation3] on ten Indian cereal-based foods showed the contents of total starch (TS), RDS, SDS, and RS to be dependent on the accompaniment consumed with these foods.
GI is another important indicator of glycaemic response introduced by Jenkins et al.[Citation4] GI is estimated by determining the relative increment in the concentration of blood glucose after consumption of a test meal over a set period of time when compared to that of an equi-carbohydrate control meal which is normally white bread or glucose. It is determined by an in vivo method but can also be estimated by in vitro methods which correlate well with the in vivo method.[Citation5] Foods can be categorised as low GI (≤55), medium G1 (56–69), and high GI (≥70). Investigations on the effect of low GI foods on blood glucose response[Citation6,Citation7] have shown them to result in a gradual and controlled rise in levels of blood glucose due to their slower rate of digestion and absorption.[Citation8] Hypoglycaemic foods play a positive role in the prevention and management of type 2 Diabetes mellitus,[Citation9,Citation10] obesity,[Citation11] cardiovascular diseases,[Citation12] hyperlipidaemia,[Citation13] and hypercholesterolemia.[Citation14,Citation15]
The incidence of type 2 diabetes and related metabolic syndrome has increased tremendously in urban India.[Citation16] One of the approaches to contain this would be the development of cereal-based staples with low GI. Reports on low GI Indian traditional foods[Citation17,Citation18] are scant. In India, a wide range of wheat- and rice-based products are consumed daily. Most of the wheat produced in India is utilised in the form of a flat bread, chapatti; almost every household consumes chapatti, generally twice a day. Upma is another wheat (semolina) based product which is a popular breakfast item. Idli and dosa are prepared from a fermented batter made up of rice and black gram and are routinely consumed in south India. The fermented batter is shallow fried to a circular, crisp, thin, pancake-like product called dosa[Citation19], or steamed to a round, spongy, and soft product with a characteristic sour flavour called idli.[Citation20] These products can be suitably modified by incorporation of ingredients/additives in order to retard their rate of starch digestion and glucose release. For instance, β-glucan[Citation21,Citation22] and guar gum[Citation23] are soluble fibres known to lower GI when added to foods.
This study was undertaken to evaluate the effect of addition of barley, oats, gluten, and guar gum on starch digestibility and GI of idli, dosa, upma, and chapatti formulations. Further, correlation between RDS, SDS, RS fractions and in vitro GI for these traditional foods, which have hitherto not been reported, has been investigated.
Materials and methods
Materials
Two rice-based products and two wheat-based products were chosen for the study. Rice idli premix (Gits), dosa premix (Gits), upma premix (Gits), wheat flour (Ashirvaad, ITC), double filtered groundnut oil (Dhara), table salt (Tata), barley grains and oats (Bagrry’s) were purchased from a local market in Matunga, Mumbai. Barley and oats were milled to obtain flour of 40 mesh size. Gluten and guar gum (of viscosity ≈7600 cPs at a concentration of 1 g/100 mL) were procured from Sigma, Mumbai, India.
For estimation of starch digestibility, pancreatin from porcine pancreas 8 × USP specification, amyloglucosidase from Aspergillus niger AMG 300 L with activity ≥300 U/mL, amyloglucosidase from Aspergillus niger (lyophilised powder with activity 70 units/mg), and invertase from Baker’s yeast (Saccharomyces cerevisiae) Grade VII- ≥300 U/mg solid were used. All other chemicals used for analysis were of analytical grade and procured from HiMedia, Mumbai. Polypropylene centrifuge tubes (50 mL) with screw caps and drilled glass balls (1.5 cm) were also used.
For estimation of GI, α-amylase from Bacillus licheniformis, Termamyl—120, Type XII-A (Sigma A3403-1MU) with activity ≥500 unit/mL, amyloglucosidase (Sigma 10115-1G) with activity of 70 units/mg, and Pancreatin 4X from Porcine pancreas (Sigma P1750-100G) were procured from Sigma (Mumbai, India). Glucose oxidase-peroxidase (GOD-POD) kit D.L. No.: KD-300 was purchased from Accurex, Mumbai and used for estimation of both starch digestibility and GI.
Methods
Methods for the preparation of idli, dosa, upma, and chapatti with and without the addition of different ingredients were standardised. Based on a preliminary screening, the levels of substitution with the ingredients were selected. Barley and oats were added at 1, 3, 5, 7, and 9 g per 100 g flour/premix, while gluten and guar gum were added at 1, 3, and 5 g per 100 g flour/premix.
Preparation of idli
Control and experimental idlis with added barley/oats/gluten/guar gum were prepared by the traditional method of steam cooking using a commercial rice idli premix. Barley, oats, and gluten were incorporated individually in the idli premix to form a homogenous mixture which was then made into a batter by adding 160 mL water to 100 g premix. The batter (~65 g) was transferred into individual cups of the aluminium idli mould (please see supplementary file Fig. S1) and cooked for 20 min in a steam cooker. After cooking, the idlis were de-moulded, cooled for 10 min at room temperature (RT, ~ 27 ± 2°C), and stored in an air tight container. Incorporation of guar gum in the idli premix was similar to the other ingredients as above but required additional 5 mL water per gram of added guar gum.
Preparation of dosa
Pre-weighed ingredient (barley, oats, and gluten) was incorporated individually at various levels in the commercial dosa premix and mixed well to obtain 100 g of a homogenous mixture. Dosa batter was prepared by adding 180 mL water to 100 g premix and allowed to stand for 5 min. It was then spread evenly (approximately 75 mL at a time) in an outward circular motion over a preheated (200 ± 3°C) non-stick griddle or tawa. No oil was used for cooking. Dosa (~20 cm diameter) was prepared by roasting for approximately 2 min on one side and 1 min on the other side until the development of golden brown colour. The dosas were cooled at RT and stored in an air tight container. Incorporation of guar gum in the dosa premix was similar to that of the other ingredients as above but required an additional 10 mL water per gram of added guar gum.
Preparation of upma
Pre-weighed ingredient (barley, oats, and gluten) was mixed individually in varying proportions with commercial upma premix to obtain 100 g of homogenous mixture. This premix was added to boiling water (300 mL) and simmered for 5 min with occasional stirring until the required consistency of upma was obtained. The upma so prepared was cooled at RT for 10 min, kept in an airtight container, and used immediately for further analysis. Incorporation of guar gum in the upma premix was similar to that of the other ingredients as above but required an additional 9 mL water per gram of guar gum.
Preparation of chapatti
Pre-weighed ingredient (barley, oats, and gluten) was blended with commercial whole wheat flour. Chapatti was prepared by the traditional method explained by Ghodke and Ananthanarayan.[Citation24] The chapattis were cooled at RT for 5 min, stored in an airtight container, and then used immediately for further analysis. Incorporation of guar gum in the wheat flour required an additional 5 mL water per gram of added guar gum.
Analysis for starch digestibility
Starch digestibility of the four food products with and without added ingredients was analysed in terms of total starch (TS), rapidly digestible starch (RDS), slowly digestible starch (SDS), and resistant starch (RS) using an enzymatic digestion by pancreatin, invertase, and amyloglucosidase as per the method developed by Englyst et al.[Citation1] The analytical protocol requires the sample to ideally contain 700–900 mg starch.[Citation1] Hence, the content of moisture and total starch was determined for each food product, and the quantity of sample (wet weight) which would contain 900 mg starch was calculated. The analysis was carried out for a range of sample quantities set around the computed value with intervals of 250 mg. The optimum sample quantity for starch digestibility analysis was found to be 3500, 3000, 4500, and 2500 mg for idli, dosa, upma, and chapatti, respectively. The optimised sample quantities of the freshly prepared food products were analysed for contents of free glucose (FG), RDS, SDS, RS, and total glucose (TG) in triplicates.
Analysis for estimation of GI
Estimation of glycaemic index (GI) involved analysis of available starch and starch hydrolysis index 90 (HI 90) as per the formula given by Goni et al.[Citation5] The optimum sample quantity to be used for available starch analysis was found to be 400 mg for idli, 350 mg for dosa, 600 mg for upma, and 250 mg for chapatti. The percentage available starch did not increase above these quantities under the given set of experimental conditions. The percentage available starch was determined by a procedure of Holm et al.[Citation25] Fresh chapatti sample (250 mg) was homogenised in a mortar pestle with 5 mL distilled water (DW) and then transferred to a conical flask with 10 mL DW. It was then treated with 200 µl termamyl enzyme for 15 min in a boiling water bath with mixing after every 5 min. The suspension was cooled and diluted to a final volume of 25 mL with DW. The clear solution at the top (1 mL) was incubated with 2 mL of sodium phosphate buffer (pH 4.75) and 1 mL of amyloglucosidase solution (5 mg amyloglucosidase dissolved in 25 mL of the same buffer) at 60°C for 30 min with gentle mixing every 5 min. It was then diluted to 10 mL with DW. Glucose was estimated by using GOD-POD kit. The percentage available starch was estimated using the Eq. (1), a simplified version of equation used by Holm et al.[Citation25]
The optimum amount of sample to be used for HI 90 analysis was found to be 1600 mg for idli, 1400 mg for dosa, 2400 mg for upma, and 1000 mg for chapatti. HI 90 was estimated by a method used by Holm et al.[Citation26] with modifications. Fresh chapatti (1 g) was homogenised and suspended in 50 mL of 0.1 M phosphate buffer (pH 6.9). Then 5 mL of the same buffer containing 500 mg pancreatin was added and the mixture was incubated at 37°C with continuous shaking for 90 min. Clear sample solution (0.1 mL) was drawn at 0 min and exactly after 90 min and analysed for maltose using the DNSA method. Results were expressed as mg maltose released after 90 min of hydrolysis of 1 g sample (dry weight). From the value of percent available starch in the sample obtained previously, mg starch/g sample and mg maltose released/mg starch in the sample was calculated. HI 90 was estimated using Eq. (2).
From values of percent available starch and HI 90, GI was calculated using Eq. (3) as given by Goni et al.[Citation5]
Sensory evaluation of food samples containing added ingredients
Sensory acceptability of idli, dosa, upma, and chapatti incorporated with barley (1–9 g/100 g four), oats (1–9 g/100 g flour), gluten (1–5 g/100 g flour), and guar gum (1–5 g/100 g flour) was evaluated by 12 semi-trained panelists in the age group of 20–30 years and familiar with the products since childhood for appearance, texture, mouthfeel, flavour, and overall acceptability on a 9-point hedonic scale (1: Dislike extremely, 2: Dislike very much, 3: Dislike moderately, 4: Dislike slightly, 5: Neither like nor dislike, 6: Like slightly, 7: Like moderately, 8: Like very much, 9: Like extremely).
Statistical analysis
All the experiments were performed in triplicates, and the mean and standard deviation values were calculated. The data was analysed by one-way analysis of variance (ANOVA) and Tukey’s-b multiple range test using SPSS Software. The significance of difference was defined at P ≤ 0.05.
Results and discussion
Effect of added ingredients on starch digestibility
The influence of added ingredients on starch digestibility in idli, dosa, upma, and chapatti was studied by estimating the content of total starch and its fractions—RDS, SDS, and RS, on as-is basis.
Effect of added ingredients on total starch (TS) content of idli, dosa, upma, and chapatti
Incorporation of all the four ingredients (barley, oats, gluten, guar gum) decreased the TS content of idli, dosa, upma, and chapatti slightly (). The decrease in TS was directly proportional to the content of the ingredients chosen in the study. Similar findings were reported by Brennan et al.[Citation27] in a study where fibre sources such as bran, inulin, guar, and swede were incorporated in an extruded breakfast cereal product. In the present work, the reduction in TS of the products containing gluten and guar gum corresponded well with their level of replacement since both are starch-free ingredients. Although barley and oats do contain starch, their addition also decreased the TS slightly in all the products.
Figure 1. Effect of added ingredients on total starch (TS) of idli, dosa, upma, and chapatti; (a)-barley flour, (b)- oats flour, (c)- gluten, (d)- guar gum.
Ingredient %: g ingredient/100 g flour or premix; Mean values with different superscript letters (a–d) are significantly different (P ≤ 0.05); TS (%): g/100 g product on dry weight basis, n = 3.
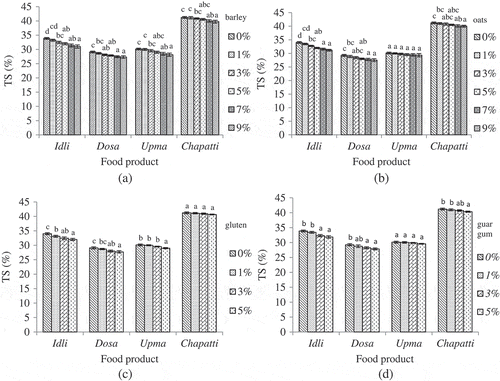
The TS contents of control samples of idli, dosa, upma, and chapatti were 33.87%, 29.09%, 30.12%, and 41.23% (w/w, dry basis), respectively. The maximum reduction in TS content on incorporation of ingredients was seen in idlis prepared with supplementation of barley and oats, both at 9 g/100 g flour. The change in all other cases ranged from 1.41% to 6.64%.
Effect of added ingredients on RDS content of idli, dosa, upma, and chapatti
RDS is that fraction of starch which is digested to release glucose in the first 20 min of enzymatic hydrolysis. It mainly consists of amorphous and dispersed starch.[Citation2] RDS undergoes rapid digestion in the duodenum and proximal part of the small intestine resulting in a rapid surge in blood glucose levels (hyperglycaemia). Such fluctuations may disturb glucose homeostasis and damage the cell and eventually the organ.[Citation28,Citation29] Hence, foods with a lower content of RDS are preferred for management of glucose intolerance and diabetes. Addition of barley (1–9 g/100 g flour), oats (1–9 g/100 g flour), gluten (1–5 g/100 g flour,) and guar gum (1–5 g/100 g flour) significantly retarded the digestibility of starch in terms of the RDS fraction in all the four food products under study (), the reduction being directly proportional to the level of the added ingredients.
Figure 2. Effect of added ingredients on rapidly digestible starch (RDS) of idli, dosa, upma, and chapatti; (a)- barley flour, (b)- oats flour, (c)- gluten, (d)- guar gum.
Ingredient %: g ingredient/100 g flour or premix; Mean values with different superscript letters (a–f) are significantly different (P ≤ 0.05); RDS (%): g/100 g product on dry weight basis, n = 3.
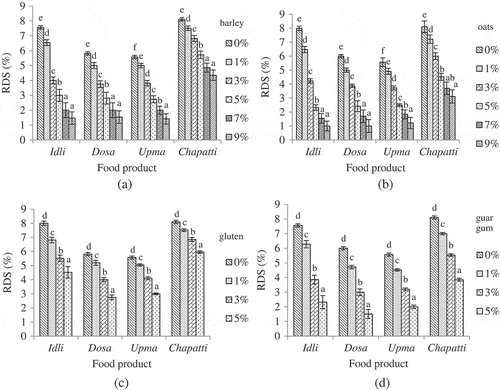
As seen in , the RDS content of idli and dosa were reduced from 7.56% and 5.81% (control) to 1.47% and 1.54%, respectively, on addition of barley at 9 g/100 g flour. Thus, the percentage reduction observed in RDS (ΔRDS) was 80.56% for idli and 73.49% for dosa. RDS fractions of upma and chapatti were reduced to 1.42% (ΔRDS: 74.51%) and 4.35% (ΔRDS: 46.30%), respectively. Addition of oats at 9 g/100 g flour decreased RDS of idli and dosa to 1.00% (ΔRDS: 86.77%) and 1.00% (ΔRDS: 82.79%), respectively, while that of upma and chapatti was reduced to 1.22% (ΔRDS: 78.10%) and 3.12% (ΔRDS: 61.48%), respectively (). Substitution with gluten at 5 g/100 g flour lowered RDS of idli to 4.5% (ΔRDS: 40.48%), dosa to 2.75% (ΔRDS: 52.67%), upma to 3% (ΔRDS: 46.14%), and chapatti to 5.95% (ΔRDS: 26.54%) (Fig. 2c). Addition of guar gum at 5 g/100 g flour decreased RDS to 2.32% (ΔRDS: 69.31%) in idli, 1.51% (ΔRDS: 74.83%) in dosa, 2.00% (ΔRDS: 64.09%) in upma, and 3.85% (ΔRDS: 52.47%) in chapatti, respectively (Fig. 2d). On comparing values of percentage reduction in RDS (ΔRDS) brought about by the four ingredients in each product at higher levels of substitution, oats and guar gum were found to be more effective in decelerating starch digestion and lowering RDS fraction in foods as compared to barley and gluten.
Guar gum and β-glucan present in oats and barley are soluble dietary fibres which absorb excess of water and form a gel-like network, thereby increasing the bulk and viscosity in the gastrointestinal tract. Consequently, the accessibility of starch for hydrolysis by digestive enzymes is restricted, and this in turn restricts the diffusion of digested sugars across the mucosal cells of small intestine. Thus, these ingredients are capable of slowing down the rate of carbohydrate digestion and gastric emptying.[Citation28] At a reduced rate of digestion, the proportion of RDS also decreases. Dartois et al.[Citation30] showed that incorporation of guar gum at 1% in waxy maize starch reduced the initial rate of starch hydrolysis by approximately 25%. The application of gluten as an additive for reducing RDS has been studied for the first time, although its mechanism of action is not known. In the case of dough, starch granules are dispersed in a three-dimensional gluten network.[Citation31] Gluten supplementation could possibly alter the gluten-starch interaction, decreasing the accessibility of starch for enzymatic digestion.
Effect of added ingredients on SDS content of idli, dosa, upma, and chapatti
SDS is the starch fraction digested between 20 and 120 min of enzymatic hydrolysis and is thus intermediate between the RDS and RS fractions. It has a negative correlation with RDS in terms of both structure and quantity. It can be considered as a low GI fraction of starch, which undergoes slow and complete digestion throughout the small intestine, providing for a prolonged and sustained release of glucose.[Citation28,Citation32] SDS can positively influence glucose metabolism and post-prandial insulin release,[Citation33] cognitive performance,[Citation34] and satiety.[Citation35] Analysis of SDS content of idli, dosa, upma, and chapatti with added ingredients was carried out to understand their effect on starch digestibility (). Incorporation of all these four ingredients did increase the SDS content in all the food products under study, the increase being directly proportional to the level of added ingredients thereby demonstrating their hypoglycaemic effect. This trend of elevated SDS levels complements the trend of decreasing RDS levels discussed earlier. Sharavathy et al.[Citation3] also reported an inverse relation between the content of RDS and SDS fractions in selected Indian traditional foods.
Figure 3. Effect of added ingredients on slowly digestible starch (SDS) of idli, dosa, upma, and chapatti; (a)- barley flour, (b)- oats flour, (c)- gluten, (d)- guar gum.
Ingredient %: g ingredient/100 g flour or premix; Mean values with different superscript letters (a–d) are significantly different (P ≤ 0.05); SDS (%): g/100 g product on dry weight basis, n = 3.
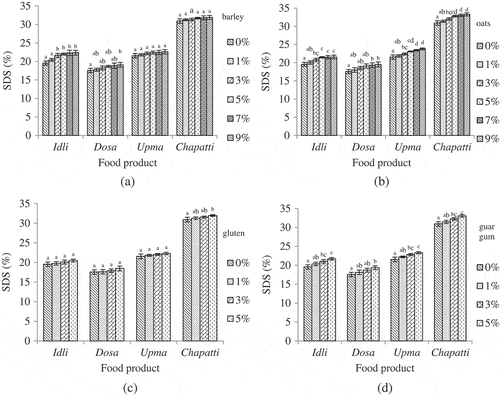
The SDS content of control samples without any added ingredient was found to be 19.79%, 17.56%, 21.55%, and 30.93% in idli, dosa, upma, and chapatti, respectively. Addition of barley at 9 g/100 g flour increased the SDS of idli, dosa, upma, and chapatti to 22.36%, 19.08%, 22.62%, and 31.90%, the corresponding percentage increase in SDS (ΔSDS) being 11.49%, 7.97%, 4.73%, and 3.04%, respectively (). Similarly, incorporation of oats at 9 g/100 g flour increased SDS to 21.56% (ΔSDS: 8.21%) in idli, 19.52% (ΔSDS: 10.04%) in dosa, 23.79% (ΔSDS: 9.42%) in upma, and 33.28% (ΔSDS:7.06%) in chapatti (). SDS contents of gluten (5 g/100 g flour) supplemented idli, dosa, upma, and chapatti were found to be 20.48% (ΔSDS: 4.70%), 18.48% (ΔSDS: 5.24%), 22.28% (ΔSDS: 3.39%), and 31.95% (ΔSDS: 3.30%), respectively (Fig. 3c). Addition of guar gum also resulted in elevated SDS levels (Fig. 3d); Idli and dosa had SDS contents of 21.71% (ΔSDS: 10.99%) and 19.35% (ΔSDS: 10.13%), respectively, while upma and chapatti had SDS contents of 23.30% (ΔSDS: 8.12%) and 33.05% (ΔSDS: 6.85%), respectively, at 5 g/100 g flour level of substitution with guar gum.
SDS is a good indicator of rate of starch digestion and glycaemic response, a higher proportion of SDS implying a slower digestion and glucose release. Oats and guar gum were more effective in elevating SDS levels as compared to barley and gluten at comparable levels of substitution. Dietary fibres such as guar gum are known to decrease the content of RDS and increase SDS in breakfast cereal foods.[Citation27] In another study, a similar finding was reported for oats granola containing high molecular weight β-glucan.[Citation36]
Effect of added ingredients on RS content of idli, dosa, upma, and chapatti
RS is that fraction of starch which remains undigested after 120 min of enzymatic hydrolysis. Since it escapes digestion in the small intestine, it travels to the large intestine where it is fermented by gut flora to produce short chain fatty acids with potential health benefits. RS is known to have hypoglycaemic and hypocholesterolemic effects, besides being a prebiotic; it can help in the prevention of colon cancer, reduction of gall bladder stone formation, and inhibition of fat accumulation.[Citation2,Citation37] Bhargava et al.[Citation38] showed the supplementation of whole wheat flour with a mixture of barley flour, banana flour, and soy protein isolate (at 40%) to increase the RS content of north Indian parotta.
–4d give the results of RS estimation carried out to understand the effect of addition of barley, oats, gluten, and guar gum on the content of RS fraction in idli, dosa, upma, and chapatti samples. A trend of increasing RS levels was observed in each of the food products when the four ingredients were added at increasing levels. This is in agreement with the observed decreasing trend of RDS and increasing trend of SDS in this study. The increase in contents of RS along with SDS compensates for the decrease in RDS.
Figure 4. Effect of added ingredients on resistant starch (RS) of idli, dosa, upma, and chapatti; (a)- barley flour, (b)- oats flour, (c)- gluten, (d)- guar gum.
Ingredient %: g ingredient/100 g flour or premix; Mean values with different superscript letters (a–f) are significantly different (P ≤ 0.05); RS (%): g/100 g product on dry weight basis, n = 3.
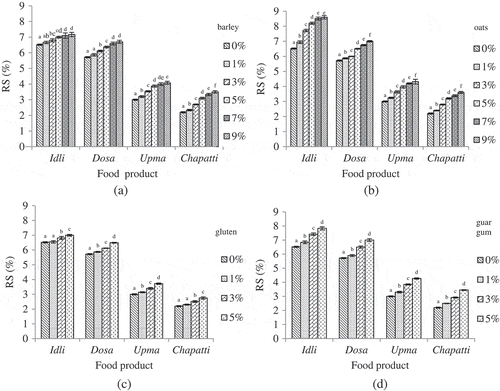
The control samples of idli, dosa, upma, and chapatti without any added ingredient were found to have 6.52%, 5.72%, 3.00%, and 2.20% of RS, respectively. Addition of barley at 9 g/100 g flour increased RS content to 7.17% (ΔRS: 9.07%) in idli, 6.70% (ΔRS: 14.63%) in dosa, 4.08% (ΔRS: 26.47%) in upma, and 3.5% (ΔRS: 37.14%) in chapatti (). The values of ΔRS on supplementation of the products with oats at 9 g/100 g flour were 24.19%, 18.29%, 30.56%, and 38.89%, respectively, for idli, dosa, upma, and chappati (). On similar lines, ΔRS of idli, dosa, upma, and chapatti were found to be 7.36%, 13.46%, 24.00%, and 25.00%, respectively, when gluten was added at 5 g/100 g flour (Fig. 4c). Guar gum incorporation at 5 g/100 g flour increased RS in idli and dosa to 7.83% (ΔRS: 20.09%) and 7.00% (ΔRS: 22.38%), respectively. It also elevated RS of upma and chapatti to 4.27% (ΔRS: 42.33%) and 3.45% (ΔRS: 56.82%), respectively.
Based on the results of RDS, SDS, and RS analysis, it can be inferred that all the ingredients can be useful in improving the nutritional quality of the traditional (starchy) foods selected in this study with respect to extent of starch digestion. Oats and guar gum were more effective as compared to the other ingredients. Gluten has been found to desirably modify starch digestibility, though gluten supplementation would be a concern for celiac individuals. The reduction in starch digestibility brought about by each ingredient at a particular level of substitution varied with the type of food product in which it was incorporated. These differences observed between the products could be due to variations in particle size, type of food matrix, and the method and time of preparation.
Effect of added ingredients on Glycaemic Index (GI)
GI of some Indian traditional foods has been analysed in human studies.[Citation39,Citation40] In this study, the effect of selected ingredients on in vitro GI of idli, dosa, chapatti, and upma was investigated. The results are illustrated in –5d. GI values of idli, dosa, upma, and chapatti were found to be 71.28, 68.37, 65.53, and 62.56, respectively. Incorporation of barley at 9 g/100 g flour reduced the GI of idli and dosa to 58.46 (ΔGI: 17.99%) and 60.00 (ΔGI: 12.24%); it reduced GI of upma and chapatti to 56.00 (ΔGI: 14.54%) and 52.72 (ΔGI: 15.73%), respectively (). Addition of oats at 9 g/100 g flour decreased the GI values of idli, dosa, upma, and chapatti to 55.12 (ΔGI: 22.67%), 56.21 (ΔGI: 17.79%), 55.42 (ΔGI: 15.43%), and 50.12 (ΔGI: 19.88%), respectively (). Gluten and guar gum also lowered GI of the food products as seen in Fig. 5c and d. Addition of gluten at 5 g/100 g flour reduced GI of idli, dosa, upma, and chapatti to 60.00 (ΔGI: 15.82%), 63.00 (ΔGI: 7.85%), 59.45 (ΔGI: 9.28%), and 55.46 (ΔGI: 11.35%). Guar gum supplementation at 5 g/100 g flour decreased GI of idli and dosa to 60.00 (ΔGI: 15.82%) and 56.23 (ΔGI: 17.76%); it lowered GI of upma and chapatti to 54.66 (ΔGI: 16.59%) and 51.25 (ΔGI: 18.08%), respectively.
Figure 5. Effect of added ingredients on glycaemic index (GI) of idli, dosa, upma, and chapatti; (a)- barley flour, (b)- oats flour, (c)- gluten, (d)- guar gum.
Ingredient %: g ingredient/100 g flour or premix; Mean values with different superscript letters (a–f) are significantly different (P ≤ 0.05); GI: on dry weight basis, n = 3.
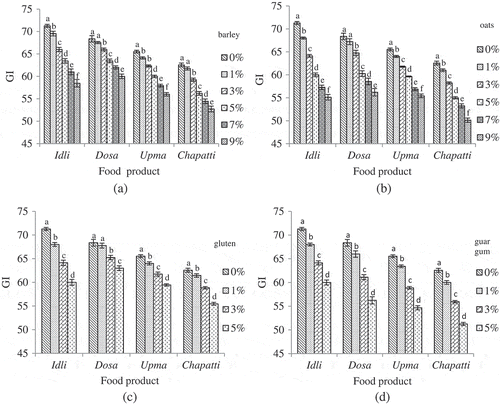
Idli, which was found to be a high GI food in this study, was modified to a medium GI food by incorporation of barley, oats, gluten, and guar gum at their highest level of substitution studied. Dosa remained a medium GI food although these ingredients significantly reduced its GI. Guar gum (5 g/100 g flour) modified the digestibility of upma (medium GI), making it a low GI food. Barley and oats (9 g/100 g flour) and guar gum (5 g/100 g flour) transformed chapatti (medium GI) into a low GI food.
As discussed earlier, the viscosity effect leading to retarded starch digestion caused by soluble fibres could be responsible for lowering the GI observed on addition of barley, oats, and guar gum. The hypoglycaemic effect of gluten has not been previously reported. Further studies need to be carried out to understand the exact mechanism responsible for the observed GI lowering effect. In a study by Kim and White,[Citation41] oat flours from different oat lines were found to retard in vitro starch digestibility and lower estimated GI values as compared to the control (wheat bread). In a study by Thondre and Henry,[Citation17] incorporation of high molecular weight barley β-glucan in chapatti at levels of 4 and 8 g per serving significantly lowered the GI of chapatti when tested on eight healthy human subjects. In another study, bread made from wheat flour supplemented with β-glucan enriched fractions from barley was given to eight adults. A linear decrease in GI was observed with increasing levels of β-glucan in bread.[Citation21] Shen et al.[Citation42] demonstrated a hypoglycaemic effect on feeding oats to streptozotocin-induced diabetic mice. The GI lowering potential of guar gum has also been reported.[Citation23,Citation43]
Correlation between GI and RDS, SDS, and RS
Studies have reported a good correlation between in vitro carbohydrate digestibility and GI in human subjects.[Citation44,Citation45] The positive correlation between in vitro and in vivo GI has also been established.[Citation5] In this study, the correlation between in vitro GI and each of the three starch fractions obtained by Englyst’s in vitro carbohydrate digestibility test was studied to elucidate the physiological relevance of these fractions as in vitro indicators of glycaemic response.
The correlation observed between in vitro GI and RDS, SDS, and RS fractions in the four food products incorporated with added ingredients is given in . The trends observed were similar for all the products; a strong positive correlation was observed between GI and RDS while a strong negative correlation was seen between GI and SDS and also between GI and RS. This is expected due to effect of the added ingredients on the proportions of RDS, SDS, and RS in the food products and its consequent effect on GI. The results of correlation studies are in agreement with previous observations. Pinhero et al.[Citation46] have reported similar results in a study where 14 varieties of potato were tested for estimated GI and content of RDS, SDS, and RS fractions. Estimated GI was positively correlated with RDS and negatively correlated with RS. Anderson et al.[Citation47] showed in vitro starch digestibility to be related to satiety and short-term food intake apart from glycaemic responses in human subjects. Thus, in vitro carbohydrate digestibility measured in terms of content of RDS, SDS, and RS could be used to predict glycaemic response and help in making choices of foods accordingly. Also, knowledge of starch digestibility profile of an ingredient/food as indicated by RDS, SDS, and RS can be useful in food product development.
Table 1. Correlation between RDS, SDS, RS, and GI in idli, dosa, upma, and chapatti incorporated with the four ingredients (barley, oats, gluten, and guar gum).
Sensory analysis
Sensory acceptability of idli, dosa, upma, and chapatti supplemented with barley, oats, gluten, and guar gum at varying levels was investigated. As seen in –, in each of the four products, the sensory scores for appearance, texture, mouthfeel and flavour along with overall acceptability decreased with increasing levels of substitution. However, even at the maximum level of substitution, which was 9 g/100 g flour for barley and oats, and 5 g/100 flour for gluten and guar gum, the sensory scores were 6 and above, indicating that the products were found to be acceptable (liked slightly-liked moderately) by the panelists.
Table 2. Sensory analysis of idli with added ingredients.
Table 3. Sensory analysis of dosa with added ingredients.
Table 4. Sensory analysis of upma with added ingredients.
Table 5. Sensory analysis of chapatti with added ingredients.
Conclusion
This study has demonstrated the potential hypoglycaemic effect of barley, oats, gluten, and guar gum when incorporated in Indian traditional products such as idli, dosa, upma, and chapatti. Supplementation with barley and oats at 9 g/100 g flour, and with gluten and guar gum at 5 g/100 g flour, significantly reduced the in vitro GI along with a concomitant decrease in RDS and increase in SDS and RS. The nature of food matrix, particle size, and method of cooking may have influenced the GI lowering effect of these ingredients since they reduced the GI to different extents in the four food products in spite of being added at the same level. The fractions of in vitro starch digestion strongly correlated with GI and can be good predictors of in vitro glycaemic response. The supplemented products were organoleptically acceptable. Development of such popular traditional products with lower GI value could be beneficial for consumers with glucose intolerance and hyperglycaemia.
LJFP_A_1295387_Supplementary.docx
Download MS Word (89.9 KB)Funding
The authors would like to thank University Grants Commission (UGC), India for funding the project.
Supplemental data
Supplemental data for this article can be accessed on the publisher’s website.
Additional information
Funding
Related Research Data
References
- Englyst, H.N.; Kingman, S.M.; Cummings, J.H. Classification and Measurement of Nutritionally Important Starch Fractions. European Journal of Clinical Nutrition 1992, 46, 33–50.
- Sajilata, M.G.; Singhal, R.S.; Kulkarni, P.R. Resistant Starch–A Review. Comprehensive Reviews in Food Science and Food Safety 2006, 5, 1–17.
- Sharavathy, M.K.; Urooj, A.; Puttaraj, S. Nutritionally Important Starch Fractions in Cereal Based Indian Food Preparations. Food Chemistry 2001, 75, 241–247.
- Jenkins, D.J.; Wolever, T.M.; Taylor, R.H.; Barker, H.; Fielden, H.; Baldwin, J.M.; et al. Glycemic Index of Foods: A Physiological Basis for Carbohydrate Exchange. The American Journal of Clinical Nutrition 1981, 34, 362–366.
- Goñi, I.; Garcia-Alonso, A.; Saura-Calixto, F. A Starch Hydrolysis Procedure to Estimate Glycemic Index Nutrition Research 1997, 17, 427–437.
- Brand, J.C.; Colagiuri, S.; Crossman, S.; Allen, A.; Roberts, D.C.; Truswell, A.S. Low-Glycemic Index Foods Improve Long-Term Glycemic Control in NIDDM Diabetes Care 1991, 14, 95–101.
- Liljeberg, H.; Björck, I. Effects of a Low-Glycemic Index Spaghetti Meal on Glucose Tolerance and Lipaemia at a Subsequent Meal in Healthy Subjects. European Journal of Clinical Nutrition 2000, 54, 24–28.
- Thorne, M.J.; Thompson, L.U.; Jenkins, D.J. Factors Affecting Starch Digestibility and the Glycemic Response with Special Reference to Legumes. The American Journal of Clinical Nutrition 1983, 38, 481–488.
- Brand-Miller, J.; Hayne, S.; Petocz, P.; Colagiuri, S. Low–Glycemic Index Diets in the Management of Diabetes: A Meta-Analysis of Randomized Controlled Trials. Diabetes Care 2003, 26, 2261–2267.
- Wolever, T.M.; Jenkins, D.J.; Vuksan, V.; Jenkins, A.L.; Wong, G.S.; Josse, R.G. Beneficial Effect of Low-Glycemic Index Diet in Overweight NIDDM Subjects. Diabetes Care 1992, 15, 562–564.
- Brand-Miller, J.C.; Holt, S.H.; Pawlak, D.B.; McMillan, J. Glycemic Index and Obesity. The American Journal of Clinical Nutrition 2002, 76, 281S–285S.
- Brand-Miller, J.; Dickinson, S.; Barclay, A.; Celermajer, D. The Glycemic Index and Cardiovascular Disease Risk. Current Atherosclerosis Reports 2007, 9, 479–485.
- Jenkins, D.J.; Wolever, T.M.; Kalmusky, J.; Giudici, S.; Giordano, C.; Wong, G.S.; Bird, J.N.; Patten, R.; Hall, M.; Buckley, G. Low Glycemic Index Carbohydrate Foods in the Management of Hyperlipidemia. The American Journal of Clinical Nutrition 1985, 42, 604–617.
- Ford, E.S.; Liu, S. Glycemic Index and Serum High-Density Lipoprotein Cholesterol Concentration among US Adults. Archives of Internal Medicine 2001, 161, 572–576.
- Sloth, B.; Mikkelsen, I.K.; Flint, A.; Tetens, I.; Björck, I.; Vinoy, S.; et al. No Difference in Body Weight Decrease between a Low-Glycemic-Index and a High-Glycemic-Index Diet but Reduced LDL Cholesterol after 10-Wk Ad Libitum Intake of the Low-Glycemic-Index Diet. The American Journal of Clinical Nutrition 2004, 80, 337–347.
- Ramachandran, A.; Snehalatha, C.; Kapur, A.; Vijay, V.; Mohan, V.; Das, A.K.; et al. High Prevalence of Diabetes and Impaired Glucose Tolerance in India: National Urban Diabetes Survey. Diabetologia 2001, 44, 1094–1101.
- Thondre, P.S.; Henry, C.J.K. High-Molecular-Weight Barley Β-Glucan in Chapatis (Unleavened Indian Flatbread) Lowers Glycemic Index Nutrition Research 2009, 29, 480–486.
- Waghmare, A.G.; Arya, S.S. Use of Fruit By‐Products in the Preparation of Hypoglycemic Thepla: Indian Unleavened Vegetable Flat Bread. Journal of Food Processing and Preservation 2014, 38, 1198–1206.
- Soni, S.K.; Sandhu, D.K.; Vilkhu, K.S. Studies on Dosa—An Indigenous Indian Fermented Food: Some Biochemical Changes Accompanying Fermentation. Food Microbiology 1985, 2, 175–181.
- Mukherjee, S.K.; Albury, M.N.; Pederson, C.S.; Van Veen, A.G.; Steinkraus, K.H. Role of Leuconostoc mesenteroides in Leavening the Batter of Idli, a Fermented Food of India. Journal of Applied Microbiology 1965, 13, 227–231.
- Cavallero, A.; Empilli, S.; Brighenti, F.; Stanca, A.M. High (1→ 3, 1→ 4)-Β-Glucan Barley Fractions in Bread Making and Their Effects on Human Glycemic Response. Journal of Cereal Science 2002, 36, 59–66.
- Östman, E.; Rossi, E.; Larsson, H.; Brighenti, F.; Björck, I. Glucose and Insulin Responses in Healthy Men to Barley Bread with Different Levels of (1→ 3; 1→ 4)-Β-Glucans; Predictions Using Fluidity Measurements of in Vitro Enzyme Digests. Journal of Cereal Science 2006, 43, 230–235.
- Wood, P.J.; Braaten, J.T.; Scott, F.W.; Riedel, D.; Poste, L.M. Comparisons of Viscous Properties of Oat and Guar Gum and the Effects of These and Oat Bran on Glycemic Index. Journal of Agricultural and Food Chemistry 1990, 38, 753–757.
- Ghodke, S.K.; Laxmi, A. Influence of Additives on Rheological Characteristics of Whole-Wheat Dough and Quality of Chapatti (Indian Unleavened Flat Bread) Part I—Hydrocolloids. Food Hydrocolloids 2007, 21, 110–117.
- Holm, J.; Bjorck, I.; Drews, A.; Asp, N.G. A Rapid Method for the Analysis of Starch. Starch‐Stärke 1986, 38, 224–226.
- Holm, J.; Lundquist, I.; Bjorck, I.; Eliasson, A.C.; Asp, N.G. Degree of Starch Gelatinization, Digestion Rate of Starch in Vitro, and Metabolic Response in Rats. The American Journal of Clinical Nutrition 1988, 47, 1010–1016.
- Brennan, M.A.; Monro, J.A.; Brennan, C.S. Effect of Inclusion of Soluble and Insoluble Fibers into Extruded Breakfast Cereal Products Made with Reverse Screw Configuration. International Journal of Food Science and Technology 2008, 43, 2278–2288.
- Zhang, G.; Hamaker, B.R. Slowly Digestible Starch: Concept, Mechanism, and Proposed Extended Glycemic Index. Critical Reviews in Food Science and Nutrition 2009, 49, 852–867.
- Ludwig, D.S.;. The Glycemic Index: Physiological Mechanisms Relating to Obesity, Diabetes, and Cardiovascular Disease. Jama 2002, 287, 2414–2423.
- Dartois, A.; Singh, J.; Kaur, L.; Singh, H. Influence of Guar Gum on the in Vitro Starch Digestibility—Rheological and Microstructural Characteristics. Food Biophysics 2010, 5, 149–160.
- Song, Y.; Zheng, Q. Dynamic Rheological Properties of Wheat Flour Dough and Proteins. Trends in Food Science and Technology 2007, 18, 132–138.
- Lehmann, U.; Robin, F. Slowly Digestible Starch–Its Structure and Health Implications: A Review. Trends in Food Science and Technology 2007, 18, 346–355.
- Harbis, A.; Perdreau, S.; Vincent-Baudry, S.; Charbonnier, M.; Bernard, M.C.; Raccah, D.; et al. Glycemic and Insulinemic Meal Responses Modulate Postprandial Hepatic and Intestinal Lipoprotein Accumulation in Obese, Insulin-Resistant Subjects. The American Journal of Clinical Nutrition 2004, 80, 896–902.
- Benton, D.; Ruffin, M.P.; Lassel, T.; Nabb, S.; Messaoudi, M.; Vinoy, S.; et al. The Delivery Rate of Dietary Carbohydrates Affects Cognitive Performance in Both Rats and Humans. Psychopharmacology 2003, 166, 86–90.
- Sparti, A.; Milon, H.; Vetta, D.; Schneiter, P.; Tappy, L.; Jéquier, E.; et al. Effect of Diets High or Low in Unavailable and Slowly Digestible Carbohydrates on the Pattern of 24-H Substrate Oxidation and Feelings of Hunger in Humans. The American Journal of Clinical Nutrition 2000, 72, 1461–1468.
- Regand, A.; Chowdhury, Z.; Tosh, S.M.; Wolever, T.M.; Wood, P. The Molecular Weight, Solubility and Viscosity of Oat Beta-Glucan Affect Human Glycemic Response by Modifying Starch Digestibility. Food Chemistry 2011, 129, 297–304.
- Fuentes-Zaragoza, E.; Riquelme-Navarrete, M.J.; Sánchez-Zapata, E.; Pérez-Álvarez, J.A. Resistant Starch as Functional Ingredient: A Review. Food Research International 2010, 43, 931–942.
- Bhargava, S.; Jyothi Lakshmi, A.; Dasappa, I. Effect of Barley, Banana and Soya Protein Isolate on Rheological, Microstructural and Nutritional Characteristics of North Indian Parotta. Journal of Texture Studies 2012, 43, 246–256.
- Urooj, A.; Puttaraj, S. Glycemic Responses to Cereal-Based Indian Food Preparations in Patients with Non-Insulin-Dependent Diabetes Mellitus and Normal Subjects. British Journal of Nutrition 2000, 83, 483–488.
- Mani, U.V.; Pradhan, S.N.; Mehta, N.C.; Thakur, D.M.; Iyer, U.; Mani, I. Glycemic Index of Conventional Carbohydrate Meals. British Journal of Nutrition 1992, 68, 445–450.
- Kim, H.J.; White, P.J. In Vitro Digestion Rate and Estimated Glycemic Index of Oat Flours from Typical and High Β-Glucan Oat Lines. Journal of Agricultural and Food Chemistry 2012, 60, 5237–5242.
- Shen, R.L.; Cai, F.L.; Dong, J.L.; Hu, X.Z. Hypoglycemic Effects and Biochemical Mechanisms of Oat Products on Streptozotocin-Induced Diabetic Mice. Journal of Agricultural and Food Chemistry 2011, 59, 8895–8900.
- Leclere, C.J.; Champ, M.; Boillot, J.; Guille, G.; Lecannu, G.C.; Molis, F.; Bornet, M.; Krempf, J.; Laval, D.; Galmiche, J.P. Role of Viscous Guar Gums in Lowering the Glycemic Response after a Solid Meal. The American Journal of Clinical Nutrition 1994, 59, 914–921.
- Englyst, K.N.; Englyst, H.N.; Hudson, G.J.; Cole, T.J.; Cummings, J.H. Rapidly Available Glucose in Foods: An in Vitro Measurement that Reflects the Glycemic Response. The American Journal of Clinical Nutrition 1999, 69, 448–454.
- Englyst, K.N.; Vinoy, S.; Englyst, H.N.; Lang, V. Glycemic Index of Cereal Products Explained by Their Content of Rapidly and Slowly Available Glucose. British Journal of Nutrition 2003, 89, 329–339.
- Pinhero, R.G.; Waduge, R.N.; Liu, Q.; Sullivan, J.A.; Tsao, R.; Bizimungu, B.; Yada, R.Y.; Pinhero, R.G.; et al. Evaluation of Nutritional Profiles of Starch and Dry Matter from Early Potato Varieties and Its Estimated Glycemic Impact. Food Chemistry 2016, 203, 356–366.
- Anderson, G.H.; Cho, C.E.; Akhavan, T.; Mollard, R.C.; Luhovyy, B.L.; Finocchiaro, E.T. Relation between Estimates of Cornstarch Digestibility by the Englyst in Vitro Method and Glycemic Response, Subjective Appetite, and Short-Term Food Intake in Young Men. The American Journal of Clinical Nutrition 2010, 91, 932–939.