
ABSTRACT
Ultraviolet-visible (UV-Vis) spectral information (190–400 nm) was used to classify coffee samples into either pure peaberry or pure normal coffee classes using two chemometric methods: soft independent modelling of class analogy (SIMCA) and partial least squares discriminant analysis (PLS-DA). The spectral data of peaberry and normal coffee were acquired using a UV-Vis spectrometer (Genesys™ 10S UV-Vis, Thermo Scientific, USA). For both supervised discrimination methods, SIMCA and PLS-DA, all samples were correctly classified into their corresponding classes. The SIMCA model classified all samples accurately (100%) into either the peaberry or normal coffee class, even at a 5% confidence level; however, the PLS-DA model also correctly classified all samples (100%). Investigation of the major wavelengths contributing to the classifications using x-loading weights and loading of latent variables (LVs) indicated wavelengths at 230, 250, 270, 310, and 350 nm were important for determination of the coffee types. These wavelengths were closely related to the absorbance wavelengths of several important chemical components in roasted coffee: caffeine, caffeic acid, and chlorogenic acids (CGA). These results provided the basis for developing a simple and reliable method for peaberry coffee authentication (including more complex samples where peaberry coffee is blended with normal coffees) based on UV-Vis spectra.
Introduction
Coffee is one of the most popular beverages in the world,[Citation1] particularly in developed countries: with 4 and 5 kg consumed per capita in the US and Europe, respectively. On the other hand, the coffee beans are primarily grown in developing countries, with four such countries accounting for more than half of the world’s production: Brazil, Vietnam, Colombia, and Indonesia.[Citation2]
In Indonesia, Sumatra Island dominates coffee cultivation, capturing 74.2% of the national production, with the largest production areas being Bengkulu, Lampung, and South Sumatra. Amongst the coffee types produced, there are several specialty coffees, which have a particularly high economic value, including civet coffee (‘kopi luwak’ in Indonesian language) and peaberry coffee (‘kopi lanang’ in Indonesian language). A peaberry (also called caracol or snail in Spanish) is a natural mutation of the coffee bean inside the cherry. Normally two coffee beans grow in a fruit (dicotyledonous)—flat against each other like halves of a peanut; however, on rare occasions a single bean is produced (monocotyledon). The production of peaberry coffee is very limited, with only about 7% of any given coffee crop containing peaberry beans. The higher price for peaberry beans arises from its supposed more concentrated flavour compared with normal beans.
Recently, food authentication is becoming increasingly important due to the need to guarantee origin of the product and to assure no adulteration with contaminants or cheaper fillers has occurred.[Citation3] As a profitable trading product with the potential for adulteration and fraudulent trading, peaberry coffee is in need of such authentication procedures. At the coffee bean stage, even after roasting, peaberry (round in shape) and normal coffee beans (flat in shape) are easy to visually distinguish. However after grinding, discrimination of ground coffee made from peaberry or normal coffee cannot be visually done, nor can adulteration of the ground coffee be easily detected. Thus, in order to provide authentication of peaberry coffee and protect consumers from adulteration, a robust and easy method for identifying ground peaberry coffee and detection of its adulteration is needed.
Several methods have been used for the detection and quantification of coffee adulteration, as detailed in a recent study.[Citation4] Moreover, the feasibility of using spectroscopic methods (near-infrared and mid-infrared spectroscopy) for coffee classification and authentication has been investigated in previous studies as well.[Citation5–Citation7] Recently, ultraviolet-visible (UV-Vis) spectroscopy has been applied to the detection and quantification of normal coffee adulteration with coffee husks.[Citation8,Citation9] This method has also been used for discrimination between normal civet coffee and normal non-civet coffee.[Citation10,Citation11] The advantages of this technique include it is inexpensive and is a routinely used analytical technique, characteristics that lend itself to application in Indonesia. However, to date there has been no report on the use of this method for discrimination between pure ground peaberry and normal coffee. Therefore, in this research, we investigate the use of UV-Vis spectra combined with chemometrics methods (soft independent modelling of class analogy, SIMCA; and partial least squares discriminant analysis, PLS-DA) to discriminate between ground peaberry and normal coffee samples.
Material and method
Sample preparation
A 1 kg sample of roasted peaberry coffee beans (robusta variety: Coffea canephora) was collected directly from a coffee farmer at Liwa, Lampung, Indonesia (Hasti coffee Lampung), while another 1 kg sample of roasted normal coffee beans (robusta variety) was also collected for making a normal (non-peaberry) ground coffee sample. All coffee beans were harvested manually from the same plantation and manually separated into peaberry and normal coffee beans. These coffee samples were then separately ground using a home-coffee grinder (Sayota). Since particle size in coffee powder has a significant influence on the spectra obtained,[Citation12] we sieved both coffee sample types through a nest of U.S. standard sieves (mesh number 40) on a Meinzer II sieve shaker (CSC Scientific Company, Inc. USA) for 10 min to obtain a particle size of 420 µm. The experimental measurements were performed at room temperature (around 27–29°C). In this research we prepared 50 samples each of ground peaberry and normal coffee.
For developing and evaluating the calibration model, the samples were divided into two groups: a calibration and a prediction sample set. The calibration sample set had 68 samples (34 samples each of peaberry and normal coffee) that were used for developing the calibration model with full cross-validation. The prediction sample set had 32 samples (16 samples each of peaberry and normal coffee) that were used for evaluating the performance of the developed calibration model.
A standard aqueous extract of the coffee samples was then obtained.[Citation8,Citation9] First, 1.0 g of each sample was weighed and placed in a glass beaker. Then 10 mL of distilled water at 90–98°C was added and mixed with a magnetic stirrer (Cimarec™ Stirrers, model S130810-33, Barnstead International, USA) at 350 rpm for 5 min. Then the samples were filtered using a 25-mm pore-sized quantitative filter paper coupled with an Erlenmeyer flask. After cooling to room temperature (for 20 min), all extracts were then diluted in a 1:20 (mL: mL) proportion with distilled water.
Spectral data acquisition using a UV-Vis spectrometer
Spectral data of these diluted peaberry and normal coffee extracts were acquired using a UV-Vis spectrometer (Genesys™ 10S UV-Vis, Thermo Scientific, USA) in the range of 190–700 nm. This spectrometer is a dual-beam spectrometer equipped with a five-cell sample holder and one cell for a blank or reference. The wavelength accuracy is 1 nm, with dual silicon photodiodes as the detector and a Xenon flash as the illumination source.
The absorbance data of peaberry and normal coffee extracts were collected at room temperature. For this, we put 3 mL of extract into the cuvettes with a 10 mm path length. Before measuring the samples, a blank (the same distilled water used in the extraction process) was placed inside the reference cell holder. In this research, relative absorbance spectra were calculated as follows:
where is the intensity of the sample at wavelength λ and
is the intensity of the reference at the same wavelength. The “relative absorbance spectra”, hereafter referred to as “spectra”, were transferred to a computer for further multivariate analysis. Spectral preprocessing (principal component analysis (PCA), PLS-DA, or SIMCA) was carried out using Unscrambler 9.7 (CAMO Software AS, Norway).
Analysis data using the SIMCA method
SIMCA is a method of supervised data classification based on a PCA methodology. The theory of SIMCA has been extensively discussed and can be found elsewhere.[Citation13–Citation15] First, a PCA model was created for each class using the calibration data set for each corresponding class. In SIMCA modelling, the number of PCAs is equal to the number of classes of samples, because each class needs to create its own PCA model for making the SIMCA model for each class. For this, we developed a SIMCA model for both the peaberry and normal coffee samples. A critical point in developing the SIMCA model is to determine the optimal number of principal components (PCs) involved in the model. Here, we used a full cross-validation method and calculated the root mean square error of cross-validation (RMSECV). The lowest RMSECV value corresponds to the optimal number of PCs. The performance of the SIMCA model was then evaluated using the prediction sample set. Samples in the prediction set are projected into each SIMCA model and their residual distance calculated. Residual standard deviation was used as a measure of the critical distance for classification. If the residual distance from the model was below their statistical limit, the sample was defined to that class and if the residual variance was higher, then the sample did not belong to that class.
Analysis data using PLS-DA
PLS-DA is based on a PLS regression algorithm (in this study we used a PLS1 algorithm with only one dependent Y variable),[Citation16] which searches for latent variables (LVs) with a maximum covariance with the Y-variables. PLS-DA attempts to build models that can maximize the separation among the classes of objects. Detailed explanations about the PLS-DA algorithm can be found in the literature.[Citation17–Citation20] In our PLS-DA, each sample in the calibration set was assigned a dummy variable as a reference value (variable y), which is an arbitrary number designating whether the sample belongs to a particular class or not[Citation21] (1 = peaberry coffee; 0 = normal coffee). The PLS-DA calibration model was developed using the calibration sample set and the optimal number of LVs was determined using the RMSECV value. The lowest RMSECV value corresponds to the optimal number of LVs. The performance of the PLS-DA model was evaluated using the prediction sample set using ±0.5 as a threshold value to delimit the classes. A sample was considered to be correctly classified if the predicted value lay on the same side of the midpoint of the assigned value of 0.5, a cut-off criterion that is often used.[Citation22–Citation25] A coffee sample was classified as peaberry coffee if its value was above 0.5 and classified as normal coffee if the value was below 0.5.
Results and discussion
Spectral data analysis of peaberry and normal coffee samples
shows the spectral data of peaberry and normal coffee samples in the range of 190–700 nm (ultraviolet and visible region). It can be seen that the spectra of both coffees have a similar shape but not the same absorbance intensity. The spectra of normal coffee have higher absorbance intensity, especially in the ultraviolet region (after 390 nm). In the visible region, both spectra have almost same absorbance intensity and overlapped each other. However, beyond 290 nm the peaberry and normal coffee spectra often overlap and it is not easy to discriminate between the two. This spectral data (190–400 nm) will be used for further analysis.
Figure 1. Original spectra of peaberry and normal coffee samples in ultraviolet-visible region (190–700 nm).
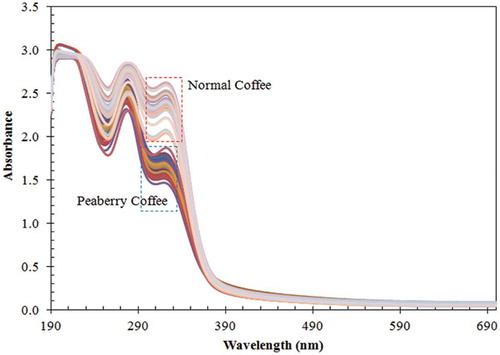
In the range 190–400 nm, several peaks and troughs can be observed, including peaks at 281 and 320 nm. The troughs are at 256 and 310 nm. These peaks and troughs are closely related to the absorbance of several important chemical components in roasting coffee. For example, the peak at 281 nm is closely related to the absorbance of caffeine, while those at 310 nm and 320 nm are related to the absorbance of caffeic acid.[Citation8] The trough at 256 nm is closely related to the absorbance of vanillic acid.
Principal components analysis
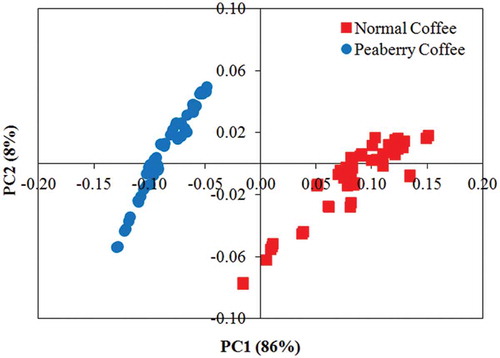
First, a PCA was performed on the whole dataset (100 samples) using original, as well as preprocessed spectral data in the range 190–400 nm. Preprocessing of the spectra using the Savitzky–Golay 1st derivative algorithm resulted in a very clear separation between peaberry and normal coffee samples. shows the PCA scores along the first two PCs, which represent the quasi-totality of the total variance (94%). shows that a clear class separation was attained, where two distinct clusters were observed separated by the PC1 axis. Peaberry coffee samples are clearly clustered on the left while normal coffee samples appeared on the right of the PC1 axis.
Figure 2. Principal components analysis of spectra from the peaberry and normal coffee samples (projection onto the first two principal components).
Classification result using the SIMCA method
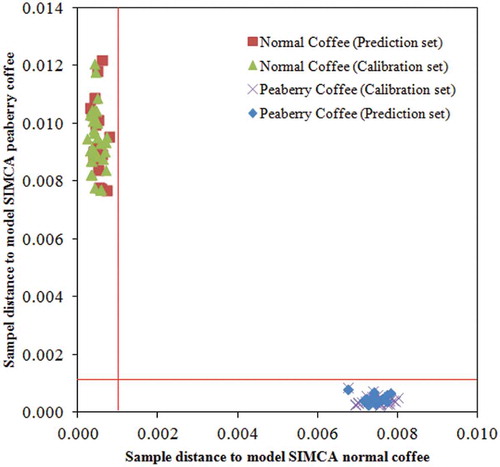
SIMCA classification for discrimination between peaberry and normal coffee samples was developed by generating the individual PCA models for each class of coffee samples (peaberry and normal) using the calibration sample set (34 samples for each class). The SIMCA model of peaberry and normal coffee was then used to predict the type of coffee samples in the prediction sample set (16 samples from each class). The prediction results showed that the SIMCA model accurately classified (100%) all of the samples, either as the peaberry or normal coffee, down to a significance level of 5% level, as shown in . From the figure, it can be seen that all samples were separated and closely clustered to the class that they should belong to. As can be seen, no samples were located in the lower left quadrant, which would indicate that they belonged to both classes simultaneously. There were also no samples in the upper right quadrant, which indicates a sample that does not belong to either of the defined models. The upper left and lower right quadrants define samples that belong to a particular class.
Figure 3. Cooman plot for the classification of peaberry and normal coffee samples (vertical and horizontal red lines show 95% confidence interval).
To calculate the performance of the classification, a confusion matrix was created, with the accuracy, sensitivity, and specificity of the coffee sample classifications using the developed SIMCA models (). It can be seen that prediction results (using 16 samples for each class) were satisfactory (100%) for the accuracy, sensitivity, and specificity rates.
Table 1. Confusion matrix with accuracy, sensitivity, and specificity of the classification of coffee samples by SIMCA using the prediction sample set.
Classification result using the PLS-DA method
A supervised discriminant method, PLS-DA, was carried out to develop a calibration model between spectral data (as predictor variables) and the type of coffee (as target variables). This PLS-DA model was used to predict the type of coffee in the prediction sample set and the results are depicted in . It can be clearly seen that both peaberry and normal coffee samples were limited to their own class. For example, all peaberry samples (with the o mark) had a value above 0.5 and below 1.5 and therefore all peaberry samples correctly classified to be 1: peaberry coffee. All normal coffee samples (with the x mark) had a value above −0.5 and below 0.5 and therefore all normal coffee samples were correctly classified to be 0: normal coffee. From this we can see that the prediction results using the PLS-DA model were satisfactory with a 100% correct classification rate for peaberry and normal coffee samples.
Figure 4. Estimated class values by the PLS-DA model versus the calibration and prediction sample plots for discrimination between peaberry and normal coffees.
Investigation on sensitive wavelengths
Both the SIMCA and PLS-DA models involved the use of a number of predictor variables (210 wavelength variables in the range from 190 to 400 nm). It was important to identify the major wavelengths that drive these models. For this we plotted the x-loading results (from SIMCA) and loading of LVs (from PLS-DA). The x-loadings indicate how well the x-variable (wavelength) is taken into account by the model components. It can be used to understand how much each of the x-variables (wavelengths) contributed to meaningful variation in the data, and to interpret variable relationships. It is also useful for interpreting the meaning of each model component. The loading weights indicate how much each wavelength (x-variable) contributes to explaining the response variation (type of coffee) along each model component. The loading weights were normalized, so that their length could be interpreted, as well as their direction. Wavelengths (x-variables) with large loading weight values are important for the determination of the type of coffee (peaberry or normal coffee). With a similar function, loading of LVs is primarily used to check the influence of wavelength (x-variable) on determining the type of coffee (y-variable). A large absolute value indicates a significant influence of wavelength.
From several wavelengths can be identified with a high x-loading weight, including wavelengths at 230, 270, and 350 nm. In several wavelengths with high loading of LVs at 230, 250, 270, 310, and 350 nm can be observed. Those wavelengths are considered to be important for the differentiation between the classes. These wavelengths are closely related to the absorbance of several important chemical components in roasted coffee. For example, the wavelength at 270 nm is related to the absorbance of caffeine, while those at 310 and 350 nm are closely related to the absorbance of caffeic acid and CGA, respectively.[Citation8,Citation26]
Figure 5. X-Loading weights versus wavelength of the top two PCs (PC1 and PC2) of coffee samples (upper: peaberry coffee; lower: normal coffee).
Figure 6. Plots of loadings of latent variables versus wavelength for the PLS-DA model.
Conclusion
This research demonstrates the potential of UV-Vis spectral information to be used for robust and simple discrimination of ground pure peaberry and ground normal coffee samples. The two supervised discrimination methods investigated, SIMCA and PLS-DA, provided satisfactory classification rates, with all samples being correctly classified into their corresponding classes. Subsequent investigation of the particularly sensitive wavelengths using x-loading weights and loading of LVs showed that absorbance intensities at 230, 250, 270, 310, and 350 nm are important for discriminating between the types of coffee examined in this study. Those wavelengths are closely related to the absorbance wavelength of several important chemical components in the roasted coffee, such as caffeine, caffeic acid, and CGA.
Acknowledgements
We would like to thank Department of Agricultural Engineering, The University of Lampung for allowing the use of the UV-visible spectrometer and its supporting devices. We also would like to thank Hasti Coffee Lampung for providing the coffee samples. We also acknowledge Professor Garry John Piller (Graduate School of Agriculture, Kyoto University, Japan) for his help and useful discussions during the preparation of the manuscript.
Related Research Data
References
- Duarte, S.M.D.S.; Abreu, C.M.P.D.; Menezes, H.C.D.; Santos, M.H.D.; Gouvea, C.M.C.P. Effect of Processing and Roasting on the Antioxidant Activity of Coffee Brews. Food Science. Technology. (Campinas) 2005, 25, 387–393.
- ICO. http://www.ico.org/trade_statistics.asp?section=Statistics ( accessed Sep 16, 2016).
- Danezis, G.P.; Tsagkaris, A.P.; Camin, F.; Brusic, V.; Georgiou, C.A. Food Authentication: Techniques, Trends & Emerging Approaches. Trac Trends in Analytical Chemistry 2016, 85, 123–132.
- Toci, A.T.; Farah, A.; Pezza, H.R.; Pezza, L. Coffee Adulteration: More than Two Decades of Research. Critical Reviews in Analytical Chemistry 2016, 46, 83–92.
- Santos, J.R.; Sarraguça, M.C.; Rangel, A.O.S.S.; Lopes, J.A. Evaluation of Green Coffee Beans Quality Using near Infrared Spectroscopy: A Quantitative Approach. Food Chemistry 2012, 135, 1828–1835.
- Ebrahimi-Najafabadi, H.; Leardi, R.; Oliveri, P.; Casolino, M.C.; Jalali-Heravi, M.; Lanteri, S. Detection of Addition of Barley to Coffee Using near Infrared Spectroscopy and Chemometric Techniques. Talanta 2012, 99, 175–179.
- Wang, J.; Jun, S.; Bittenbender, H.C.; Gautz, L.; Li, Q.X. Fourier Transform Infrared Spectroscopy for Kona Coffee Authentication. Journal of Food Science 2009, 74, C385–C391.
- Souto, U.T.C.P.; Barbosa, M.F.; Dantas, H.V.; Pontes, A.S.; Lyra, W.S.; Diniz, P.H.G.D.; Araújo, M.C.U.; Silva, E.C. Identification of Adulteration in Ground Roasted Coffees Using UV–vis Spectroscopy and SPA-LDA. LWT: Food Science and Technology 2015, 63, 1037–1041.
- Souto, U.T.C.P.; Pontes, M.J.C.; Silva, E.C.; Galvão, R.K.H.; Araújo, M.C.U.; Sanches, F.A.C.; Cunha, F.A.S.; Oliveira, M.S.R. UV–vis Spectrometric Classification of Coffees by SPA–LDA. Food Chemistry 2010, 119, 368–371.
- Suhandy, D.; Yulia, M.; Waluyo, S.; Sugianti, C.; Iriani, R.; Handayani, F.N.; Apratiwi, N. In The Potential Use of Ultraviolet-Visible Spectroscopy and Soft Independent Modelling of Class Analogies (SIMCA) for Classification of Indonesian Palm Civet Coffee (Kopi Luwak), Proceedings of USR International Seminar on Food Security, 2016a, 245–253.
- Yulia, M.; Suhandy, D.; Waluyo, S.; Sugianti, C. Detection and Quantification of Adulteration in Luwak Coffee through Ultraviolet-visible Spectroscopy Combined with Chemometrics Method,” in Proceedings of USR International. Seminar on Food Security. 2016, 254–261.
- Suhandy, D.; Waluyo, S.; Sugianti, C.; Yulia, M.; Iriani, R.; Handayani, F.N.; Apratiwi, N. In The Use of UV-Vis-NIR Spectroscopy and Chemometrics for Identification of Adulteration in Ground Roasted Arabica Coffees -Investigation on the Influence of Particle Size on Spectral Analysis, Proceedings of Seminar Nasional Tempe, 2016b, 198–204.
- Derde, M.P.; Massart, D.L. Comparison of the Performance of the Class Modelling Techniques UNEQ and PRIMA. Chemometrics and Intelligent Laboratory Systems 1988, 4, 65–93.
- Candolfi, A.; De Maesschalck, R.; Massart, D.L.; Hailey, P.A.; Harrington, A.C.E. Identification of Pharmaceutical Excipients Using NIR Spectroscopy and SIMCA. Journal of Pharmaceutical and Biomedical Analysis 1999, 19, 923–935.
- Mertens, B.; Thompson, M.; Fearn, T. Principal Component Outlier Detection and SIMCA: A Synthesis. Analyst 1994, 119, 2777–2784.
- Sun, J.; Jiang, S.; Mao, H.; Wu, X.; Li, Q. Classification of Black Beans Using Visible and near Infrared Hyperspectral Imaging. International Journal of Food Properties 2016, 19, 1687–1695.
- Wold, S.; Sjostrom, M.; Eriksson, L. PLS-Regression: A Basic Tool of Chemometrics. Chemometrics and Intelligent Laboratory Systems 2001, 58, 109–130.
- Barker, M.; Rayens, W.S. Partial Least Squares for Discrimination. Journal of Chemometrics 2003, 17, 166–173.
- Xie, L.; Ying, Y.; Ying, T. Combination and Comparison of Chemometrics Methods for Identification of Transgenic Tomatoes Using Visible and Near-infrared Diffuse Transmittance Technique. Journal of Food Engineering 2007, 82, 395–401.
- Ballabio, D.; Consonni, V. Classification Tools in Chemistry. Part 1: Linear Models. PLS-DA. Analytical Methods 2013, 5, 3790–3798.
- Wu, X.; Wu, B.; Sun, J.; Li, M.; Du, H. Discrimination of Apples Using near Infrared Spectroscopy and Sorting Discriminant Analysis. International Journal of Food Properties 2016, 19, 1016–1028.
- Shen, F.; Ying, Y.; Li, B.; Zheng, Y.; Liu, Q. Discrimination of Blended Chinese Rice Wine Ages Based on Near-infrared Spectroscopy. International Journal of Food Properties 2012, 15, 1262–1275.
- Da Silva, N.C.; Pimentel, M.F.; Honorato, R.S.; Talhavini, M.; Maldaner, A.O.; Honorato, F.A. Classification of Brazilian and Foreign Gasolines Adulterated with Alcohol Using Infrared Spectroscopy. Forensic Science International 2015, 253, 33–42.
- Silva, A.C.; Pontes, L.F.B.L.; Pimentel, M.F.; Pontes, M.J.C. Detection of Adulteration in Hydrated Ethyl Alcohol Fuel Using Infrared Spectroscopy and Supervised Pattern Recognition Methods. Talanta 2012, 93, 129–134.
- Da Silva, M.P.F.; E Brito, L.R.; Honorato, F.A.; Paim, A.P.S.; Pasquini, C.; Pimentel, M.F. Classification of Gasoline as with or without Dispersant and Detergent Additives Using Infrared Spectroscopy and Multivariate Classification. Fuel 2014, 116, 151–157.
- Belay, A.; Ture, K.; Redi, M.; Asfaw, A. Measurement of Caffeine in Coffee Beans with UV/vis Spectrometer. Food Chemistry 2008, 108, 310–315.