
ABSTRACT
The most common techniques used to identify tuna species include methods based on the detection of specific DNA. The quality of species-specific DNA crucially affects the efficiency of amplification during the subsequent polymerase chain reaction (PCR). Detection of DNA in processed products can be adversely affected by DNA fragmentation during the processing steps and the use of ingredients that may inhibit the PCR reaction. In this study, several processing treatments applied to the muscle tissue of yellowfin tuna (Thunnus albacares) were evaluated. For DNA isolation three DNA extraction methods were compared. The concentration, purity, and amplificability of DNA were tested. The results revealed the variability among extraction procedures in terms of DNA quality and quantity in tuna muscle tissue processed under different processing technologies.
Introduction
In recent years, the identification of fish species has gained attention due to the increasing cases of fraud in the fish-processing industry. Tuna belong among the most economically important and currently most endangered traded fish in the world. Tuna muscle tissue is typically used in fish processing, canning being the most common method of preservation.[Citation1] Varying qualities and prices of tuna can lead to the substitution or mixing of valuable fish species with less-valuable ones. The Council Regulation (EC) No. 1536/92[Citation2] laying down common marketing standards for preserved tuna and bonito stipulates specific rules for the marketing of tuna. Both tuna and bonito species are named in the annex of this regulation. This regulation requires exact trade description on every pre-packaging of preserved tuna or bonito. In addition, a clear unequivocal trade description ensures honest trading. EU Reg. 104/2000[Citation3] stipulates that fish products can enter the commercial supply chain only if the commercial name, method of production, and capture area are clearly indicated on the label.[Citation4] The identification of tuna and bonito species according to their morphological features is possible only in whole or lightly processed fish. In processed products such as filleted, smoked, or canned fish, the morphological characteristics are removed. Hence, analytical methods must be used for species identification. Analytical methods are focused mainly on protein or DNA molecules, which are extracted from the fish tissues. Owing to the protein denaturation caused by heating or canning (high temperature in combination with high pressure) processes,[Citation5] DNA is a more suitable molecular marker for fish species authentication because it is more resistant to thermal treatment. Indeed, DNA is also degraded into small fragments during the thermal process but these are still detectable. Some authors[Citation6] have claimed that the canning process degrades DNA to molecules smaller than 123 bp in length. Moreover, DNA is largely independent of tissue source or sample damage.[Citation7,Citation8] Nevertheless, fragment size is a limiting factor for the subsequent PCR reaction, which is based on the selective amplification of specific regions of DNA using oligonucleotides.[Citation8] PCR[Citation9–Citation11] and its modifications—polymerase chain reaction-restriction fragment length polymorphism (PCR-RFLP),[Citation12–Citation15] Polymerase chain reaction-single strand conformation polymorphism (PCR-SSCP),[Citation16,Citation17] real-time PCR,[Citation18–Citation21] and Polymerase chain reaction-enzyme-linked immunosorbent assay (PCR-ELISA)[Citation22]—represent crucial approaches for tuna fish species identification. These approaches comprise DNA extraction from the sample, PCR, and electrophoresis, or alternatively other detection systems for the evaluation of the final results. The critical step is the extraction of high-quality DNA in sufficiently large quantities from heterogeneous food matrices. In some cases, sample pretreatment is required before DNA extraction to remove the fat from the tissues. Owing to the fact that raw fish muscle tissue is subject to different treatment conditions during the manufacturing process (high temperature, high pressure, addition of certain ingredients, etc.), which considerably influences the quality of DNA,[Citation23–Citation25] it is necessary to optimize the DNA isolation procedures for each type of food product individually. In addition, ingredients and other substances present in food matrices (polysaccharides, proteins, or lipids) may not be completely removed during the DNA extraction procedure and may cause PCR inhibition. Inhibitor compounds can interfere with PCR by decreasing or even completely inhibiting the activity of DNA polymerase.[Citation26] Moreover, the chemical reagents used in the isolation procedure may persist as contaminants, which can affect the purity of the extracted DNA. The use of different processing methods in the food industry can cause changes not only in the DNA molecules, but also in the qualitative parameters (nutritional quality and physicochemical properties) of fish or other meat muscle tissues.[Citation27,Citation28]
The aim of this study was to determine the degree that DNA was influenced by the technological processes used in the food industry (mechanical treatment, high temperature, high pressure, addition of ingredients) in self-prepared samples from the muscle tissue of yellowfin tuna (Thunnus albacares). We also determined how the subsequent sample preparation and DNA extraction procedure can affect the qualitative and quantitative parameters of the DNA molecule.
Material and methods
Sample preparation
The samples of tuna fish were prepared from the muscle tissue of yellowfin tuna (Thunnus albacares) purchased as a frozen steak in the Czech market. Species identity was confirmed by sequencing a partial sequence of the cytochrome b gene (SEQme, Hradec Kralove, Czech Republic). A range of muscle samples undergoing different treatments was prepared: raw, canned whole, canned ground, boiled (70°C, 10 min), boiled (90°C, 10 min), smoked (25°C), smoked (60°C), spread, and pâté (). To evaluate the effects of additives contained in commercial canned products, this range of samples was extended. Two groups of canned samples were prepared: canning of solid pieces of muscle (whole) and canning of mechanically processed muscle (ground), both enriched with selected additives. The percentage composition was determined according to the composition described on the packaging of tuna fish products found on the commercial market. Mechanical treatment was employed using the cutter setting in two rotations. The samples were mixed thoroughly, placed into autoclavable glass vessels with caps, and sterilized under the conditions described in and . The samples were prepared in the laboratories of the Department of Meat Hygiene and Technology (University of Veterinary and Pharmaceutical Sciences Brno, Czech Republic).
Table 1 DNA concentrations, purities, and PCR analysis.
Table 2 A260/A280 values for canned samples enriched with ingredients by group.
Table 3 The analysis of DNA from whole and ground canned muscle (kits A, B, C).
DNA isolation
DNA was extracted in duplicate using three commercially available kits based on the column system: kit A (DNeasy Blood and Tissue Kit; Qiagen, Hilden, Germany), kit B (DNeasy mericon Food; Qiagen), and kit C (magnetic separation using magnetic particles; Chemagic DNA Tissue 10 Kit; Chemagen, Baesweiler, Germany). The DNeasy Blood and Tissue Kit is designed for the isolation of DNA from tissues (in this case muscle tissue), while the DNeasy mericon Food Kit can be used for the extraction of DNA from highly processed food products including canned products, and the Chemagic DNA Tissue Kit is designed for the isolation of DNA from tissues. Other kits using magnetic particles can be used for the isolation of DNA from food, but mainly from the food of plant origin. Pretreatment of samples containing oil was performed according to;[Citation23] oil and lipids were removed from canned muscle by soaking in a mixture of chloroform/methanol/water (1:2:0.8) overnight. The extraction procedures were performed according to the protocols supplied by the manufacturers. Sample weight ranged from 10 mg in kits A and C to 200 mg in kit B. Proteolysis was carried out overnight in all extraction protocols.
Species identification by sequencing of the cytochrome b gene
For species identification of the yellowfin tuna (Thunnus albacares) in frozen fish, a 569 bp fragment of the cytochrome b gene was amplified using the L14735-BRmod primer pair.[Citation1] The PCR protocol consisted of an initial denaturation step at 95°C/3 min, followed by 35 cycles of denaturation at 95°C/30 s, annealing at 60°C/30 s, and extension at 72°C/30 s, and finished with a final extension at 72°C/3 min. The purified PCR products were sent for sequencing to SEQme (Hradec Kralove, Czech Republic).
Assessment of DNA quantity and purity
The quality of the extracted DNA was compared by measuring the concentration and purity using a UV spectrophotometer (NanoDrop™ 1000, Thermo Scientific). DNA extracts were quantified by measuring the absorbance at 260 nm (A260). DNA purities were estimated by calculating the A260/A280 ratios. Samples calculated to have A260/A280 ratios of 1.7–2.0 were assumed to be pure, free from protein, and other contaminants. Every sample was measured three times. Measurements were taken at room temperature following sufficient mixing of all samples.
Evaluation of PCR amplificability
To check the suitability of the extracted DNA for subsequent PCR analysis, primers aimed at amplifying fragments of increasing sizes (100, 200, 300, and 500 bp) were designed. As a target marker, the mitochondrial cytochrome oxidase I (COI) gene (KT211351.1) was chosen. For this purpose, Primer3 software was employed. Primer sequences:
COIF1 (5´-ATGGTCTCCCACATTGTTGC-3´) and COIR1 (5´- TGAACCCTAGTAGGCCGATG-3´) amplified a fragment of 100 bp.
COIF2 (5´-GCTTGCTTGCAACCCTTC-3´) and COIR2 (5´- GGCGAATACAGCTCCCATAG-3´) amplified a fragment of 200 bp.
COIF3 (5´-TGGTCTCCCACATTGTTGC-3´) and COIR3 (5´- GCCCTCCAACTGTAAAGAGG-3´) amplified a fragment of 300 bp.
COIF4 (5´-GGGAGACCCAATCCTTTACC-3´) and COIR4 (5´- CGGCAACAATGGCGAATAC-3´) amplified a fragment of 500 bp.
PCR reactions were performed in volumes of 20 μl. Each reaction mixture contained 10 μl of Master Mix (Top Bio, Prague, Czech Republic), 4 μl of PCR water (Top Bio), 10 pmol of each primer (Generi Biotech, Hradec Kralove, Czech Republic), and 4 μl of template DNA. The following PCR conditions were used: a denaturation step at 95°C for 3 min, followed by 35 cycles consisting of 95°C for 30 s, 60°C for 30 s, and 72°C for 50 s, with a final extension at 72°C for 5 min. Amplification was checked by electrophoresis in 1.5% agarose gels using 0.5 X TBE buffer with 8 μl GelGreen(TM) Nucleic Acid Gel Stain (Biotium, Fremont, CA). The intensity of appropriate-sized amplicons was observed and compared with a commercial 100 bp ladder (Qiagen, Hilden, Germany).
Statistical analysis
Statistical analysis was used to interpret the results obtained from the two groups of canned samples (whole and mechanically modified muscle enriched with ingredients). The analysis was performed on an average of three values. The Wilcoxon matched-pairs signed rank test (a non-parametric version of pair t-test) was used for comparison of the samples with whole and mechanically modified muscle. The Friedman test and the Dunn post hoc test (non-parametric ANOVA) were chosen for the comparison of particular isolation kits. Frequency values “A” in groups A < 1.7 /1.7 ≤ A ≤ 2.0 /A > 2.0 were determined with the χCitation2 independence test and Fisher’s exact test.
Results and discussion
In the processed products, DNA is assumed to be exposed to heat, physical, or chemical treatment that can affect the quality and quantity of DNA, presumably by resulting in the fragmentation of DNA molecules. To choose an optimal extraction procedure, several factors have to be taken into account. DNA should contain as little as possible of protein, RNA, organic compounds, or any other PCR inhibitors. DNA concentration and purity were determined spectrophotometrically by measuring DNA absorbance and A260/A280 ratios. The DNA was considered to be satisfactorily pure when the ratios of A260 to A280 were within the range of 1.7–2.0. Contamination of DNA with proteins usually reduces the A260 to A280 ratio to values lower than 1.7.[Citation25] Residual impurities carried over from the DNA extraction procedure, such as phenol or ethanol, are also reported to reduce the A260 to A280 ratio. In this connection, residual chemical contamination from nucleic acid extraction procedures may result in an overestimation of the nucleic acid concentration. The suitability of DNA for PCR amplification was assessed using a set of primers designed to amplify the fragments of increasing size ranging from 100 to 500 bp of the cytochrome oxidase I gene.
Our main task was to determine the differences in the concentration, purity, and amplificability of DNA isolated from non-processed and processed muscle tissue (from Thunnus albacares). Another task was to determine the effect of the addition of ingredients used in canned tuna products on the quality of DNA. Finally, we aimed to compare the efficiency of the three commercial kits used for the DNA isolation.
Based on the determination of DNA concentration using the spectrophotometer, we could identify differences in the efficiency of particular kits (, ). Several technological processes were chosen and used (cooking, smoking, canning; in canned products mechanical treatment was studied, as well as the production of spread and pâté). Generally, the highest concentration was detected in raw muscle (except kit A), followed by boiled and smoked muscle. Lower amounts of DNA were observed in canned samples (lower in canned ground than in canned whole) and the lowest concentrations were detected in samples containing spread and pâté (excepted for kit C). As for determining the quality of DNA by calculating the A260/280 absorbance ratios, most of the samples were in the specified range of 1.7–2.0 (). Samples outside this range may have been contaminated with proteins or other constituents. From the values listed in , kit B can be regarded as optimal; the samples had the highest DNA concentration values compared to the other kits and the DNA samples were of satisfactory purity in 7 of 9 samples. In a subsequent PCR reaction, four sets of primers that were designed to amplify the PCR products of different lengths (100, 200, 300, and 500 bp) were tested. The results of PCR analysis for individual kits are shown in –. Sample 1 (raw muscle) is also the reference sample. Small fragments of DNA were detectable in almost all samples (depending on the kit). It was demonstrated that the longer the amplified segment was (500 bp), the lower was the probability of detection (–). The PCR product of 100 bp in length was detected in all samples using all three types of kits with the exceptions of spread and pâté using kit C. The PCR product of 200 bp in length was observed in all samples except for spread using kits B and C, and pâté using kit C. The 300 bp PCR amplicon was not identified in boiled (70°C) and smoked (60°C) muscle, both using kit C, and spread and pâté, both using kits B and C. The band of 500 bp was not visualized in smoked (60°C) muscle using kits A and C, in the spread using all three types of kits, and pâté using kits A and C. The lowest DNA quality (in terms of size of the PCR product) was observed in spread and pâté, which corresponds to the low DNA concentrations detected (). Using kit C, the DNA concentration values for these samples were indeed higher, but this could be due to the presence of residual reagents and other contaminants, which may have been captured during the extraction procedure and which could have further caused an apparent increase of DNA concentration. Addition of additives (oil, mayonnaise, salt, etc.) to these types of products can also influence the detection of DNA by inhibiting PCR, as evidenced in the low A260/A280 ratios (1.5). On the other hand, DNA concentrations did not necessarily correspond to the suitability of the DNA for PCR analysis. As can be seen in , DNA concentration in canned muscle extracted using kit C had lower values, for example, but the PCR products were visualized. On the other hand, in spread or pâté where higher DNA concentrations were detected, no PCR products of any lengths were detectable. Similarly, the A260/280 values that did not correspond to the desired ratios did not always indicate the unsuitability of DNA for PCR analysis. For example, a sample with canned whole muscle (DNA isolated with kit A) reached an A260/280 ratio of 2.4, but PCR amplification was successful for the PCR products of all sizes. High 260/280 ratios will not necessarily inhibit the PCR. The sample containing muscle smoked at 60°C (DNA isolated with kit A) had an A260/280 ratio of 1.5 and PCR products of all sizes were amplified except for 500 bp. For most tuna products (canned samples—whole or ground muscle) even the 500 bp PCR product was detected. These results are at variance with[Citation6] where it was described that the DNA extracted from canned tuna samples was smaller than the 123 bp standard. The degree of DNA fragmentation in canned tuna was tested;[Citation23] they could detect a PCR product of up to 300 bp depending on the used extraction procedure. In accordance with the published data, in our study, we could detect even 500-bp-long PCR products in canned tuna samples.
Figure 1. Comparison of DNA extraction from samples treated with different processes.
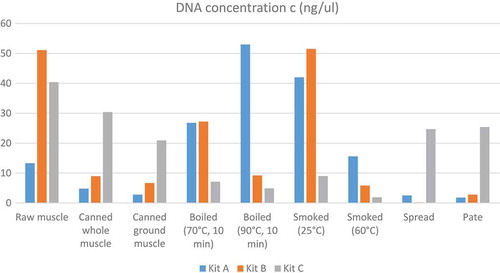
Figure 2. Kit A 100/200 bp 1—raw muscle; 2—canned whole; 3—canned ground; 4—boiled (70°C); 5—boiled (90°C); 6—smoked (25°C); 7—smoked (60°C); 8—spread; 9—pâté; C—negative control; L—ladder.
Figure 3. Kit A 300–500 bp 1—raw muscle; 2—canned whole; 3—canned ground; 4—boiled (70°C); 5—boiled (90°C); 6—smoked (25°C); 7—smoked (60°C); 8—spread; 9—pâté; C—negative control; L—ladder.
Figure 4. Kit B 100/200 bp 1—raw muscle; 2—canned whole; 3—canned ground; 4—boiled (70°C); 5—boiled (90°C); 6—smoked (25°C); 7—smoked (60°C); 8—spread; 9—pâté; C—negative control; L—ladder.
Figure 5. Kit B 300/500 bp 1—raw muscle; 2—canned whole; 3—canned ground; 4—boiled (70°C); 5—boiled (90°C); 6—smoked (25°C) 7—smoked (60°C); 8—spread; 9—pâté; C—negative control; L—ladder.
Figure 6. Kit C 100/200 bp 1—raw muscle; 2—canned whole; 3—canned ground; 4—boiled (70°C); 5—boiled (90°C); 6—smoked (25°C); 7—smoked (60°C); 8—spread; 9—pâté; C—negative control; L—ladder.
Figure 7. Kit C 300/500 bp 1—raw muscle; 2—canned whole; 3—canned ground; 4—boiled (70°C); 5—boiled (90°C); 6—smoked (25°C); 7—smoked (60°C); 8—spread; 9—pâté; C—negative control; L—ladder.
The other tested groups consisting of 23 samples prepared from the whole or ground muscle tissue, either enriched with the selected ingredients (22 samples) or without the ingredients (one sample), underwent the canning process. The muscle was mixed up to determine whether there was any potential for the greater effects on DNA quality when permeation of the ground muscle with particular ingredients was more thorough compared with the whole muscle. For the comparison of the samples of whole and ground canned muscle tissue (regardless of the effect of the ingredients), the Wilcoxon matched-pairs signed rank test was used. For comparison of the efficiency of the particular extraction kits, the Friedman test and the Dunn post hoc test (non-parametric ANOVA) were used. The frequency values of A260/A280 in groups A < 1.7 /1.7 ≤ A ≤ 2.0 /A > 2.0 were estimated with the χCitation2 independence test and Fisher̕ s exact test.
Statistically significant differences in DNA concentration between the whole and ground muscle were found in the case of kits A (p < 0.01; Wilcoxon test) and B (p < 0.05; Wilcoxon test). While with kit A, the DNA concentration values in most of the whole muscle samples were lower than in the ground muscle samples, with kit B it was the opposite. With kit C a statistically significant difference between whole and ground muscle was not found. With kit A, it is likely that the chemical substances used during the extraction procedure may have caused more efficient permeation to the ground muscle compared with the whole muscle, but this was not observed in sample 1 (whole and ground muscle without ingredients). In the case of whole muscle samples, we observed a statistically significant difference in DNA concentrations among the kits (p < 0.01; Friedman test). Subsequent testing demonstrated that statistically significant differences were evident between all pairs of kits (p < 0.01; Dunn test), while the highest DNA concentration values were observed using kit C, and the lowest with kit A. In the case of ground muscle samples, we found a statistically significant difference among the kits (p < 0.01; Friedman test). Subsequent testing revealed that the statistically significant difference was only evident between kits A and C, and between kits B and C (p < 0.01; Dunn test), while the highest DNA concentration values were obtained using kit C. Between kits A and B, no statistically significant differences were found.
A statistically significant difference in A260/A280 between whole and ground muscle was observed only using kit B (p < 0.01; Wilcoxon test), while the highest A260/A280 values were reached in ground muscle samples. In the case of whole muscle samples, we observed a statistically significant difference among the kits (p < 0.01; Friedman test). Subsequent testing demonstrated that a statistically significant difference was evident between all pairs of kits (p < 0.01; Dunn test). The highest A260/A280 values were obtained using kit A, whereas the lowest were obtained using kit C (except for sample 1 always under the 1.7 limit). In the case of ground muscle samples, we found that there was a statistically significant difference among the kits (p < 0.01; Friedman test). Subsequent testing revealed that the statistically significant difference was only between kits A and C, and between kits B and C (p < 0.01; Dunn test), while the lowest A260/A280 values were obtained using kit C. Between kits A and B no statistically significant difference was observed.
The χCitation2 independence test confirmed an association (p < 0.01) between the distribution of A260/A280 ratios and kit with respect to the type of the sample (whole/ground muscle). For the type of the sample the highest statistically significant difference (p < 0.05) was detected using kit B (). The use of kit C resulted in the highest DNA concentration values for all whole and ground muscle samples, but almost all A260/A280 values were lower than 1.7. This could be caused by residual chemical contamination from nucleic acid extraction procedures, which may reduce the A260/A280 ratio and may result in an overestimation of the nucleic acid concentration. Kit B appears to be the most suitable, as in all whole muscle samples and most ground muscle samples, this kit gave higher DNA concentration values than kit A (13 out of 23).
The effect of additives mixed together with muscle tissue revealed differences among particular kits and also among samples of whole and ground muscle tissue. According to[Citation23] a lower amount of recovered DNA can be caused by the presence of brine; this finding could be explained by a washing-out step used in the extraction procedure. The adverse effect of brine on DNA yield was observed only when using kit C. Using kits A and B, the DNA concentrations were even higher compared with the sample without brine. Among other ingredients, vinegar and lemon are substances that are known to lower pH, which could be a reason of DNA degradation.[Citation29] Using both kits B and C, the adverse effect on DNA yield caused by the presence of vinegar and lemon was observed. Using kit A, this was observed only for lemon and in the case of ground muscle this effect was not seen at all. Onion contains the flavonoid quercetin that can inhibit protein kinase C activity (PKC) and mitogen-activated protein kinase 1 (MEK). These effects appear to decrease the DNA yield in samples containing onion.[Citation30] This was observed consistently in the present study in whole muscle samples containing onion using three types of kits. In contrast, the presence of ingredients in some samples resulted in better DNA yield. The colour extracted from the samples containing particular ingredients (carrots using all three kits, tomato puree, chili, oregano, tomatoes, green pepper, and black olives using kit B or C) could result in higher absorbance values, which could lead to the misinterpretation of the obtained results as suggested by.[Citation23] Perhaps the filtration of coloured DNA could solve this problem. Another possible explanation is the potential presence of DNA of particular additives that could cause the increase of DNA concentration in some samples. Unexpectedly, in kit A, the lowest DNA yield was estimated in samples containing peas, and the highest DNA concentration values were determined in samples containing beans. Although both are legumes, their effects were completely opposing.
The quality, as assessed by the A260/A280 ratios, was decreased (A260/A280 < 1.7) in samples containing brine and vinegar, using both kits A and B; using kit C, every sample gave ratios lower than 1.7. Although purity ratios are important indicators of sample quality, the best indicator is functionality in the following PCR amplification. There are occasions when the purity ratios are within the expected limits, but nevertheless, there is a problem with downstream application. Accordingly, the presence of additives may adversely influence the subsequent PCR amplification if they can inhibit DNA polymerase activity in PCR[Citation26] and decrease its sensitivity. The impact of additives on DNA concentration and purity was not conclusively established and their effects on the suitability of extracted DNA for PCR amplification were further evaluated in subsequent PCR analysis. PCR confirmed the results obtained by the statistical analysis of the comparison of whole and ground canned samples, where kit A provided higher DNA concentrations from ground muscle, which indicates better PCR amplificability in ground muscle samples. An opposite picture was seen using kit B. Kit C showed the highest DNA concentration values, but all the samples isolated using kit C had purities outside the A260/280 ratio (1.7–2.0). This finding was confirmed by PCR analysis, where samples isolated using kit C performed poorly in subsequent amplification. The effect of ingredients used in the canning process on PCR amplification differed among the particular extraction kits (). The inhibitory effects of vinegar as well as brine were observed using only kit A. Using kit B, the inhibitory effects of vinegar or lemon were observed only in the case of the 500 bp band and the 300 bp band (in ground muscle). In general, shorter PCR products were detected in most samples depending on the particular kits.
Conclusion
The need for identifying fish species in foodstuffs is important for the prevention and detection of food adulteration and for the protection of consumers with fish allergies. The quality of DNA affects the efficiency of amplification during the subsequent PCR reaction. The results of this analysis revealed variability between three DNA extraction procedures in terms of DNA quality and quantity in tuna muscle tissue processed under different conditions. The highest DNA concentrations were observed in non-processed muscle (except kit A), while canned muscle, spread, and pâté yielded the lowest amounts of DNA. The temperature and pressure used in food processing did not result in lower amplificability as judged by the size of the PCR product that could be amplified, while in case of spread and pâté an inhibitory effect was observed using all types of kits. Comparing the parameters of whole and ground canned muscle tissue with the content of ingredients, use of kit C gave in all whole and ground muscle samples the highest DNA concentration values, but almost all A260/A280 values were lower than 1.7 and the PCR analysis was not considered to be optimal. The effect of additives mixed together with muscle revealed differences in terms of decreasing but also raising the DNA yield among particular kits. In general, the size of the targeted PCR amplicon has to be considered as the essential parameter for a successful PCR analysis.
Acknowledgements
The authors would like to thank RNDr. Vladimir Babak (Veterinary Research Institute Brno, Czech Republic) for the statistical analysis of the obtained results and Ing. Ludmila Faldikova (Veterinary Research Institute Brno, Czech Republic) and Neysan Donnelly (Max-Planck-Institute of Biochemistry, Munich, Germany) for grammatical corrections of the manuscript.
Funding
This work was supported by the Ministry of Agriculture of the Czech Republic (QJ1530107) and by the Internal Grant Agency of the University of Veterinary and Pharmaceutical Sciences, Brno, Czech Republic (229/2016/FVHE).
Additional information
Funding
References
- Espineira, M.; Gonzalez-Lavín, N.; Vieites, J.M.; Santaclara, F.J. Development of a Method for the Identification of Scombroid and Common Substitute Species in Seafood Products by FINS. Food Chemistry 2009, 117, 698–704.
- Council Regulation (EC) No 1536/92 of the European Parliament and of the Council of 9 June 1992 Laying down Common Marketing Standards for Preserved Tuna and Bonito. Official Journal L163 1992, 17(6), 1–4.
- Council Regulation (EC) No 104/2000 of 17 December 1999 on the Common Organization of the Markets in Fishery and Aquaculture Products. Official Journal L17 2000, 21(01), 22–52.
- Civera, T. Species Identification and Safety of Fish Products. Veterinary Research and Communications 2003, 27, 481–489.
- Mackie, I.M.; Pryde, S.E.; Gonzales-Sotelo, C.; Medina, I.; Peréz-Martín, R.; Quinteiro, J.; Rey-Mendez, M.; Rehbein, H. Challenges in the Identification of Species of Canned Fish. Trends in Food Science & Technology 1999, 10, 9–14.
- Ram, J.L.; Ram, M.L.; Baidoun, F.F. Authentication of Canned Tuna and Bonito by Sequence and Restriction Site Analysis of Polymerase Chain Reaction Products of Mitochondrial DNA. Journal of Agricultural and Food Chemistry 1996, 44, 2460–2467.
- Bossier, P. Authentication of Seafood Products by DNA Patterns. Journal of Food Science 1999, 64, 189–193.
- Lockley, A.K.; Bardsley, R.G. DNA-Based Methods for Food Authentication. Trends in Food Science & Technology 2000, 11, 67–77.
- Bartlett, S.E.; Davidson, W.S. Identification of Thunnus Tuna Species by the Polymerase Chain Reaction and Direct Sequence Analysis of Their Mitochondrial Cytochrome B Genes. Canadian Journal of Fisheries and Aquatic Sciences 1991, 48, 309–317.
- Bottero, M.T.; Dalmasso, A.; Cappelletti, M.; Secchi, C.; Civera, T. Differentiation of Five Tuna Species by a Multiplex Primer-Extension Assay. Journal of Biotechnology 1997, 129, 575–580.
- Dalmasso, A.; Civera, T.; Bottero, M.T. Biomolecular Approaches for the Identification of Tuna Species. Veterinary Research and Communications 2006, 30, 179–181.
- Takeyama, H.; Chow, S.; Tsuzuki, H.; Matsunaga, T. Mitochondrial DNA Sequence Variation within and between Tuna Thunnus Species and Its Application to Species Identification. Journal of Fish Biology 2001, 58, 1646–1657.
- Pardo, M.A.; Pérez-Villareal, B. Identification of Commercial Canned Tuna Species by Restriction Site Analysis of Mitochondrial DNA Products Obtained by Nested Primer PCR. Food Chemistry 2004, 86, 143–150.
- Lin, W.F.; Shiau, C.Y.; Hwang, D.F. Identification of Four Thunnus Tuna Species Using Mitochondrial Cytochrome B Gene Sequence and PCR-RFLP Analysis. Journal of Food and Drug Analysis 2005, 13, 382–387.
- Lin, W.F.; Hwang, D.F. Application of PCR-RFLP Analysis on Species Identification of Canned Tuna. Food Control 2007, 18, 1050–1057.
- Rehbein, H.; Mackie, I.M.; Pryde, S.; Gonzales-Sotelo, C.; Medina, I.; Perez-Martin, R.; Quinteiro, J.; Rey-Mendez, M. Fish Species Identification in Canned Tuna by PCR-SSCP: Validation by a Collaborative Study and Investigation of Intra-Species Variability of the DNA-Patterns. Food Chemistry 1999, 64, 263–268.
- Colombo, F.; Mangiagalli, G.; Renon, P. Identification of Tuna Species by Computer-Assisted and Cluster Analysis of PCR-SSCP Electrophoretic Patterns. Food Control 2005, 16, 51–53.
- Lopez, I.; Pardo, M.A. Application of Relative Quantification Taqman Real-Time Polymerase Chain Reaction Technology for the Identification and Quantification of Thunnus alalunga and Thunnus albacares. Journal of Agricultural and Food Chemistry 2005, 53, 4554–4560.
- Terio, V.; Di Pinto, P.; Decaro, N.; Parisi, A.; Desario, C.; Martella, V.; Buonavoglia, C.; Tantillo, M.G. Identification of Tuna Species in Commercial Cans by Minor Groove Binder Probe Real-Time Polymerase Chain Reaction Analysis of Mitochondrial DNA Sequences. Molecular and Cellular Probes 2010, 24, 352–356.
- Chuang, P.; Chen, M.; Shiao, J. Identification of Tuna Species by a Real-Time Polymerase Chain Reaction Technique. Food Chemistry 2012, 133, 1055–1061.
- Liu, S.S.; Xu, K.H.; Wu, Z.G.; Xie, X.; Feng, J.L. Identification of Five Highly Priced Tuna Species by Quantitative Real-Time Polymerase Chain Reaction. Mitochondrial DNA 2016, 27, 3270–3279.
- Santaclara, F.J.; Velasco, A.; Pérez-Martin, R.I.; Quinteiro, J.; Rey-Méndez, M.; Pardo, M.A.; Jimenez, E.; Sotelo, C.G. Development of a Multiplex PCR-ELISA Method for the Genetic Authentication of Thunnus Species and Katsuwonus pelamis in Food Products. Analytical Methods 2015, 180, 9–16.
- Chapela, M.J.; Sotelo, C.G.; Pérez-Martin, R.I.; Pardo, M.A.; Pérez-Villareal, B.; Gilardi, P.; Riese, J. Comparison of DNA Extraction Methods from Muscle of Canned Tuna for Species Identification. Food Control 2007, 18, 1211–1215.
- Besbes, N.; Fattouch, S.; Sadok, S. Comparison of Methods in the Recovery and Amplificability of DNA from Fresh and Processed Sardine and Anchovy Muscle Tissue. Food Chemistry 2011, 129, 665–671.
- Cawthorn, D.; Steinman, H.A.; Witthuhn, R.C. Comparative Study of Different Methods for the Extraction of DNA from Fish Species Commercially Available in South Africa. Food Control 2011, 22, 231–244.
- Di Pinto, A.; Forte, V.T.; Guastadisegni, M.C.; Martino, C.; Schena, F.P.; Tantillo, G. A Comparison of DNA Extraction Methods for Food Analysis. Food Control 2007, 18, 76–80.
- Karimian-Khosroshahi, N.; Hosseini, H.; Rezaei, M.; Khaksar, R.; Mahmoudzadeh, M. Effect of Different Cooking Methods on Minerals, Vitamins, and Nutritional Quality Indices of Rainbow Trout (Oncorhynchus mykiss). International Journal of Food Properties 2016, 19, 2471–2480.
- Kang, Z.L.; Li, B.; Ma, H.J.; Chen, F.S. Effect of Different Processing Methods and Salt Content on the Physicochemical and Rheological Properties of Meat Batters. International Journal of Food Properties 2016, 19, 1604–1615.
- Bauer, T.; Weller, P.; Hammes, W.P.; Hertel, C. The Effect of Processing Parameters on DNA Degradation in Food. European Food Research and Technology 2003, 217, 338–343.
- Lee, K.W.; Kang, N.J.; Heo, Y.S.; Rogozin, E.A.; Pugiliese, A.; Hwang, M.K.; Bowden, G.T.; Bode, A.M.; Lee, H.J.; Dong, Z. Raf and MEK Protein Kinases are Direct Molecular Targets for the Chemopreventive Effect of Quercetin, a Major Flavonol in Red Wine. Cancer Research 2008, 68, 946–955.