
ABSTRACT
This study investigated the feasibility of determining the content of Goji berry total sugar (GBTS) through Fourier transform near-infrared (FT-NIR) spectroscopy combined with chemometrics. A total of 114 Goji berry samples from different regions in China were scanned with a FT-NIR reflectance spectroscopic system. X-loading weights and correlation coefficients were utilised to identify the most influential wavelength after the selection of spectra processing methods. Partial least squares regression was applied to build models, and paired t test was used for external validation. The model with raw spectra after pre-treatment with Norris gap derivatives and effective wavelength of 8700–4000 cm−1, which were determined by the correlation coefficients, exhibited the best predicative ability. In addition, the determination coefficients (R2) of calibration validation set were both greater than 0.9 when principal component number was 6. The model presents good performance, with root mean square errors (RMSE) of 0.406 and 0.695 for the prediction of calibration validation set, relatively. The use of FT-NIR spectroscopy to implement quick determination of GBTS is thus feasible.
Introduction
Lycium barbarum L. (L. barbarum), Goji berry or wolfberry, is a traditional edible Chinese medicine that tastes sweet; it nourishes the liver and kidney and replenishes vital nutrients that are essential to eyesight improvement.[Citation1–Citation6] Goji berry is involved in various biological activities, including anti-oxidation, anti-aging, anti-tumour, and immune system enhancement.[Citation7] Goji berry is mainly produced in Ningxia, Gansu, Qinghai, and other western regions of China.[Citation8] Goji berry mainly contains polysaccharides, total sugar, carotenoids, vitamin C, scopoletin, amino acids, and trace elements.[Citation9] Goji berry total sugar (GBTS) is the floorboard of free monosaccharides, disaccharides, and oligosaccharides and is the major source of Goji berry’s sweetness; it exerts a significant effect on edibility and storage performance and serves as a main indicator of quality and grade.[Citation10] Therefore, a quick, accurate, and valid means to determine GBTS content is highly necessary.
The traditional method to determine GBTS is the use of Fehling’s solution. Under a boiling condition, the sample solution is utilised to titrate a certain amount of Fehling’s solution. The end point of titration is reached when the colour blue fades. Accurate instrumental analysis of total sugar has been performed in recent years. For example, total sugar has been measured through high-performance liquid chromatography (HPLC) or gas chromatography (GC) after samples have been derived.[Citation11,Citation12] Zhao et al.[Citation10] determined GBTS through GC in their research on the changes in sugars and organic acids in Goji berry during development and maturation. GC analysis demands transition into volatilisable and stable derivatives because of the high polarity, hydrophilicity, and low volatility of sugars. HPLC is utilised more often than GC because of its reliability and accuracy.[Citation13] Meanwhile, HPLC on cationic exchange resins in calcium, hydrogen, or other forms and on silica-based amino-alkyl modified phases can be utilised to analyse sugars directly. All these methods exhibit high accuracy and good reproducibility, but their complexity of operations, cumbersome procedures, or need for numerous chemicals can pose an environmental risk. Quick and simple methods for GBTS analysis and an NIR technique for sugar analysis are thus required.
NIR spectroscopy has been widely utilised in the direct and rapid detection of chemical components of food and farm produce because it is non-destructive, does not require the use of reagents, and entails a simple operation.[Citation14,Citation15] Dong et al.[Citation16] developed models for a quantitative analysis of four analytes, including total sugar of Chinese hawthorn, with NIR spectroscopy. Zhuang et al.[Citation17] developed a method to differentiate Chinese yam samples collected from four geographical regions and analysed total sugar, polysaccharides, and flavonoids through NIR and mid-infrared (mid-IR) spectroscopy. Additionally, FT-NIR represents a valid instrument for food classification.[Citation18] The use of NIR spectroscopy to determine the origin of Goji berry has achieved good results.[Citation19–Citation21] Du et al.[Citation19] proved that the surface NIR spectra of wolfberry fruit can be utilised in the accurate identification of geographic regions by using a portable NIR spectrometer combined with multi-class support vector machines. Shen et al.[Citation20] applied NIR spectroscopy and chemometrics as tools to analyse Chinese Goji berry samples from four different topographical regions and to build a total flavonoid content (TFC) prediction model. Tang et al.[Citation21] obtained 40 samples from different areas and detected and analysed 13 chemical components through NIR spectroscopy. However, the model lacks representativeness because of the limited number of calibration and validation samples. Therefore, a highly representative and accurate model of GBTS through NIR spectroscopy needs to be established. In FT-NIR analysis, the representative calibration samples and spectral pre-treatment methods are two of the most important factors for the method development.[Citation16,Citation20]
Spectral pre-processing and effective wavelength (EW) selection techniques can be applied to remove any irrelevant information which cannot be handled properly by partial least squares (PLS).[Citation22] EW selection can improve the performance of models because a large number of irrelevant wavelengths can impair model robustness, and the accuracy of the PLS-algorithm reduces with increasing numbers of wavelength variables.[Citation23,Citation24] Therefore, the objective of this study is to provide a reference for rapid detection of GBTS with pre-processing of the FT-NIR spectra and selection of the most useful wavelengths.
Materials and methods
Materials
A total of 114 Goji berry samples were collected from different regions in China, including Ningxia (1–48), Inner Mongolia (49–60), Gansu (61–80), Qinghai (81–101), Hebei (102–108), and Xinjiang (109–114). The samples were grouped according to their area of origin. All samples were randomly selected from each group to create calibration (1–23, 25–45, 47–58, 62–77, 79–89, 91–96, 98–100, 102–106, 108–110, 112, 114), validation (2–5, 10, 13, 35–36, 42, 44, 57–58, 68–70, 81, 95, 102, 108, 110), and blind sample (24, 46, 59, 60, 61, 78, 90, 97, 111, 113) sets. The calibration set was applied to develop the model. The validation set was utilised to validate model performance. The blind sample set was used to test the prediction accuracy of the model. The anhydrous ethanol, sulphuric acid, phenol (Luoyang Haohua Chemical Reagent Co., Ltd.), and glucose (Suzhou Chenxiang chemical Co., Ltd.) utilised in this study were of analytical grade.
Instruments and equipment
An MPA-TM FT-NIR spectrometer (Bruker Optics) from German Bruker with a detector of InGaAs was employed.
Total sugar determination by chemical method
A 200 g sample was obtained (with the quartering making sample reduced to 100 g) and then pulverised to a uniform size. Exactly 2.00–3.00 g (m) of the sample was weighed and placed in a 250 mL volumetric flask. Water was added to a volume of ~200 mL. Afterwards, the volumetric flask was placed in a water bath for 30 min at 80°C ± 2°C and shaken several times. The flask was eventually cooled to room temperature. Subsequently, zinc acetate and potassium ferrocyanide solutions (5 mL) were added with shaking. Filtration was applied (early filtrate of about 30 mL was discarded), and the filtrate was set aside. A total of 50 mL of the filtrate was obtained, and 10 mL hydrochloric acid (6 mol/L) was added to a 100 mL volumetric flask, which was then heated to hydrolysis for 15 min in a 75–80°C water bath. A drop of methyl red indicator was added after cooling to room temperature, and a sodium hydroxide solution of 200 g/L was utilised to neutralise the mixture. Finally, the mixture was diluted to a constant volume with water, and a sample solution was obtained.
The concentration of the glucose standard solution is 1 g/L (0.0001 g). Fehling’s A and B reagent solutions (2 mL each) and a supplement of 15 mL glucose standard solution were poured into a 250 mL Erlenmeyer flask. Then, a glucose standard solution that is 1–2 mL less than the predicted value from the burette was added. This mixture was placed in a small furnace and heated to the boiling point. A methylene blue indicator solution (5 drops) was added immediately. Two to three drops were continuously dripped per second until bivalent copper ions were completely reduced to brick red cuprous oxide precipitate and the blue colour faded. Then, the total volume of the consumption of glucose standard solution (V0) was recorded. The steps to measure the sample solution are approximately similar to those utilised to standardise the alkaline copper tartrate solution mentioned above, except that 5–10 mL (V1) of the test solution was added after Fehling’s reagent solution was mixed according to the content of total sugar and supplement glucose standard solution of proper quantities as needed. Similarly, the total volume of consumption of the glucose standard solution (V2) was recorded. Total sugar (glucose note) was calculated with the formula
Spectral acquisition
The samples were dried in an oven for 48 h to reduce the errors caused by moisture content and stored in hermetic bags for spectral acquisition. The NIR spectrometer was warmed up for 30 min. The OPUS software was initialised, the signal was checked, the peak was recorded, and the background spectrum was scanned and then rescanned every 1 h. For sample spectra acquisition, a rotating sample cup (diameter of 50 mm, height of 50 mm) was filled with sample particles. Linear eccentricity was 10 mm. Rotary integrating sphere diffuse reflection was adopted to scan the sample spectra. Samples were obtained randomly to avoid errors as a result of continuously scanning the samples in the same region. The spectra ranged from 12000–4000 cm−1, as measured by an average of 64 scans with a resolution of 8 cm−1. Each sample was measured 10 times in parallel, and the average obtained from the same sample served as the data of this sample in the next calculation process.
Chemometric analysis
Spectral pre-processing was accomplished for the proper disposition and change in the spectrum to weaken or even eliminate the influence of various non-target factors, remove extraneous information variables as much as possible, improve the resolution and sensitivity, and allow the calibration model to have improved predictive ability and robustness. SG derivatives (S-G D), SG smoothing (S-G S), multiplicative scatter correction (MSC), and standard normal transformation (SNV) are commonly utilised for pre-processing.[Citation25] Derivation helps correct the baseline influence, remove non-chemical factors, and eliminate duplicate ranges. For S-G D pre-treatment, three parameters, namely, derivative, degree of polynomial, and smooth points, were set. S-G S pre-treatment had two parameters, namely, degree of polynomial and smooth points. N-G D pre-treatment had two parameters only, which are derivative order and gap size. S-G D pre-treatment was applied for spectral data smoothing and polynomial fitting. The derivative was then calculated. S-G S pre-treatment was also for spectral data smoothing and polynomial fitting. N-G D pre-treatment was used to fetch points across the gap to form new spectral data and finally realise fitting derivation.
EW selection
EW selection simplifies the main model, enhances the predictive capability and firmness of calibration models, and reduces the interference of irrelevant or non-linear variables. Full-spectrum data with optimum pre-treatment were applied to establish the PLS model, and the X-loading weights of principle components (PCs) by PLS were obtained. A diagram of loading weights was created, with wavenumber as the horizontal ordinate and loading weights as the vertical ordinate. The loading weights are large, indicating that this wave range has a significant effect on the modeling. The full-spectrum data after pre-processing and the corresponding chemical values were imported in Excel. Then, the CORREL function was utilised, and a diagram of correlation coefficients was created with wavenumber and correlation coefficients as the horizontal and vertical ordinates, respectively. The correlation coefficients reflect the correlation with the corresponding chemical values.[Citation26] The optimum spectral regions were determined by creating a section using the X-loading weights and correlation coefficients and performing a comparison with the modeling effect of full wavelength.[Citation27–Citation29]
Calibration and validation
The quantitative model of total sugar utilised PLS with spectral and chemical data imported into Unscrambler software.[Citation24] According to the comparison of model performance under different spectral pre-treatments, the modeling ranges, and PCs, the quantitative model was obtained by determining the optimum modeling conditions.[Citation30] The evaluation indicators of the model included determination coefficients of calibration (RC2) and validation (RV2) and root mean square error of calibration (RMSEC) and validation (RMSEV).[Citation30]
Blind sample validation
Blind samples were predicted by the quantitative model, and paired t test was conducted between the predicted and actual values to analyse the feasibility of the model. The two data series of GBTS obtained by both chemical and FT-NIR spectra methods were inputted into SPSS 20.0 software to execute the paired t test.
Software
All statistical treatments were performed with Excel (Microsoft Corporation, USA), Unscrambler X 10.1 (CAMO, Norway), and SPSS 20.0 (International Business Machines Corporation, USA). The software used in NIR spectroscopy processing is OPUS 5.5 (Bruker, Germany).
Results and discussion
Total sugar chemical analysis
The total sugar contents of the 114 Goji berry samples in the calibration (40.72–60.73%), validation (40.88–60.53%), and blind samples (40.85–60.46%) sets were determined and analysed. According to the above measurement results, the total sugar content basically covering China’s major regions have a wide range because the samples were from different areas in China and their information is abundant and representative. The range of variation of the validation and prediction sets is within the range of variation of the calibration set. Tang et al. utilised 40 Goji berry samples, including 30 calibration and 10 validation samples; the determination results of total sugar content were 40.70–53.78% using the chemical method.[Citation21] The maximum total sugar content was not sufficiently large, and the minimum value was almost as large as the measured value above.
Spectral analysis
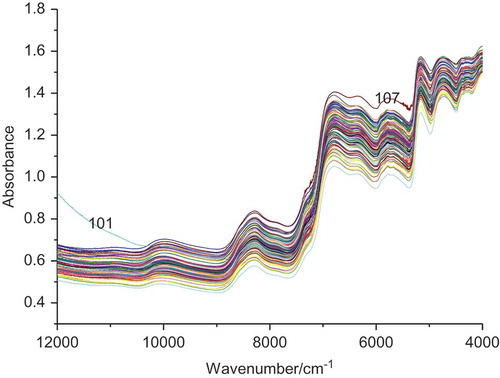
Acquisition of the spectra of the 114 samples was conducted randomly. As shown in , the spectrum of the different Goji berry samples is rather similar, so it is difficult to establish the connection among a specific peak position, peak intensity or peak shape, and a specific target component. The sample spectra required effective spectral information extracted further by the method of chemometrics. A large difference exists between numbers 101 with 107 and the other samples probably because several improper operations occurred when the spectra are collected. Hence, they were removed in the subsequent analysis for the difference between its actual and predicted values exceeds two times the standard error of cross-validation. The untreated FT-NIR absorbance spectra of the Goji berry samples were similar (). The FT-NIR peaks were connected with the frequencies; overtones O–H, C–H, and N–H were extremely likely associated with sugars, fats, and proteins. The small peak at around 10100 cm−1 is ascribed to the second overtone of O–H and the second overtone of N–H. Bands at around 6900 cm−1 were observed and are ascribed to the first overtone of O–H and N–H stretching vibration from ROH and CONH2. The bands evolving at around 5700 cm−1 were caused by the first overtone of C–H and S–H. The peaks at about 5100 and 4600 cm−1 are attributed to the second C = O stretching vibrations of RCOR and N–H and O–H combination of CHO.[Citation31,Citation32] The absorption peaks of GBTS may include peaks at around 6900, 5100, and 4600 cm−1. Given that the spectral information overlaps seriously and planting species and environmental factors differ, the content of the main compound also differs. Thus, the original spectra must be processed so that total sugars can be quantitatively analysed through NIR spectroscopy.
Figure 1. FT-NIR spectra of the samples.
Spectral pre-treatment
The model performances under different pre-treatment processes are listed in . Several spectral pre-treatment methods, including S-G D, SNV, S-G S, and N-G D, were investigated. Comparison of models using different pre-treatment methods revealed that N-G D pre-treatment provides good results; Rc2 and Rv2 increased to 0.979 and 0.921, respectively, when PC was 6. Hence, it was selected as the optimum pre-treatment. For SNV, S-G D, and S-G S pre-treatment, no significant difference was observed when compared with the original spectral model performance.
Table 1. Selection of pre-processing methods.
EW selection
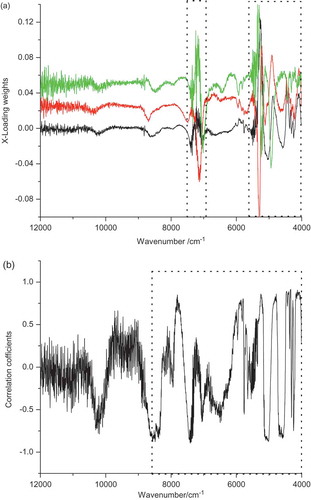
The PCA overview of Unscrambler shows the corresponding loading weights with PCs varying when selecting the X-loading weights, which is particularly suitable for spectral data because of the ideal prediction of the useful range for modeling. shows the X-loading weights of the spectrum under the first three principal components (the loading weights of the second and third PCs successively increased by 0.025). After optimal pre-treatment, a diagram of the correlation coefficients was obtained by inputting the data to Excel and utilising the CORREL function, as shown in . shows that the loading weights of the region within 7540–6970 cm−1 and 5590–4000 cm−1 are large and exhibit a large degree of variation. Hence, the range was selected as the feature range. shows that the correlation coefficient is small within 12000–8800 cm−1, whereas the value within 8700–4000 cm−1 is comparatively larger. Therefore, this range was selected for modeling. As for the PLS model, the results of the comparison of feature range by these methods with full spectrum are shown in .
Table 2. Model performance with EW.
Figure 2. EW selection by X-loading (a) and correlation coefficients (b).
shows that the predictive determination coefficient is the lowest under the condition of full spectrum, which contains not only the effective sample information but also some interference information because of different instruments, external environments, and physical conditions of samples. Model building using full spectrum is not ideal because of the data capacity and long modeling time.[Citation33,Citation34] Selecting the wavelength ranges for modeling can simplify the model and improve its performance. Modeling exhibited good performance when the correlation coefficients were used instead of the X-loading weights. Therefore, the wavelength range of 8700–4000 cm−1 was selected for the determination of GBTS.
Calibration and validation
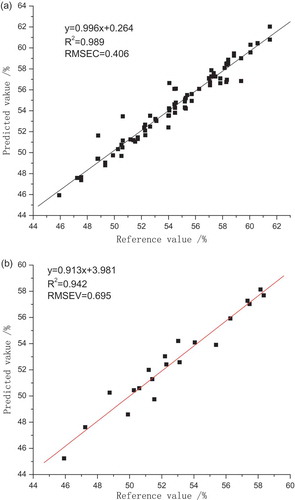
The PLS models for GBTS were developed with the most appropriate wavelength range and spectrum pre-treatments and then verified. The results are shown in . The model performed best when PC was 6. RC2 indicates the fitting degree, and RV2 reflects the validation capabilities of the models. The R2 values of the rapid quantitative model of total sugar are all greater than 0.9, demonstrating that the fitting and prediction capabilities are good.
Figure 3. Model in the calibration (a) and validation (b) sets.
Blind sample validation
The model was applied to predict the total sugar content of samples that were not involved in establishing the model, namely, the prediction set. Paired t test was employed between chemical measurements and infrared prediction to appraise the feasibility of using FT-NIR spectroscopy instead of the traditional chemical method (). P = 0.63 is more than 0.05 (confidence set = 95%), which shows that no significant difference exists between the model’s predicted values and chemical measurements (P > 0.05). In addition, the R2 and the standard error of the prediction for the blind set of samples were 0.908 and 0.974, respectively. FT-NIR spectroscopy is thus feasible for the rapid determination of GBTS.
Table 3. Prediction results of blind samples.
Conclusion
FT-NIR spectroscopy coupled with chemometrics was applied to identify the relationship between the spectral information and measured values of GBTS. To ensure accuracy and representativeness, 114 samples were collected from multiple areas in China. The absorption bands are often broad and lack a detailed structure required for analysis. Untreated spectra can be tractable and resolved with the practice of chemometrics data analysis.[Citation35] Pre-processing methods, including SNV, S-G D, S-G S, and N-G D, were utilised. X-loading weights and correlation coefficients were adopted to select EW properly, which is important in building an effective model. The PLS models, with pre-treatment spectra of Norris gap derivatives and EW of 8700–4000 cm−1 selected by correlation coefficients and PC of 6, possessed a satisfactory predictive ability because of RC2 of 0.989 and RV2 of 0.942. The blind sample validation results with paired t test imply that FT-NIR spectroscopy coupled with chemometrics has a good potential for the quantitative analysis of the total sugar of Goji berry.
Funding
The authors would like to thank the support from the Fundamental Research Funds for the Central Universities (QN 2013057).
Additional information
Funding
Related Research Data
References
- Amagase, H.; Farnsworth, N.R. A Review of Botanical Characteristics, Phytochemistry, Clinical Relevance in Efficacy and Safety of Lycium barbarum Fruit (Goji). Food Research International 2011, 44, 1702–1717.
- Bondia-Pons, I.; Savolainen, O.; Törrönen, R.; Martinez, J.A.; Poutanen, K.; Hanhineva, K. Metabolic Profiling of Goji Berry Extracts for Discrimination of Geographical Origin by Non-targeted Liquid Chromatography Coupled to Quadrupole Time-of-Flight Mass Spectrometry. Food Research International 2014, 63, 132–138.
- Potterat, O.;. Goji (Lycium barbarum and L-Chinense): Phytochemistry, Pharmacology and Safety in the Perspective of Traditional Uses and Recent Popularity. Planta Medica 2010, 76, 7–19.
- Wu, D.T.; Cheong, K.L.; Deng, Y.; Lin, P.C.; Wei, F.; Lv, X.J.; Long, Z.R.; Zhao, J.; Ma, S.C.; Li, S.P. Characterization and Comparison of Polysaccharides from Lycium barbarum in China Using Saccharide Mapping Based on PACE and HPTLC. Carbohydrate Polymers 2015, 134, 12–19.
- Yang, R.F.; Zhao, C.; Chen, X.; Chan, S.W.; Wu, J.Y. Chemical Properties and Bioactivities of Goji (Lycium barbarum) Polysaccharides Extracted by Different Methods. Journal of Functional Foods 2015, 17, 903–909.
- Zhao, R.; Jin, R.; Chen, Y.; Han, F.M. Hypoglycemic and Hypolipidemic Effects of Lycium barbarum Polysaccharide in Diabetic Rats. Chinese Herbal Medicines 2015, 7, 310–315.
- Gan, L.; Zhang, S.H.; Yang, X.L.; Xu, H.B. Immunomodulation and Antitumor Activity by a Polysaccharide-protein Complex from Lycium barbarum. International Immunopharmacology 2004, 4, 563–569.
- Liu, W.; Xu, J.; Zhu, R.; Zhu, Y.; Zhao, Y.; Chen, P.; Pan, C.; Yao, W.; Gao, X. Fingerprinting Profile of Polysaccharides from Lycium barbarum Using Multiplex Approaches and Chemometrics. International Journal of Biological Macromolecules 2015, 78, 230–237.
- Zhao, Q.; Dong, B.; Chen, J.; Zhao, B.; Wang, X.; Wang, L.; Zha, S.; Wang, Y.; Zhang, J.; Wang, Y. Effect of Drying Methods on Physicochemical Properties and Antioxidant Activities of Wolfberry (Lycium barbarum) Polysaccharide. Carbohydrate Polymers 2015, 127, 176–181.
- Zhao, J.H.; Li, H.X.; Xi, W.P.; An, W.; Niu, L.; Cao, Y.L.; Wang, H.; Wang, Y.; Yin, Y. Changes in Sugars and Organic Acids in Wolfberry (Lycium barbarum L.) Fruit during Development and Maturation. Food Chemistry 2015, 173, 718–724.
- Giordani, E.; Doumett, S.; Nin, S.; Del Bubba, M. Selected Primary and Secondary Metabolites in Fresh Persimmon (Diospyros kaki Thunb.): A Review of Analytical Methods and Current Knowledge of Fruit Composition and Health Benefits. Food Research International 2011, 44, 1752–1767.
- Zheng, H.W.; Zhang, Q.; Quan, J.P.; Zheng, Q.; Xi, W.P. Determination of Sugars, Organic Acids, Aroma Components, and Carotenoids in Grapefruit Pulps. Food Chemistry 2016, 205, 112–121.
- Medeiros, P.M.; Simoneit, B.R. Analysis of Sugars in Environmental Samples by Gas Chromatography–Mass Spectrometry. Journal of Chromatography A 2007, 1141, 271–278.
- Pan, L.; Zhu, Q.; Lu, R.; McGrath, J.M. Determination of Sucrose Content in Sugar Beet by Portable Visible and Near-Infrared Spectroscopy. Food Chemistry 2015, 167, 264–271.
- Rady, A.M.; Guyer, D.E. Evaluation of Sugar Content in Potatoes Using NIR Reflectance and Wavelength Selection Techniques. Postharvest Biology and Technology 2015, 103, 17–26.
- Dong, W.J.; Ni, Y.N.; Kokot, S. A Near-Infrared Reflectance Spectroscopy Method for Direct Analysis of Several Chemical Components and Properties of Fruit, for Example, Chinese Hawthorn. Journal of Agricultural and Food Chemistry 2013, 61, 540–546.
- Zhuang, H.; Ni, Y.N.; Kokot, S. A Comparison of Near- and Mid-infrared Spectroscopic Methods for the Analysis of Several Nutritionally Important Chemical Substances in the Chinese Yam (Dioscorea opposita): Total Sugar, Polysaccharides, and Flavonoids. Applied Spectroscopy 2015, 69, 488–495.
- Acri, G.; Testagrossa, B.; Vermiglio, G. FT-NIR Analysis of Different Garlic Cultivars. Journal of Food Measurement and Characterization 2016, 10, 127–136.
- Du, M.; Gong, Y.; Lin, Z.Z.; Shi, X.Y.; Hua, G.D.; Qiao, Y.J. Rapid Identification of Wolfberry Fruit of Different Geographic Regions with Sample Surfacenear Infrared Spectra Combined with Multi-class SVM. Spectroscopy and Spectral Analysis 2013, 33, 1211–1214.
- Shen, T.T.; Zou, X.; Shi, J.; Li, Z.; Huang, X.W.; Xu, Y.W.; Chen, W. Determination Geographical Origin and Flavonoids Content of Goji Berry Using Near-infraredspectroscopy and Chemometrics. Food Analytical Methods 2016, 9, 68–79.
- Tang, L.H.; Liu, D.H. Quantitative Analysis of Lycium barbarum L.Composition Based on near Infrared Spectrum. Modern Food Science and Technology 2013, 29, 2306–2310.
- Mehmood, T.; Liland, K.H.; Snipen, L.; Saebø, S. A Review of Variable Selection Methods in Partial Least Squares Regression. Chemometrics and Intelligent Laboratory Systems 2012, 118, 62–69.
- Höskuldsson, A.;. Variable and Subset Selection in PLS Regression. Chemometrics and Intelligent Laboratory Systems 2001, 55, 23–28.
- Jacobs, B.A.J.G.; Verlinden, B.E.; Bobelyn, E.; Decombel, A.; Bleyaert, P.; Van Lommel, J.; Vandevelde, I.; Saeys, W.; Nicolai, B.M. Estimation of the Prior Storage Period of Lamb’s Lettuce Based on Visible/Near Infrared Reflectance Spectroscopy. Postharvest Biology and Technology 2016, 113, 95–105.
- Zhang, W.L.; Li, N.; Feng, Y.Y.; Su, S.J.; Li, T.; Liang, B. A Unique Quantitative Method of Acid Value of Edible Oils and Studying the Impact of Heating on Edible Oils by UV-vis Spectrometry. Food Chemistry 2015, 185, 326–332.
- Wang, F.; Chen, D.; Shso, X.G. Research on the Nonlinear Model of near Infrared Spectroscopy and the Total Sugar of Tobacco Samples. Spectroscopy and Spectral Analysis 2002, 5, 23–26.
- Chen, J.Y.; Lyo, C.; Terada, F. Effect of Multiplicative Scatter Correction on Wavelength Selection for near Infrared Calibration to Determine Fat Content in Raw Milk. Journal Of Near Infrared Spectroscopy 2002, 10, 301–308.
- Liu, F.; He, Y.; Wang, L. Determination of Effective Wavelengths for Discrimination of Fruit Vinegars Using near Infrared Spectroscopy and Multivariate Analysis. Analytica Chimica Acta 2008, 615, 10–17.
- Min, M.; Lee, W.S. Determination of Significant Wavelengths and Prediction of Nitrogen Content for Citrus. Transactions of the Asae 2005, 48(2), 455–461.
- Lu, W.Z.; Yuan, H.F.; Xu, G.T.; Qiang, D.M. Modern Analytical Techniques in Near-Infrared Spectroscopy; China Petrochemical Press: Beijing, 2000.
- Kuligowski, J.; Carrión, D.; Quintás, G.; Garrigues, S.; De La Guardia, M. Direct Determination of Polymerised Triacylglycerides in Deep-frying Vegetable Oil by near Infrared Spectroscopy Using Partial Least Squares Regression. Food Chemistry 2012, 131, 353–359.
- Shenk, J.S.; Workman, J.J.; Westerhaus, M.O. Application of NIR Spectroscopy to Agricultural Products. Practical Spectroscopy Series 2001, 27, 419–474.
- Jiang, J.H.; Berry, R.J.; Siesler, H.W.; Ozaki, Y. Wavelength Interval Selection in Multicomponent Spectral Analysis by Moving Window Partial Least-squares Regression with Applications to Mid-infrared and Near-Infrared Spectroscopic Data. Analytical Chemistry 2002, 74(14), 3555–3565.
- Kamruzzaman, M.; ElMasry, G.; Sun, D.W.; Allen, P. Non-Destructive Prediction and Visualization of Chemical Composition in Lamb Meat Using NIR Hyperspectral Imaging and Multivariate Regression. Innovative Food Science & Emerging Technologies 2012, 16, 218–226.
- Guo, Y.; Ni, Y.; Kokot, S. Evaluation of Chemical Components and Properties of the Jujube Fruit Using near Infrared Spectroscopy and Chemometrics. Spectrochimica Acta. Part A, Molecular and Biomolecular Spectroscopy 2016, 153, 79–86.