
ABSTRACT
This study was conducted to quantitatively characterize the aroma strength of saffron, Crocus sativus L. (Iridaceae), using an electronic nose (e-nose). Thirty-three saffron samples from different geographical regions were prepared for the experiments. The aroma strength of the saffron samples was determined based on the ISO 3632 method as directly relates to safranal concentration. Multilayer Perceptron (MLP) and Radial Basis Function (RBF) neural network models were then applied for the prediction of
using sensor array responses of the e-nose sensors. Principal Components Analysis (PCA) was also utilized for aroma feature selection and then dimensionality reduction of sensor array data sets for improving the neural models was applied. The results revealed that in the improved MLP model with lower-dimension data, the prediction accuracy of
(R2 = 0.99, RMSE = 0.64) remained the same or slightly higher than the original model with higher-dimension data and also was better than those obtained using the RBF models. The overall results showed the suitability of e-nose as a nondestructive and online instrument for saffron aroma strength characterization.
Introduction
Saffron (Crocus sativus L.) quality is determined by its main chemical properties, including Crocins (C44H64O24), Picrocrocin (C16H26O7), and Safranal (C10H14O), which are responsible for colour, taste, and aroma, respectively.[Citation1] Based on the ISO 3632 standard, saffron aroma quality is evaluated by the amount of safranal using spectroscopy analysis.[Citation2] Safranal, the main volatile component of the essential oil, forms approximately more than 60% of the essential oil and 0.001–0.006% of the dry matter content.[Citation3–Citation5] Because conventional quality analysis techniques such as chromatography and spectroscopy are not suitable for the rapid and online quality characterization of saffron,[Citation6] in the last few decades new methods mimicking artificial senses and their fusion for in-process and real-time assessment of food products have been proposed.[Citation7–Citation10] As described in a report, it is possible to classify saffron samples based on their “aroma strength” from low to high aromatic quality.[Citation11] Authors extracted the aroma features of 11 saffron samples, which, after preprocessing, were utilized as the input data set for data analysis models. The final results showed that the e-nose system coupled with an artificial neural network model can strongly discriminate saffron samples based on their aroma strength. In the present study, a new technique for prediction of the aroma strength of saffron samples was developed by mimicking human experts using conventional techniques. The approach was to utilize an electronic nose (e-nose) system equipped with 11 metal oxide semiconductor (MOS) gas sensors to address the quantitative relationships between sensor array responses and saffron aroma strength by means of PCA, MLP, and RBF techniques based on the ISO standard. This approach has not been reported in the literature before.
Materials and methods
Saffron samples and chemicals
Thirty-three saffron samples including S1–S33 were procured from several prominent saffron-producing regions in Iran (). The samples cultivated during three years of production were obtained directly from producers with a guarantee of origin and freedom from adulteration. The samples were dried at room temperature under ventilated conditions and then refrigerated at 4°C (in the absence of light) before the experiments. One gram of each sample was taken for analysis. Pure safranal was used (Sigma–Aldrich Chemie GmbH 17306) to develop the safranal function curve.
Table 1. Safranal quantification for different saffron samples using UV–visible spectroscopy
Uv–Vis spectrophotometry analysis
According to the ISO 3632 standard, aqueous saffron extract samples were prepared.[Citation2] Then the spectral characteristics of the samples were monitored by scanning (from 200 to 700 nm) using a Cary 6o UV-Vis spectrophotometer (Agilent Technologies, Inc. USA) and utilizing Cary WinUV software. The maximum UV absorbance for the prepared samples in the 1 cm quartz cell and the maximum wavelength (about 330 nm) indicates the “aroma strength” corresponding to the amount of safranal compound recommended by ISO 3632 for saffron aroma quality characterization. The aroma strength can then be determined using the following equation:
Here : aroma strength; A: the absorbance at about 330 nm (maximum absorbance of safranal); m: mass of the saffron sample, in grams; and h: moisture and volatile content of the sample, expressed as a mass fraction: (initial mass-constant mass)/initial mass)* 100. Constant mass was calculated when 1 g of the powdered sample was placed uncovered in an oven set at 75°C for 48 h. It is worth mentioning that ISO3632 specifies saffron with aroma strength in the interval 20 <
<50 value.
E-nose setup
E-nose is an instrument designed to imitate the sense of smell and to discriminate among complex odours by means of an array of gas sensors.[Citation12] In this study, an e-nose system developed in our laboratory for saffron aroma characterization was utilized. It consisted of a sensor array comprising 11 selected gas sensors (TGS822, TGS813, TGS2602, TGS2611, TGS2610, and TGS2620 manufactured by Figaro Engineering, Inc. (Osaka, Japan) and MQ3, MQ6, MQ9, MQ136, and MQ137 sensors made by HANWEI Electronics Co. Ltd. (Henan, China)). These sensors were selected based on previous works for quality evaluation of some foods using the e-nose technique.[Citation13–Citation15] The objective of this research was, however, to evaluate the e-nose effectiveness for saffron aroma quality evaluation. In addition, a relative humidity sensor and a temperature sensor were installed inside the sensor chamber. Direct headspace sampling method and fresh air purging were utilized. The measurement process comprised two stages: (1) gas concentration and measurement, and (2) purging. Each saffron sample was placed in the e-nose chamber allowing the systems’ headspace to become saturated with the saffron aroma for 400 s. Steady-state sensor responses occurred at around 350 s and this time period was considered as the system response time. To achieve gas homogeneity in the headspace, internal air circulation was performed during this period.
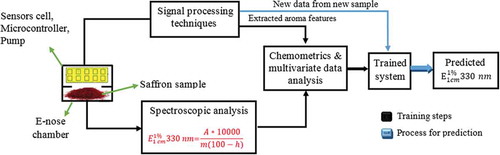
Data acquisition was conducted using a microcontroller device and a software program running on a laptop computer in 10 consecutive times (351–360 s). Eleven features were considered for each measurement and finally a rectangular data matrix (11*990) was organized as a raw database, i.e. 11 sensors (aroma features) *10 consecutive data for each sample*33 sample * 3 replications. During the experiments, air temperature and relative humidity of the chamber were maintained within 35–43°C and 5–10% RH, respectively. Because sensor signals are affected by changes in the chamber temperature and humidity, the chamber conditions must be kept constant during all the experiments. More details about the e-nose setup, the gas sensors, and signal processing are provided elsewhere.[Citation11] shows the schematic representation of the developed system.
Figure 1. Schematic representation of the developed technique for saffron aroma characterization.
Data analysis
To identify the aroma differences and to predict of the saffron samples, one unsupervised and two supervised pattern recognition models were used. Principal Components Analysis (PCA), an unsupervised model, is the best descriptor of differences between the samples and has been widely used in the literature to display a visualization of clusters and outliers of the e-nose response to odors.[Citation16] In addition, PCA helps determine which principal components extracted from the original variances contribute more to the differences. In this study PCA was utilized for aroma feature selection and dimensionality reduction of the data set, which provides qualitative information for pattern recognition models.
Multilayer Perceptron (MLP) and Radial Basis Function (RBF) neural network models, the supervised models, were developed to create predictor models using the aroma features. MLP was a feedforward artificial neural network model that maps sets of input data onto a set of appropriate outputs. In this model, the input layer of the network consisted of several neurons corresponding to aroma feature values. The output layer had one neuron representing
values. The original data matrix, 11* 990 data set, was randomly divided into 70%, 15%, and 15% portions to generate the training, validation, and test data sets, respectively. The trial-and-error approach was utilized to set the number of neurons in the hidden layer based on the root mean square error (RMSE) values. Tangent-sigmoid and linear transfer functions were applied in the hidden layer and the output layer, respectively. The Levenberg–Marquardt (trainlm) algorithm was utilized for error minimization.[Citation17]
The RBF network is a particular type of artificial neural network with feed-forward connectionist. RBF networks typically have three layers: an input layer, a hidden layer with a nonlinear RBF activation function, and a linear output layer. Although the structures of RBF and MLP networks are the same, their input–output mappings and training algorithms are fundamentally different. In the hidden layer, RBFs typically produce localized response to the input vector by means of a hybrid algorithm that employs a radially symmetric function such as the Gaussian function. Network output is a linear combination of the activation function in the hidden layer of the inputs and the neuron parameters (a straightforward supervised training) to predict the output variable in a way similar to MLP networks.[Citation18] The steps include: selecting the radial basis centres () using a clustering method, determining the spreads (
from the average distance between neighbouring cluster centres, and finally, output-layer training using the radial basis activations as regressors to predict the goal outputs.[Citation19] The spread default is set to 1; however, it can be varied to achieve the best final model results (by tracking R2 and RMSE). More details about these techniques are discussed elsewhere.[Citation18–Citation20]
One of the main problems of RBF and MLP network modelling is that more redundant or uncorrelated information in the input data set may decrease model accuracy or may result in over-fitting in the output layer.[Citation21] Owing to these problems, redundant data were eliminated from the data set in two times based on the PCA results (data sets were: total aroma features, total aroma features excluding the less-effective features, and only the more-effective aroma features). PCA analysis was performed using Unscrambler 10.4 software while MLP and RBF network analyses were performed using the MATLAB 7.14.0 software package.
Results and discussion
Uv–Visible spectroscopy analysis
First, a safranal calibration function was developed using spectroscopic analysis on six solutions (5–30 mg/L) of pure safranal. To determine the mean absorption of each sample, the prepared saffron extract samples were analysed three times using UV–Visible spectroscopy. Finally, by using the obtained safranal function and ISO3632 standard-based method, it was possible to determine the values as shown in . The
values of the saffron samples were sought as goals of the pattern recognition models.
Characterization of saffron aroma strength
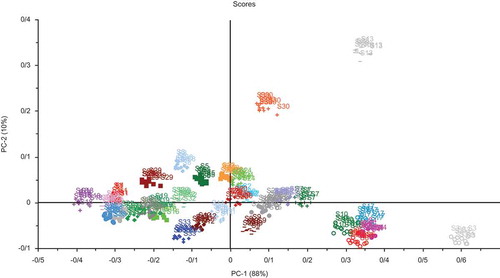
Principal Component Analysis (PCA): PCA was applied for describing the differences between the saffron samples, allowing visualization of the clusters, and for reducing the dimensionality of the data as well. Over 330 measurements performed with the e-nose (10 measurements for each sample) and by employing the PCA data set were transformed into two-dimensional (2D) coordinates. The 2D PCA score plot is given in , showing the mean centre of each cluster. In the 2D figure of PCA, the horizontal and vertical axes showed the contribution rates of the two main components (PC1 and PC2). These two components contain 98% of the data variance (PC1 explains 88% of the total variation, while 10% of the total variance is explained by PC2). Since PC3 described only the remaining 2% of the data set, it was removed. As shows, the proposed method was able to detect a clear difference in the aroma fingerprint of nearly all the tested samples.
Figure 2. PCA score plot for the characterization of 33 saffron samples having different aroma strengths.
The PCA loading plot shows the relative contribution of the aroma features used (here the signal of gas sensors) to each PC as shown in , illustrating the loading factors related to PC1 and PC2 for each sensor. Sensors associated with less loading factors for a particular component have a low contribution to the total response, while a discriminating sensor indicates high values.
Figure 3. Relative contribution of the used aroma features to each PC (the loading plot).
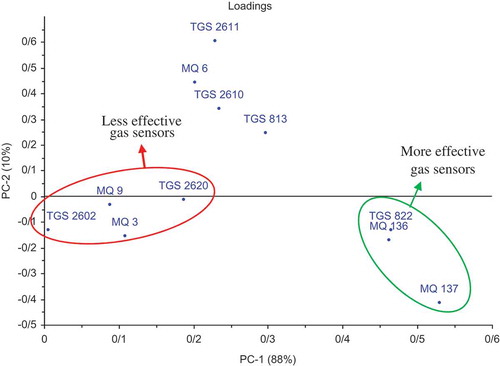
The sensors having little influence on the identification process should be removed from the array because of their non-positive influence on the data processing. Increasing the amount of data could lead to: over-fitting in the data analysis, additional computation time, and higher fabrication cost of the e-nose system.[Citation22] As seen in , TGS-822, MQ-137, and MQ-136 sensors play a considerable role in saffron aroma tracking, while MQ-3, MQ-9, TGS-2620, and TGS-2602 sensors exhibit minor influence. This behaviour was also observed in a previous study on the aroma-based quality classification of 11 saffron samples, which is confirmed here for 33 samples.[Citation11] These results illustrate a clear path for developing pattern recognition models.
MLP analysis for the prediction of : The MLP networks were trained with three data sets (the input layer containing: 1 – all the aroma features; 2 – all the aroma features excluding the less-effective ones; and 3 – only the more effective features) based on the PCA results. Results of this analysis and the correlation between the actual and predicted values of
are depicted in – (models A–C). Each training state was performed three times and finally the average values of R2 and RMSE were calculated.
Figure 4. MLP model A-correlations between the predicted and actual values, from left to right: training, validation, and test sets (data of all the aroma features with 30 neurons in the hidden layer).
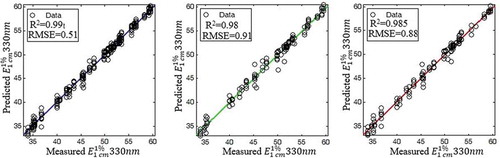
Figure 5. MLP model B-correlations between the predicted and actual values, from left to right: training, validation, and test sets (all the aroma features excluding the less-effective ones and 30 neurons in the hidden layer).
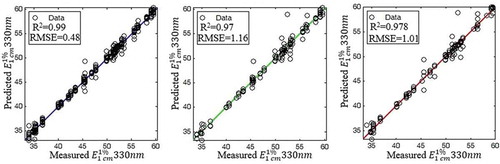
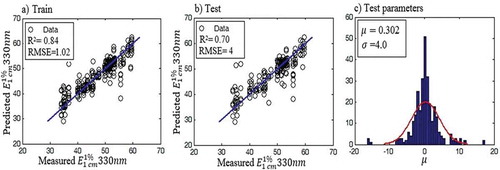
Figure 6. MLP model C-correlations between the predicted and actual values, from left to right: training, validation, and test sets (only the more effective aroma features with 30 neurons in the hidden layer).
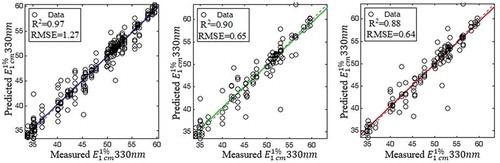
It can be seen that the model utilizing all the aroma features (, model A) is more accurate than that utilizing only the more effective aroma features (, model C). , model B shows that when the less-effective aroma features were removed from the total data set, the MLP model accuracy was slightly diminished. Therefore, it was decided to test increasing the number of neurons in the hidden layer of model B from 30 to 60 in 10 neuron increments. The final results are shown in , as model D, and it can be seen that the accuracy of the developed model having 50 neurons in the hidden layer yields better results (R2 = 0.99 and RMSE = 0.64) than model A. A similar procedure was performed for model C, but no more accurate results were obtained.
Figure 7. MLP model D- correlations between the predicted and actual values, from left to right: training, validation, and test sets (data from MOS sensors excluding the less-effective sensors and 50 neurons in the hidden layer).
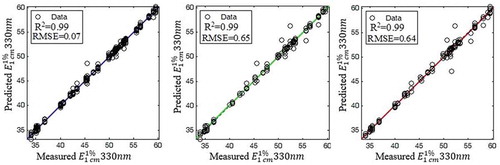
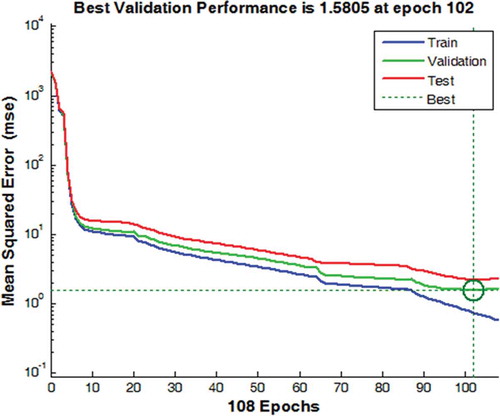
It could be concluded that by increasing the hidden-layer neurons of model A, more accurate results will be achieved. Model B is simpler and more economical due to having fewer MOS sensors. shows the training, validation, and test performance of model D. It can be concluded that these processes have performed accurately without over-fitting in the output layer.
Figure 8. Training, validation, and test performance of the MLP model D.
RBF analysis for prediction of 
The developed RBF networks were trained with the three data sets (used in models A–C) and the “newrb” function was implemented in the MATLAB software. The function newrb iteratively creates a radial basis network by adding one neuron at a time. At first, the default setting, i.e. 1, was used for the spread parameter of the RBFs and then it was varied. The best performance was achieved with the spread set at 0.4. Neurons are added to the network until the sum-squared error falls below an error goal (the goal was set at zero) or a maximum number of neurons has been reached (here 600 neurons). The output layer consisted of one neuron corresponding to . The RBF results and the correlation between the actual and predicted
values are shown in – (models E–G). Each training state was performed three times and the average R2 and RMSE values were calculated.
Figure 9. RBF model E, correlations between the predicted and actual (data of all the aroma features).
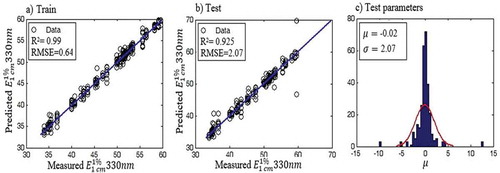
Figure 10. RBF model F, correlations between the predicted and actual (all aroma features excluding the less-effective ones).
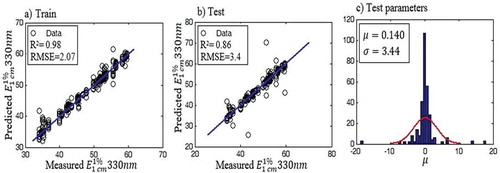
Figure 11. RBF model G, correlations between the predicted and actual (only the more-effective aroma features).
The above results show that the developed RBF neural networks, especially the all-inclusive one, can predict the with reasonable statistical indices (R2 = 0.925 and RMSE = 2.7), but no more accurate than those obtained by the MLP models. It seems that the tangent-sigmoid function utilized in the MLP hidden-layer neurons is more robust than the RBFs for mapping aroma features to
. In the previous work aimed at saffron aroma-based classification, some linear models such as Partial Least Squares (PLS) and Multiple Linear Regression (MLR) were tested and the results were less accurate than the MLP model.[Citation11]
Conclusion
This study attempted to establish an original approach for the quantitative characterization of saffron aroma strength using an e-nose. Eleven aroma features of 33 saffron samples of different geographical regions were picked up using a developed e-nose system. The aroma strength of the tested samples was calculated based on ISO standards. PCA was utilized to determine which aroma features (sensors) contribute more to clustering of the saffron samples. In addition, two nonlinear supervised models, MLP and RBF neural networks, were applied for mapping the aroma features to aroma strength. Their final results were compared and it was concluded that the developed e-nose system coupled with the improved MLP model (model D) can predict the values of saffron samples using sensor array responses of the e-nose with good accuracy (R2 = 0.99, RMSE = 0.64). These results also showed that the aroma parameters are proper predictors for nondestructive and online saffron aroma-quality characterization.
Related Research Data
References
- Maggi, L.; Carmona, M.; Zalacain, A.; Kanakis, C.; Anastasaki, E.; Tarantilis, P.A.; Polissiou, M.G.; Alonso, G.L. Changes in Saffron Volatile Profile according to Its Storage Time. Food Research International 2010, 43(5), 1329–1334.
- ISO 3632-2. Saffron (Crocus sativus L.): Test Methods (2003 Revised 2011); International Standards Organization: Switzerland: Geneva, 2011.
- Roedel, W.; Petrzika, M. Analysis of the Volatile Components of Saffron. Journal High Researcher Chromatographic 1991, 14, 771–774.
- Tarantilis, P.A.; Polissiou, M.G. Isolation and Identification of the Aroma Components from Saffron (Crocus sativus). Journal Agricultural Food Chemical 1997, 45, 459–462.
- Maggi, L.; Carmona, M.; Del Campo, C.P.; Kanakis, C.D.; Anastasaki, E.; Tarantilis, P.A.; et al. Worldwide Market Screening of Saffron Volatile Composition. Journal of the Science of Food and Agriculture 2009, 89, 1950–1954.
- Kiani, S.; Minaei, S.; Ghasemi-Varnamkhasti, M. Application of Electronic Nose Systems for Assessing Quality of Medicinal and Aromatic Plant Products: A Review. Journal of Applied Research on Medicinal and Aromatic Plants 2016a, 3(1), 1–9.
- Banerjee (Roy), R.; Chattopadhyay, P.; Tudu, B.; Bhattacharyya, N.; Bandyopadhyay, R. Artificial flavor Perception of Black Tea Using Fusion of Electronic Nose and Tongue Response: A Bayesian Statistical Approach. Journal of Food Engineering 2014, 142, 87–93.
- Yang, S.; Xie, S.; Xu, M.; Zhang, C.; Wu, N.; Yang, J.; Zhang, L.; Zhang, D.; Jiang, Y.; Wu, C. A Novel Method for Rapid Discrimination of Bulbus of Fritillaria by Using Electronic Nose and Electronic Tongue Technology. Analytical Methods 2015, 7(3), 943–952.
- Xu, M.; Yang, S.L.; Peng, W.; Liu, Y.J.; Xie, D.S.; Li, X.Y.; Wu, C.J. A Novel Method for the Discrimination of Semen Arecae and Its Processed Products by Using Computer Vision, Electronic Nose and Electronic Tongue; Evidence-Based Complementary and Alternative Medicine, 2015(2015), 1–10. http://www.hindawi.com/journals/ecam/aip/753942/
- Chen, Q.; Zhang, Z.; Pan, W.; Ouyang, Q.; Li, H.; Urmila, K.; Zhao, J. Recent Developments of Green Analytical Techniques in Analysis of Tea’s Quality and Nutrition. Trends in Food Science & Technology 2015, 43, 63–82.
- Kiani, S.; Minaei, S.; Ghasemi-Varnamkhasti, M. A Portable Electronic Nose as an Expert System for Aroma-Based Classification of Saffron. Chemometrics and Intelligent Laboratory Systems 2016b, 156(15), 148–156.
- Ghasemi-Varnamkhasti, M.; Mohtasebi, S.S.; Siadat, M.; Ahmadi, H.; Razavi, S.H. From Simple Classification Methods to Machine Learning for the Binary Discrimination of Beers Using Electronic Nose Data. Engineering in Agriculture, Environment and Food 2015, 8(1), 44–51.
- Dutta, R.; Hines, E.L.; Gardner, J.W.; Kashwan, K.R.; Bhuyan, A. Tea Quality Prediction Using a Tin Oxide-Based Electronic Nose: An Artificial Intelligence Approach. Sensors and Actuators B: Chemical 2003, 94, 228–237.
- Carmona, M.; Martínez, J.; Zalacain, A.; Rodríguez-Méndez, M.L.; De Saja, J.A.; Alonso, G.L. Analysis of Saffron Volatile Fraction by TD-GC-MS and E-Nose. European Food Research and Technology 2005, 223, 96–101.
- Sanaeifar, A.; Mohtasebi, S.S.; Ghasemi-Varnamkhasti, M.; Ahmadi, H. Application of MOS Based Electronic Nose for the Prediction of Banana Quality Properties. Measurement 2016, 82, 105–114.
- Li, S.; Li, X.; Wang, G.; Nie, L.; Yang, Y.; Wu, H.; Wei, F.; Zhang, J.; Tian, J.; Lin, R. Rapid Discrimination of Chinese Red Ginseng and Korean Ginseng Using an Electronic Nose Coupled with Chemometrics. Journal of Pharmaceutical and Biomedical Analysis 2012, 70, 605–608.
- Shafiee, S.; Minaei, S.; Moghaddam-Charkari, N.; Barzegar, M. Honey Characterization Using Computer Vision System and Artificial Neural Networks. Food Chemistry 2014, 159, 143–150.
- Scott, S.M.; James, D.; Ali, Z. Data Analysis for Electronic Nose Systems. Microchimica Acta 2007, 156, 183–207.
- Gutierrez-Osuna, R.;. Pattern Analysis for Machine Olfaction: A Review. IEEE Sensors Journal 2002, 2(3), 189–202.
- Patel, H.K.;. The Electronic Nose: Artificial Olfaction Technology; Biological and Medical Physics, Biomedical Engineering, Springer India, DOI:10.1007/978-81-322-1548-6.
- Zou, H.-Q.; Li, S.; Huang, Y.-H.; Liu, Y.; Bauer, R.; Peng, L.; Tao, Q.; Yan, S.-R.; Yan, Y.-H. Rapid Identification of Asteraceae Plants Improved RBF-ANN Classification Models MOS Sensor E-Nose; Evidence-Based Complementary and Alternative Medicine, 2014, 2014, 1–6. DOI:10.1155/2014/425341
- Ghasemi-Varnamkhasti, M.; Mohtasebi, S.S.; Siadat, M.; Razavi, S.H.; Ahmadi, H.; Dicko, A. Discriminatory Power Assessment of the Sensor Array of an Electronic Nose System for the Detection of Nonalcoholic Beer Aging. Czech Journal Food Sciences 2012, 30(3), 230–236.