
ABSTRACT
This study was conducted to evaluate bio-chemical composition, functional, and rheological properties of croaker fish (Johnius dussumieri), Indian squid (Loligo duvaucelii), and white leg shrimp (Litopenaeus vannamei) in fresh condition. The n-3 fatty acids were slightly higher in croaker fish (14.91 %) compared to that in Indian squid (13.59 %) and white leg shrimp (13.02 %). The solubility and viscosity of croaker fish proteins were significantly (p < 0.05) lower as compared to shrimp and squid proteins, while the emulsion capacity was higher for squid proteins. The histological study of squid muscles revealed a unique and strong arrangement of myofibrils. Dynamic viscoelastic behaviour of fresh meat of croaker fish and white leg shrimp revealed that transition from sol to gel took place between 48°C to 65°C and 39.93°C to 64.30°C, respectively, while in case of Indian squid, gel formation (increase in G’) progressed mainly in two steps: the first step at low temperature range of 5–28.41°C and the second step over 45°C. Along with this, gel breakdown occurred in the range of 28–45°C. Our study suggested that the temperature range for sol to gel transformation differs from species to species considerably and hence, a specific temperature range may be determined to have maximum gelling ability for every fish species used as raw material for gel-based formulations.
Introduction
Seafood is recognised as a good source of affordable protein and delicacy around the world. Seafood includes different kind of finfish and shellfish species offering a variety of choices, and each one of them is different from others in taste, keeping quality and amenability to industrial processing. These variations are related to the fact that the seafood is drawn from a wide range of phyla of the animal kingdom like mollusc to crustacean to chordates, that is, from both invertebrates and vertebrate. Not only their niche, but also their entire constitution differs. Therefore, the approach towards utilisation of the proteins should also be specific to the sources of proteins, their type, and characteristics. It has been established that lipid content and proportion of different fatty acid groups in fish vary according to their feeding habit and environment they dwell-up.[Citation1,Citation2] The composition of the proteins from fish, mollusc, and crustacean are different and behave differently during processing. Even gutted and non-gutted fish keeping quality differs during storage.[Citation3] The most important proteins that determine the functionalities are myofibrillar proteins.
Finfish and shellfish contain a large amount of proteins and are consumed in different forms like raw, processed, and semi-processed. Particularly, the myofibrillar proteins are separated to make gel-based products. Gelation is one of the very important properties studied for fish and shellfish proteins to evaluate their qualities as well as behaviours. The myofibrillar proteins constitute the largest fraction of proteins in fish and shellfish, which is responsible for the gelation. During gelation process, the protein undergoes sol-gel transformation. The dynamic rheological measurements are very useful tool for monitoring the sol-gel transitions and characterising the viscoelastic behaviour of gelled system in the linear region with small distortion.[Citation4] Formation of actomyosin from two myofibrillar proteins actin and myosin is responsible for gelation and has an important role in defining the texture and processing characteristics of meat products.[Citation5] To understand the process of degradation, aggregation, and rheological properties of actomyosin, fish species from cold, temperate, and warm waters have been studied.[Citation6] The dynamic viscoelastic behaviour of fresh actomyosin from green mussel[Citation7] and fresh bigeye snapper fish (Priacanthus hamrur) mince[Citation8] also has been studied. It is now established that unlike fish species with excellent heat induced gel forming properties, cephalopod muscle proteins aggregate by heating, but the resulting structure is highly disorganised, leading to poor elasticity and low gel strength.[Citation9] The rheological properties of fish meat gels depend upon factors such as fish species, quality of the meat, salt content, protein concentration, and processing methods. Attempts have been made to study the rheological properties of squid meat,[Citation10] ribbon fish meat,[Citation11] threadfin bream,[Citation12] tuna myofibrillar protein,[Citation13] and actomyosin from cold, temperate, and warm water fishes.[Citation6] However, these studies were conducted with differing extraction methods and experimental conditions. There is no literature available on comparison of biochemical, functional, and dynamic viscoelastic properties among a mollusc, a crustacean, and a vertebrate, that is, among squid, shrimp, and fish. The present study was undertaken to get an insight in to the differences in biochemical, functional, and dynamic viscoelastic properties among these categories of animals such as fish, squid, and shrimp in fresh condition.
Materials and methods
Materials
Croaker fish (Johnius dussumieri), Indian squid (Loligo duvaucelii), and shrimp (Litopenaeus vannamei) were used in the study. Croaker fish and Indian squid were purchased from the boat owners who go for single day fishing soon after they arrived at Versova landing centre in the North West part of Mumbai, India, while shrimp was purchased from cultured pond in Raigarh district of Maharashtra, India. The above said table-sized experimental animals were transported to the laboratory in iced condition in poly-urethane boxes. Appropriate amount of samples (croaker fish, Indian squid, and shrimp) were taken and dressed (removal of head, viscera, shell, and fins) for sampling. The meat was separated manually from fins, skin, and bones. The separated meat was macerated well using pestle and mortar in ice bath and used for further analyses.
Proximate composition
The proximate composition analysis (moisture, crude protein, fat, and ash content) of fresh meat was carried out using standard methods of AOAC.[Citation14] Non-protein nitrogen content was determined by the method as described by Velanker and Govindan.[Citation15]For determining the pH, About 5 g of meat sample was macerated with 45 mL of distilled water, and the pH of slurry was measured by using pH meter (Systronix µ pH system 361). Before measuring the pH of the sample, pH meter was calibrated with standard buffer solutions of pH 4.0, 7.0, and 9.2. Yield values were determined as per the prevalent consumer preference.
Fatty acid analysis
Total lipids were extracted from croaker fish, Indian squid, and white leg shrimp according to Folch et al.[Citation16] fatty acid content and fatty acid composition determined simultaneously in the extracted oil samples. Fatty acid analysis was performed in triplicate that consisted two consecutive steps, preparation of fatty acid methyl ester (FAME) and chromatographic analysis. The AOAC method was followed to esterify the lipid extract. Gas chromatography–mass spectrometry (GC-MS) was performed on Shimadzu Qp2010 quadrupole Gas Chromatography Mass Spectrometer (GC-MS) instrument equipped with a carbowax (30 m × 0.25 mm ID; 0.25ìm film thickness) capillary column (Cromlab S.A). Individual components were identified using mass spectral data and by comparing retention time data with those obtained for authentic and laboratory standards. Peak area was quantified and expressed as percentage of total fatty acids.
Preparation of myofibrillar proteins from experimental fish, squid, and shrimp
The myofibrillar protein fraction was extracted according to the method of Hashimoto et al.[Citation17] with slight modifications. About 10 g fresh meat from croaker fish, Indian squid, and white leg shrimp was homogenised in 100 mL of ice-cold phosphate buffer, pH 7.5 (15.6 mM Na2HPO4, 3.5 mM KH2PO4) using a homogeniser (Polytron Kinematica, Switzerland). The homogenisation process was carried out at 10000 rpm for 1 min with 6 intermissions of 10 sec each. The resulting homogenate was centrifuged at 5000 × g at 4°C for 15 min using a CR21GIII refrigerated centrifuge (Hitachi, Japan). The supernatant was discarded, while the pellet was collected and resuspended in 10 volumes of ice-cold phosphate buffer, homogenised and centrifuged at 4°C again. After two repeated cycles of homogenisation and centrifugation, the resulting MFP pellet was suspended in 10 volumes of ice-cold 50 mM phosphate buffer of pH 7.5 containing 1.1 M KCl (pH value was adjusted with stock acid or base when necessary). This buffer containing 1.1 M potassium chloride is from here onwards referred as extraction buffer. The mixture was homogenised and centrifuged at 5000 × g for 15 min at 4°C. After the centrifugation clear supernatant was used as myofibrillar protein (MFP) solution, extracted MFP content was estimated by biuret method[Citation18] using bovine serum albumin as a standard.
Protein solubility
The solubility of MFP pellet prepared from croaker fish, Indian squid, and white leg shrimp was determined using phosphate buffer (15.6 mM Na2HPO4, 3.5 mM KH2PO4, containing 1.1 M Potassium chloride, and pH 7.5). The MFP pellet was homogenised in phosphate buffer at 9000 rpm for 2 min with the help of laboratory homogeniser and then centrifuged (9000 × g) at 4ºC for 15 min. The pellet homogenate before centrifugation and the supernatant obtained after the centrifugation were analysed for the amount of soluble proteins by biuret method.[Citation18]The MFP solubility was calculated as follows:
Apparent reduced viscosity
The apparent reduced viscosity of MFP extracted from croaker fish, Indian squid, and white leg shrimp was determined by the method as described by Binsi et al.[Citation19] The apparent reduced viscosity was determined using Ostwald viscometer with a capillary diameter of 0.5 mm. The temperature during measurement of viscosity was 25ºC ± 0.5ºC. The MFP prepared in chilled condition was equilibrated to 25ºC using water bath, and 10–12 mL was loaded to viscometer. The time taken for protein solution to travel between two points was recorded with the help of stop watch. The experiment was repeated three times, and average flow time (in second) was taken for calculation. The relative viscosity () was determined by noting the time taken for protein solution and the solvent separately. The relative viscosity at different protein concentration was determined, and reduced viscosity (ηred) was calculated using an equation given by Yang.[Citation20]
where t1 is time taken for MFP solution (s), t0 is time taken for solvent (phosphate buffer) (s), and C is concentration of protein (mg/mL). A plot of ηred viscosity vs MFP concentration was obtained, and ηred viscosity at single MFP concentration (5 mg/mL) was derived from the plot.
Water holding capacity
The WHC for fresh samples was measured according to the method as described by Jauregui et al.[Citation21] with slight modification. Meat sample of 5 g was weighed and put between two layers of filter paper (Whatman No. 1). The sample was placed at the bottom of 50 mL centrifuge tubes and centrifuged at 5000 × g for 10 min at 4°C. Immediately after centrifugation, the sample was removed and reweighed. WHC was calculated as follows:
Where W1 is the initial weight (g), and W2 is the final weight. The average of three replicates was reported as value of WHC.
Emulsion capacity
Emulsion capacity (EC) of MFP extracted from croaker fish, Indian squid, and white leg shrimp was determined according to the method of Swift et al.[Citation22] with slight modification. About 12.5 g of MFP solution, 37.5 mL of chilled phosphate buffer and 50 mL of refined sunflower oil were added and homogenised at 9000 rpm for 10 sec using homogeniser (Polytron Kinematica, Switzerland) as dispersing tool. Homogenisation was kept continued at high speed (23000 rpm) with addition of oil at the rate of 0.5–0.6 mL/sec until visual phase inversion was recorded. Emulsion capacity was calculated from total volume of oil added till phase inversion including the initial 50 mL and was expressed as mL of oil per mg of MFP. Average of three replicates was reported as emulsion capacity values.
Histological observations
Histological studies of croaker fish, Indian squid, and white leg shrimp were carried out as described by Ando et al.[Citation23] with a slight modification. The muscle samples were drawn from the dorsal side of the experimental species. Samples were prepared by cutting into a cube (4 × 4 × 4 mm) with a sharp razor blade. The samples were preserved in 10% neutral formalin buffer solution for 24 h at room temperature. After dehydration by serial concentration of (70–100 %, v/v) ethanol, fish samples were embedded in paraffin. Thin sections (2 mm thick) were prepared by a microtome and stained with Mallory’s trichrome staining solution (a mixture of 20 g/L of orange G, 5 g/L of methyl blue, and 20 g /L of oxalic acid). The micro-structure was visualised using a light microscope (Carl Zeiss, Jena, Germany) under high power objective.
Gel forming ability
Gel forming ability was determined by the method as described by Mehta et al. 2014.[24]
Gel preparation
About 300 g of separated meat from croaker fish, Indian squid, and white leg shrimp was macerated using pestle and mortar in chilled condition (4–5ºC) with 2.5% sodium chloride. To maintain temperature (< 5°C), maceration was performed by putting mortar in ice bath. The time of maceration was 10 min. After maceration about 100 g of viscous minced meat was stuffed into krehalon casing of 50mm × 250mm (dia × length) using hand stuffer. One end of casing was sealed prior to stuffing, and the other end of casing was sealed after stuffing. The stuffed casings were heat processed at 90ºC for 45 min in a water bath and cooled in chilled water for 15 min. The prepared gels were kept at 4ºC in a refrigerator for 24 h and were used for the gel strength measurement.
Measurement of gel strength
The gel strength was measured using Texture Analyser (TA. XT2i Stable Micro System, Surrey, England). The prepared gels were brought to room temperature and cut into 25 mm × 30 mm (dia × length) and placed on the platform. A 5 mm spherical probe was used for measurement. A trigger force of 10 g and distance of 20 mm were programmed in the instrument. During the measurement, spherical probe pierces the gel to a distance of 20 mm, and the peak load exerted by the instrument was recorded. The gel strength was calculated by multiplying the peak load (g) × programmed distance (mm). Gel strength of the sample was expressed in g.cm. The average of three replicates was reported as gel strength of sample.
Instrumental texture profile analysis
The TPA was performed for the heat induced gel prepared from croaker fish, Indian squid, and white leg shrimp by Texture Analyser mentioned above using a 75 mm compression plate with 50 kg load cell. The gels were cut into the 30 mm size using local size cutter and subjected for analysis. The texture parameters measured include hardness, cohesiveness, springiness, gumminess, and chewiness.
Dynamic viscoelastic behaviour
Sample preparation
Fresh minced meat obtained from croaker fish, Indian squid, and white leg shrimp was used for the assessment of dynamic viscoelastic properties. The mincemeat used for analysis was devoid of fin, scale, bone, and skin. The meat was macerated well using pestle and mortar manually. To maintain temperature (<5°C), maceration was performed by putting mortar in ice bath. After making homogeneous paste, 2.5% sodium chloride was added, and maceration was done for another 5 min. The total time of maceration was 10 min.
Determination of dynamic viscoelastic properties
Dynamic viscoelastic properties were performed on a Physica MCR 101 rheometer (Anton Paar, Germany) in oscillatory mode. A 20 mm parallel steel probe geometry with a 1 mm gap (between peltier plate and probe) was used, and the sample was surrounded by a liquid paraffin to prevent drying. The sample was heated at a rate of 1°C/min from 5°C to 90°C. The oscillation stress was 0.6 Pa, and the oscillation frequency was 0.1 Hz. Elastic modulus G’), viscous modulus (G”), and tan delta (δ) were recorded.
Statistical analysis
The data obtained were analysed by one-way analysis of variance (ANOVA) using SPSS 16.0 software.
Results and discussion
The crude protein content of croaker fish was 15.40%, which is slightly less than reported for other croaker species (Pseudotolithus typus).[Citation25] The protein content of squid and white leg shrimp meat was 14.20% and 20% respectively, which were more or less similar to that obtained for other squid[Citation26,Citation27] and shrimp species.[Citation28,Citation29] The fat content was higher in white leg shrimp (1.80%) than that in croaker fish (1.30%) and Indian squid (0.70%). The proximate composition of croaker fish indicates moisture content of 81.40%. The high moisture content (81.40%), relatively good amount of proteins, and low fat content (1.28%) categorise croaker as lean fish. The ash content was 1%, which was expectedly low as meat was devoid of fins and bones. The proximate composition of croaker fish was in the ranges that were obtained after analysing 23 marine fishes, which revealed that the average moisture, protein, fat, and ash content ranged from 67.23 to 80.48%, 15 to 20% (majority of fishes), 0.24 to 14.72 and < 2% (87% of fishes), respectively.[Citation30] In our study, the proximate composition obtained for white leg shrimp was within the range that is reported for other shrimp species like brown shrimp (Crangon crangon), Fenneropenaeus indicus.[Citation28,Citation29,Citation31,Citation32]
The NPN content in fresh meat of croaker fish, Indian squid, and white leg shrimp was 26% (641 mg/100 g meat), 13.66% (310 mg/100 g meat), and 9.46% (298 mg/100 g meat) of total nitrogen, respectively (). Dileep et al.[Citation11] also reported high content of NPN (23%) in fresh meat of ribbon fish. The pH of fish flesh has an important influence on its tendency to deteriorate because of its control on bacterial growth.[Citation33] However, an animal’s nutritional stage and high stress or exercise levels before an animal’s death modify the glycogen concentration stored in muscle, consequently influencing in the post mortem pH.[Citation34,Citation35] In the present study, the pH for croaker fish was significantly (p < 0.05) higher (7.29) than squid and white leg shrimp fresh meat (). The higher amount of the non-protein nitrogen substances () found in the croaker fish meat was possible because of the higher pH in croaker fish compared to that in squid and shrimp. In the present study, the pH value of experimental shrimp is slightly lower than that of reported for other shrimps.[Citation36,Citation37]
Table 1. Proximate composition, physico-chemical, and functional characteristics of fresh meat obtained from croaker fish, Indian squid, and white leg shrimp.
Yield of edible portion of croaker fish, Indian squid, and white leg shrimp
The yield of edible portions and meat from the experimental species were estimated and presented in . The edible portion yield is the key information for commercial purpose and also for a consumer to make decision before buying the fish. Therefore, the yield percentages were obtained in three different stages as per common consumption pattern of different consumers. Given the whole edible parts, croaker fish had higher yield than other two experimental species. The yields of mincemeat, edible portion without head, and edible portion with head from croaker fish were 37%, 58%, and 75.50% of the total weight of the fish, respectively (). However, the obtained values were lower than those reported for the Black Sea trout fish (64.18 %)[Citation38] and tiger tooth croaker (68.18% fillet and deskinned meat).[Citation39] In the present investigation, yield value of white leg shrimp was 53% (peeled and deveined) which was higher than that of reported for fresh water prawn (41.13%).[Citation40] The yield of edible parts of Indian squid was 64% which was found in the range that was reported for oceanic and inshore squid species (60–80%).[Citation41]
Table 2. Yield in different form of fresh croaker fish, Indian squid, and white leg shrimp.
Fatty acid profile of croaker fish, Indian squid, and white leg shrimp
It was observed that the fatty acid composition of total lipids varied greatly in the muscle of all three experimental species (). In all three experimental species, C:16 (palmitic acid) was the dominant saturated fatty acid. The highest saturated fatty acid (SFA) content was found in croaker fish, whereas monounsaturated fatty acid (MUFA) content was more in white leg shrimp. In the present study, the major portion of the fatty acids of croaker fish, Indian squid, and white leg shrimp was constituted by saturated fatty acids (), which was much higher compared to several commercially important fish species from the Sinop region of the Black Sea.[Citation42] The differences in fatty acid composition may be influenced by environmental and nutritional conditions.[Citation43] In the present study, among SFA, palmitic acid (C16; 49–51% of total fatty acids) was the major saturated fatty acid, while among MUFA, the oleic acid was the main component in all experimental species.
Table 3. Fatty acid profiles of fresh meat obtained from croaker fish, Indian squid, and, white leg shrimp.
Polyunsaturated fatty acid (PUFA) contents in croaker fish and Indian squid were almost similar (18–20%), while the content was 14.55% of total fatty acids in white leg shrimp (). The nutritionally important PUFA content of all experimental species was less than that reported for wild (56.83%) and farmed (36.39%) blackspot seabream.[Citation44] The n-3 fatty acids, that is, Eicosapentaenoic acid (EPA) and docosahexaenoic acid (DHA), were found in the perceptible quantity (13–15% of the total fatty acids) in all experimental species. In case of croaker fish, DHA (11.36% of the total fatty acids) was the prominent fatty acid among the n-3 fatty acids, while EPA (9.96% of the total fatty acids) was higher in white leg shrimp. The DHA and EPA contents were almost similar in Indian squid (). The n-3 and n-6 fatty acids in Lagocephalus lunaris and Lagocephalus inermis (puffer fish) were 31.17% and 31.19%, while n-6 PUFA were 7.26% and 7.29%, respectively.[Citation45] EPA and DHA display several properties which are beneficial for human health. In addition to reducing the risk of some cardiovascular diseases[Citation46] and cancers,[Citation47] they also can improve various functions in the human organs.[Citation48] Though all the three experimental species had low fat contents, the fatty acid profile indicated that they carry reasonably good proportion of PUFA.
It is suggested that the dietary intake of food with a high ratio of n-3/n-6 would be beneficial. FAO experts have recommended that the ratio of n-3/n-6 in the diet should be higher than 0.2,[Citation49] while UK Department of Health recommends it to be higher than 0.25.[Citation50] In the present study, the ratios in the fat extracted from croaker fish, Indian squid, and white leg shrimp were 3.11, 2.76, and 8.51, respectively (). In all experimental species, the ratio is well above the recommended levels, suggesting the goodness of the fats in these species. The ratios documented in the present study for croaker fish and Indian squid were more than that reported for many fresh water fishes like rohu (1.04) pangas (0.74), and magur (0.70)[Citation51] but lower than wild blackspot seabream (4.46)[Citation44] and catla (6.54).[Citation51] Hence, it can be concluded that croaker fish, Indian squid, and white leg shrimp are excellent sources of n-3 fatty acids, thereby adding to their value as species of commercial and nutritional importance.
Histological measurement
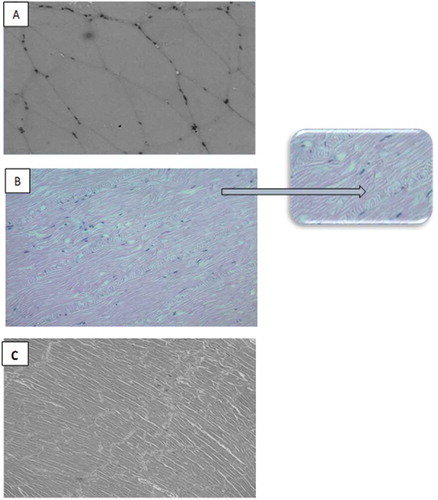
The histological architecture of fresh muscles of all three experimental species is presented in . Interestingly, the arrangement of myofibrils of all three experimental species under study was quite different from one another. Myofibrils of croaker fish were thick and broad but shorter () compared to squid and shrimp. On the other hand, the arrangement of myofibrils of Indian squid was very ordered as these were very fine and long and further supported by a thick and fixed parallel structure (cord-like structure) (). This unique and strong arrangement may possibly be the cause for higher hardness of squid muscle compared to fish and shrimp muscles in general. The compact architecture of the squid may also be responsible for higher water holding capacity of squid muscles as leakage of water will be very slow even under centrifugation. The arrangement of myofibrils in white leg shrimp was also in order, but the fibrils were relatively thicker and loosely arranged and shorter than squid (Fig. 1C).
Figure 1. Histological observations of fresh meat obtained from A: Croaker fish, B: Indian squid, and C: White leg shrimp.
Solubility
Among various other important factors affecting functional properties, solubility is the one which has serious implications on all other functional properties like viscosity, gelation, foaming and emulsification due to pH, concentration of salt, temperature and duration of extraction.[Citation52] Solubilisation of the protein is very important property as this property can decide its proper utilisation for various formulations. The solubility of MFP of fresh croaker fish (55.30%) was much less than that of Indian squid (90%) and white leg shrimp (87%) (). This indicates that the formulation in which one needs higher solubilisation should go for squid or shrimp protein in the fresh condition. The initial solubility of MFP from croaker fish muscles was low as compared to other marine fishes such as queen fish, sea bass, and seabream.[Citation53,Citation54]
Apparent reduced viscosity
The values for apparent reduced viscosity of MFP at the concentration of 5 mg/ml prepared from croaker fish, Indian squid, and white leg shrimp are depicted in . The apparent reduced viscosity values of MFP extracted from fresh Indian squid (0.63 dl/mg) and shrimp (0.60 dl/mg) were almost similar. On the other hand, the value for croaker fish (0. 36 dl/mg) was lowest among the all experimental species. This is possibly because the solubility of croaker fish was least compared to squid and shrimp. In the present study, the value of viscosity obtained for croaker fish was higher than that of ribbon fish,[Citation11] lesser than pre- and post-spawned flounder,[Citation55] and comparable with the tilapia.[Citation56]
Emulsion capacity
The EC of MFP extracted from fresh croaker fish, Indian squid, and white leg shrimp is given in . The EC of MFP extracted from croaker fish, Indian squid, and white leg shrimp was 2–3 times higher than that of the total proteins of ribbon fish,[Citation11] Indian major carps,[Citation24] green mussel,[Citation5] and cephalopods.[Citation57] However, Yapar et al.[Citation58] reported that the variations in EC could be due to the type of meat, dissimilarity of the protein fraction, protein conformation, physicochemical properties, and functional groups of the proteins. If one compares, the EC value of fish myofibrillar protein is higher than beef and poultry as it contains less connective tissues and higher myofibrils than the latter.[Citation58,Citation59] Proteins from experimental species may be recommended as an alternative food or industrial emulsifier for industry.
Water holding capacity
Measuring water holding capacity (WHC) becomes a useful tool for describing the quality of fish protein. WHC of fresh meat is an important property as it affects both the yield and the quality of the end processed product. In the fresh condition, the WHC of Indian squid meat was 58%, being the highest followed by croaker fish (37.80%), while lowest WHC was observed for white leg shrimp (22.60%). The highest WHC recorded for squid in the experiment is probably due to fine and long fibrils or well-organised muscles architecture of squid comprising of fine and long fibrils () compared to croaker fish and shrimp. The strong and compact nature of myofibrils might resist the leakage of the water from muscles during the experiment.
Gel strength
The highest gel strength value was obtained for croaker fish mince among all three experimental species. However, in case of Indian squid (189.55 g), breaking force of the gel was higher than other two experimental species. The least deformation value was obtained for white leg shrimp (6.99 mm) when compared to squid and croaker fish. The breaking forces of Indian mackerel, short-bodied mackerel, and frigate mackerel[Citation60] were higher, while deformation was lower than that of croaker fish. The gel strength value of heat induced gel obtained from fresh croaker fish mince was higher than that obtained from Indian mackerel while lower than that obtained from Indian major carp[Citation24] and striped catfish (Pangasianodon hypophthalmus).[Citation61] Myosin integrity is of paramount importance for gelation.[Citation62] In the fresh condition, the gel strength value of the Indian squid was 257.50 g.cm. The gel strength of other squid species (Illex argentinus) mantle paste[Citation63] was comparable with the value obtained in the present study. However, the gel produced from fins is reported to have more gel strength value than that of gel produced from mantle only.[Citation64]
The gel strength value of fresh white leg shrimp was 80.60 g.cm. The gel produced from white leg shrimp was very fragile and bearing pink colour. The strength of the gel produced from shrimp was very low compared to sin croaker and Indian squid. Previously, the gel produced from pink shrimp also reported to have weaker gel strength. In foresaid study, it was deduced that low gel strength of the gel produced from pink shrimp may be because of high cysteine protease activity.[Citation65] This could also be correlated to weak protein–protein and protein–water interactions as evident by the lowest water holding capacity among the all experimental species.
Instrumental textural parameter
Texture profile analysis of heat induced gels prepared from fresh croaker fish, Indian squid, and white leg shrimp is shown in . In the fresh condition, the gel produced from Indian squid showed higher value for textural parameters such as hardness, springiness, gumminess, and chewiness compared to croaker fish and white leg shrimp. The hardness of the gel produced from squid was more than two times to the gels produced from croaker fish and three times to gels produced from white leg shrimp. Similarly, the value of chewiness of the gel produced from Indian squid was more than three times to that gels produced from croaker fish and shrimp. The hardness of Indian squid’s gel (28.10 N) was slightly higher than that reported for jumbo squid gels (22 N).[Citation64] The hardness value of white leg shrimp under study was comparable to Northern shrimp (~ 7 N),[Citation66] while the values for springiness and cohesiveness were lower. Unique and compact arrangement of myofibrils of Indian squid () may possibly be a reason for the higher value of hardness and chewiness in comparison to fish and shrimp.
Rheological measurement
Storage modulus (also called elastic modulus or G’), loss modulus (also called viscous modulus or G”), and tan delta (also called damping factor) of fresh samples were measured using a temperature sweep (5 to 90°C) at heating rate of 1°C. Gelation of muscle proteins yields from the transformation of an amorphous viscous phase to a three-dimensional elastic network. Therefore, the process of formation of gel can be monitored by rheological parameters.[Citation67] The storage modulus (G’) is a good index for gel forming ability of food proteins.[Citation12] The G’ value of the fresh croaker fish proteins was 15.89 kPa at 5°C which did not vary in the temperature ranges of 5°C to 31.80°C (). This indicates that croaker fish proteins were stable up to this temperature (31.80°C) without any appreciable change. However, on further heating, the values increased up to 48.04°C with relatively less rate but thereafter, value took off sharply and attained maximum value of 695.84 kPa at 64.97°C. A similar sharp increase in G’ value has been reported in Alaska pollock (48.20°C), pacific whiting (48.20°C), bigeye snapper (48.30°C), and threadfin bream (48.60°C).[Citation6] The relatively lower rate of the increment in G’ value between 31 and 48°C suggests that the transformation from viscous sol to elastic network started in this temperature range which geared up intensely after 48°C. In case of fresh Indian squid, the storage modulus value was 5.26 kPa at 5°C which, on heating, gradually increased to 8.42 kPa at 28.41°C. On further heating, the value continuously dipped and reached to a minimum (0.98 kPa) at 41.27°C. However, on continuous heating, the values of storage and loss modulus increased continuously and attained the highest values of 350.94 kPa and 75.48 kPa at 71.74°C and 90°C, respectively (). Similarly, the storage modulus for fresh meat of white leg shrimp was 14.40 kPa at 5°C. On heating, the value decreased to 10.68 kPa at 35.86°C. The pattern of loss modulus was also in the line of storage modulus with lower values (Fig. 2C). This hints that the actual gel formation process started after aforesaid temperature. The gel formation can be ascribed to a structure building reaction from the ordered aggregation and gel network formation affected by the application of thermal energy.[Citation12,Citation68]This transition may be mainly because of the opening up of head region of myosin molecule leading to hydrophobic interaction and possibly disulphide bond formation.[Citation7]The viscous modulus or G” also followed the same trend as that of G’, but the intensity of ordered aggregation was much higher leading to lower G” value. The lower value of the G” than that of G’ was also reported for green mussel,[Citation7] silver carp,[Citation2] and many other marine fish species.[Citation12,Citation54]
Figure 2. Dynamic viscoelastic properties of fresh meat of A: Croaker fish, B: Indian squid, and C: White shrimp during temperature sweep.
The tan δ is the measure of energy lost as a result of viscous flow compared with the energy stored from elastic deformation in a single deformation cycle.[Citation69] Any change in tan δ indicates the type of network formed; lower tan δ values represent formation of better three-dimensional network.[Citation70] The value of tan δ of fresh meat from croaker fish was 0.11 at 5°C which did not change much up to 41.95°C (0.12) and attained a maximum value of 0.20 at 46.69°C which retained up to 90°C (). Even though the slight increase was observed in tan δ elsewhere in the temperature sweep, the value remained well below 0.20, indicating that the elastic component was dominant during gelation process giving reasons for the good gelling ability of croaker fish meat. However, the increment in tan δ value was observed in 41.95–46.69°C that may be due to unfolding of myosin molecules. In short, it can be inferred that the gel formation for croaker fish meat took place in two phases, first between 29 and 40°C and subsequently after 50°C, whereas, in case of Indian squid, the tan δ value was 0.18 at 5°C which relatively remained more or less unchanged up to 28.41°C, but consequently, the value shot up steeply and achieved its maxima (0.74) at 41.27°C (). Later, on subsequent heating, the value reduced to almost its original. This indicates failure of gel formation and confirmed that squid proteins do not have good gelling ability. Similarly, in case of white leg shrimp, the tan δ value was found to be increased from 0.21 to 0.25 in the temperature range of 5°C to 39.93°C, but the value dipped to 0.18 at 43.98°C and almost maintained up to 71.07°C, further returning to near the original value (Fig. 2C).
Conclusion
All the three species selected were high in protein and low in fat but had good proportion of PUFAs. The texture profile and histological studies indicated that the arrangement of muscle fibres plays an important role in deciding texture and eating quality and thereby may be used to predict functional properties of raw material. Our study deduced the specific gelation temperature of croaker fish, Indian squid, and white leg shrimp. This knowledge can help in proper and energy-efficient processing of these three species. It can also be suggested that separate and accurate temperature and time model could be generated for commonly used finfish and shellfish for making surimi or gel-based food products.
Acknowledgement
The Senior Research Fellowship received by the first author from Indian Council of Agricultural Research (ICAR) is gratefully acknowledged. Authors also thank the Director, ICAR-Central Institute of Fisheries Education, for providing necessary facilities.
Related Research Data
References
- Devadason, C.; Jayasinghe, C.; Sivakanesan, R.; Senarath, S.; Beppu, F.; Gotoh, N. Comparative Analysis of Lipid Content and Fatty Acid Composition of Commercially Important Fish and Shellfish from Sri Lanka and Japan. Journal of Oleo Science 2016, 65, 543–556.
- Hernández-Martínez, M.; Gallardo-Velázquez, T.; Osorio-Revilla, G.; Castañeda-Pérez, E.; Uribe-Hernández, K. Characterization of Mexican Fishes according to Fatty Acid Profile and Fat Nutritional Indices. International Journal of Food Properties 2016, 19, 1401–1412.
- Laly, S.J.; Ashok Kumar, K.N.; Sankar, T.V.; Lalitha, K.V.; Ninan, G. Quality of Monosex Tilapia under Ice Storage: Gutting Effects on the Formation of Biogenic Amines, Biochemical, and Microbiological Characteristics. International Journal of Food Properties 2016, http://dx.doi.org/10.1080/10942912.2016.1233433.
- Liu, R.; Zhao, S.; Xiong, S.; Xie, B.J.; Liu, H. M. Studies on Fish and Pork Paste Gelation by Dynamic Rheology and Circular Dichroism. Journal of Food Science 2007, 72, E399–E403.
- Ahhmed, A.M.; Nasu, T.; Huy, D.Q.; Tomisaka, Y.; Kawahara, S.; Muguruma, M. Effect of Microbial Transglutaminase on the Natural Actomyosin Cross-Linking in Chicken and Beef. Meat Science 2009, 82, 170–178.
- Esturk, O.; Park, J.W. Comparative Study on Degradation, Aggregation and Rheological Properties of Actomyosin from Cold, Temperate and Warm Water Fish Species. Turkish Journal of Fisheries and Aquatic Science 2014, 14, 67–75.
- Binsi, P.K.; Dileep, A.O.; Shamasundar, B.A. Some Physico-Chemical, Functional and Rheological Properties of Actomyosin from Green Mussel (Perna viridis). Food Research International 2006, 39, 992–1001.
- Dileep, A.O.; Shamasundar, B.A.; Binsi, P.K.; Badii, F.; Howell, N.K. Composition, Physicochemical and Rheological Properties of Fresh Bigeye Snapper Fish (Priacanthus hamrur) Mince. Journal of Food Biochemistry 2012, 36, 577–586.
- Gómez-Guillén, M.C.; Montero, P.; Solas, M.T.; Borderías, A.J. Thermally Induced Aggregation of Giant Squid (Dosidicus gigas) Mantle Proteins. Physicochemical Contribution of Added Ingredients. Journal of Agricultural and Food Chemistry 1998, 46, 3440–3446.
- Gómez-Guillén, M.; Martinez-Alvarez, O.; Montero, P. Functional and Thermal Gelation Properties of Squid Mantle Protein Affected by Chilled and Frozen Storage. Journal of Food Science 2003, 68, 1962–1965.
- Dileep, A.O.; Shamasundar, B.A.; Binsi, P.K.; Badii, F.; Howell, N.K. Effect of Ice Storage on the Physicochemical and Dynamic Viscoelastic Properties of Ribbon Fish (Trichiurus Spp.) Meat. Journal of Food Science 2005, 70, E537–E545.
- Karthikeyan, M.; Dileep, A.O.; Shamasundar, B.A. Effect of Water Washing on the Functional and Rheological Properties of Proteins from Threadfin Bream (Nemipterus japonicus) Meat. International Journal of Food Science and Technology 2006, 41, 1002–1010.
- Liu, Q.; Bao, H.; Xi, C.; Hanlin, M. Rheological Characterization of Tuna Myofibrillar Protein in Linear and Nonlinear Viscoelastic Regions. Journal of Food Engineering 2014, 121, 58–63.
- AOAC. Official Method of Analysis of AOAC International, Vol. II, 18th edn; Association of Official and Analytical Chemists International: Virginia, 2010; 39 pp.
- Velanker, N.K.; Govindan, T.K. A Preliminary Study of the Distribution of Non-Protein Nitrogen in Some Marine Fishes and Invertebrates. Proceedings of the Indian Academy of Sciences 1958, 47, 202–209.
- Folch, J.; Lees, M.; Sloane-Stanley, G.H. A Simple Method for the Isolation and Purification of Total Lipids from Animal Tissues. Journal of Biological Chemistry 1957, 226, 497.
- Hashimoto, K.; Watabe, S.; Kono, M.; Shiro, K. Muscle Protein Composition of Sardine and Mackerel. Bulletin of the Japanese Society of Scientific Fisheries 1979, 45, 1435–1441.
- Robinson, H.W.; Hogden, C.G. The Biuret Reaction in the Determination of Serum Proteins. Journal of Biological Chemistry 1940, 135, 727.
- Binsi, P.K.; Shamasundar, B.A.; Dileep, A.O. Physico-Chemical and Functional Properties of Proteins from Green Mussel (Perna viridis) during Ice Storage. Journal of Science of Food and Agriculture 2007, 87, 245–254.
- Yang, J.T.; The Viscosity of Macromolecules in Relation to Molecular Conformation. Advances in Protein Chemistry 1961, 16, 323–400.
- Jauregui, C.A.; Regenstein, J.M.; Baker, R.C. A Simple Centrifugal Method for Measuring Expressible Moisture, A Water-Binding Property of Muscle Foods. Journal of Food Science 1981, 46, 271–273.
- Swift, G.E.; Locket, G.; Fryar, A.J. Comminuted Meat Emulsions–The Capacity of Meats for Emulsifying Fat. Food Technology 1961, 15, 468–473.
- Ando, M.; Nakamura, H.; Harada, R.; Yamane, A. Effect of Super Chilling Storage on Maintenance of Freshness of Kuruma Prawn. Food Science and Technology Research 2004, 10, 25–31.
- Ondo-Azi, A.S.; Kumulungui, B.S.; Ludovic, M.L.; Armel Mbina Koumba, A.; Crépin Ella Missang, C. Proximate Composition and Microbiological Study of Five Marine Fish Species Consumed in Gabon. African Journal of Food Science 2013, 7, 227–231.
- Mehta, N.K.; Elaversan, K.; Manjunatha Reddy, A.; Shamasundar, B.A. Effect of Ice Storage on the Functional Properties of Proteins from a Few Species of Fresh Water Fish (Indian Major Carps) with Special Emphasis on Gel Forming Ability. Journal of Food Science and Technology 2014, 51, 655–663.
- Abugoch, L.; Guarda, A.; Pérez, L.M.; Paredes, M.P. Determination of Proximal Chemical Composition of Squid (Dosidicus gigas) and Development of Gel Products. Archivos Latinoamaricanos De Nutricion 1999, 49, 156–161.
- Márquez‐Ríos, E.; Morán‐Palacio, E.F.; Lugo‐Sánchez, M.E.; Ocano‐Higuera, V.M.; Pacheco‐Aguilar, R. Post-Mortem Biochemical Behaviour of Giant Squid (Dosidicus gigas) Mantle Muscle Stored in Ice and Its Relation with Quality Parameters. Journal of Food Science 2007, 72, C356–C362.
- Turan, H.; Kaya, Y.; Erdem, M.E. Proximate Composition, Cholesterol and Fatty Acid Content of Brown Shrimp (Crangon crangon L. 1758) from Sinop Region, Black Sea. Journal of Aquatic Food Product Technology 2011, 20, 100–107.
- Puga-López, D.; Ponce-Palafox, J.T.; Barba-Quintero, G.; Torres-Herrera, M.R.; Romero-Beltrán, E.; Arredondo-Figueroa, J.L.; García-Ulloa, G.M. Physicochemical, Proximate Composition, Microbiological and Sensory Analysis of Farmed and Wild Harvested White Shrimp Litopenaeus vannamei (Boone, 1931) Tissues. Current Research. Journal of Biological Science 2013, 5, 130–135.
- Kumar, P.M.; Ruba Annathai, A.; Jeya Shakila, R.; Shanmugam, S.A. Proximate and Major Mineral Composition of 23 Medium Sized Marine Fin Fishes Landed in the Thoothukudi Coast of India. Journal of Nutrition and Food Science 2014, 4, 259.
- Diler, A.; Ata, S. Microbiological and Chemical Quality and Meat Yield of Penaeus semisulcatus De Haan 1884 Caught from the Antalya Region. Turkish Journal of Veterinary and Animal Science 2003, 27, 497–503.
- Oksuz, A.; Ozyilmaz, A.; Aktas, M.; Gercek, G.; Motte, J. A Comparative Study on Proximate, Mineral and Fatty Acid Compositions of Deep Seawater Rose Shrimp (Parapenaeus longirostris, Lucas 1846) and Red Shrimp (Plesionikamartia, A. Milne-Edwards, 1883). Journal of Animal and Veterinary Advances 2009, 8, 183–189.
- Canizales-Rodríguez, D.F.; Ocaño-Higuera, V.M.; Marquez-Rios, E.; Graciano-Verdugo, A.Z.; Cárdenas-López, J.L.; Yepiz-Gómez, M.S.; Castillo-Yáñez, F.J. Biochemical, Physical, Chemical, and Microbiological Assessment of Blue Shrimp (Litopenaeus stylirostris) Stored in Ice. Journal of Aquatic Food Product Technology 2015, 24, 259–269.
- Haard, N.F.; Control of Chemical Composition and Food Quality Attributes of Cultured Fish. Food Research International 1992, 25, 289–307.
- Massa, A.E.; Paredi, M.E.; Crupkin, N.M. A Chemical Assessment of Freshness in Stored Adductor Muscle from Scallops. Brazilian Journal of Chemical Engineering 2003, 20, 147–152.
- Martínez, O.A.; Gómez, G.M.C.; Montero, P. Chemical and Microbial Quality Indexes of Norwegian Lobsters (Nephrops norvegicus) Dusted with Sulphites. Journal of Food Science and Technology 2008, 43, 1099–1110.
- Huidobro, A.; López-Caballero, M.; Mendes, R. Onboard Processing of Deepwater Pink Shrimp (Parapenaeus longirostris) with Liquid Ice: Effect on Quality. European Food Research and Technology 2002, 214, 469–475.
- Şahin, Ş.A.; Başçınar, N.; Kocabaş, M.; Tufan, B.; Köse, S.; Okumuş, İ. Evaluation of Meat Yield, Proximate Composition and Fatty Acid Profile of Cultured Brook Trout (Salvelinus fontinalis Mitchill, 1814) and Black Sea Trout (Salmo Trutta labrax Pallas, 1811) in Comparison with Their Hybrid. Turkish Journal of Fisheries and Aquatic Science 2011, 11, 261–271.
- Sahar, J.; Zoriasatein, N.; Pour, F. Habitat Effects on Nutritional Quality of Two Marine Fish Fillets, Tiger Tooth Croaker (Otelithes ruber); Four Finger Threadfins (Eleutheronema thetradactylium). International Journal of Ecosystem 2014, 4, 119–123.
- Haq, M.E.; Quddus, M.A. Meat Yield to Total Weight Relationship in Freshwater Giant Prawn Macrobrachium rosenbergii. Indian Journal of Fisheries 1995, 40, 231–233.
- Sikorski, Z.E.; Kolodziejska, I. The Composition and Properties of Squid Meat. Food Chemistry 1986, 20, 213–224.
- Kocatepe, D.; Turan, H. Proximate and Fatty Acid Composition of Some Commercially Important Fish Species from the Sinop Region of the Black Sea. Lipids 2012, 47, 635–641.
- Polvi, S.M.; Ackman, R.G. Atlantic Salmon (Salmo salar) Muscle Lipids and Their Response to Alternative Dietary Fatty Acid Sources. Journal of Agricultural and Food Chemistry 1992, 40, 1001–1007.
- Rincón, L.; Castro, P.L.; Álvarez, B.; Hernández, M.D.; Álvarez, A.; Claret, A.; Guerrero, L.; Ginés, R. Differences in Proximal and Fatty Acid Profiles, Sensory Characteristics, Texture, Colour and Muscle Cellularity between Wild and Farmed Blackspot Seabream (Pagellus bogaraveo). Aquaculture 2016, 451, 195–204.
- Eswar, A.; Kathirvel, K.; Anbarasu, R.; Ramamoorthy, K.; Sankar, G.; Suvitha, S.; Manikandarajan, T. Proximate Composition and Fatty Acid Analysis of Puffer Fish, Lagocephalus inermis (Temminck and Schlegel, 1850) and Lagocephalus lunaris (Bloch and Schneider, 1801) from Parangipettai, Southeast Coast of India. International Letters of Natural Sciences 2014, 12, 21–29.
- Ness, R.B.; Cramer, D.W.; Goodman, M.T.; Kjaer, S.K.; Mallin, K.; Mosgaard, B.J.; Wu, A.H. Infertility, Fertility Drugs, and Ovarian Cancer: A Pooled Analysis of Case-Control Studies. American Journal of Epidemiology 2002, 155, 217–224.
- Norat, T.; Bingham, S.; Ferrari, P.; Slimani, N.; Jenab, M.; Mazuir, M.; Riboli, E. Meat, Fish, and Colorectal Cancer Risk: The European Prospective Investigation into Cancer and Nutrition. Journal of the National Cancer Institute 2005, 97, 906–916.
- Berbert, A.A.; Kondo, C.R.; Almendra, C.L.; Matsuo, T.; Dichi, I. Supplementation of Fish Oil and Olive in Patients with Rheumatoid Arthritis. Nutrition 2005, 21, 131–136.
- FAO/WHO. Diet, Nutrition and the Prevention of Chronic Disease (Technical Report Series 916); WHO: Geneva, Switzerland, 2003.
- HMSO (Her Majesty’s Stationery Office). Nutritional Aspects of Cardiovascular Disease: Report of the Cardiovascular Review Group of the Committee of Medical Aspects of Food Policy Number 46; HMSO: London, United Kingdom, 1994.
- Jakhar, J.K.; Pal, A.K.; Devivaraprasad, A.R.; Sahu, N.P.; Venkateshwarlu, G.; Vardia, H.K. Fatty Acids Composition of Some Selected Indian Fishes. African Journal of Basic and Applied Sciences 2012, 4, 155–160.
- Hall, G.M.; Fish Processing Technology; USA and Canada: VCH Publishers Inc.: New York, 1992.
- Hossain, M.I.; Islam, M.S.; Shikha, F.H.; Kamal, I.M.I. Physicochemical Changes in Thai Pungus (Pungasius sutchi) Muscle during Ice Storage in Storage in an Insulated Box. Pakistan Journal of Biological Science 2005, 8, 798–804.
- Cardoso, C.L.; Rogério, O.M.; Vaz-Pires, P.; Maria, L.N. Quality Differences between Heat-Induced Gels from Farmed Gilthead Sea Bream (Sparus aurata) and Sea Bass (Dicentrarchus labrax). Food Chemistry 2012, 131, 660–666.
- Paredi, M.E.; Crupkin, M. Biochemical and Physicochemical Properties of Actomyosin from Pre-And Post-Spawned Flounder (Paralichtys patagonicus) Stored on Ice. LWT- Food Science and Technology 2007, 40, 1716–1722.
- Murthy, L.N.; Rajanna, K.B. Effect of Washing on Composition and Properties of Proteins from Tilapia (Oreochromis mossambicus) Meat. Fishery Technology 2011, 48, 125–132.
- Ozalp, B.; Karakya, M. Determination of Some Functional and Techno-Biological Properties of Octopus (Octopus Vulgaris C.), Calamari (Illex coindetti V.), Mussel (Mytilus galloprovincialis L.) and Cuttlefish (Sepia Officinalis L.) Meat. Journal of Fisheries Science 2009, 3, 275–284.
- Yapar, A.; Atay, S.; Kayacier, A.; Yetim, H. Effects of Different Levels of Salt and Phosphate on Some Emulsion Attributes of the Common Carp (Cyprinus carpio L., 1758). Food Hydrocolloids 2006, 20, 825–830.
- Gogus, A.K.; Kolsarici, N. Su Urunleri Teknolojisi; Ankara Uni. Ziraat Fak.Yay. No: 1243: Ankara, 1992; 261 pp. (Turkish).
- Chaijan, M.; Panpipat, W.; Benjakul, S. Physicochemical Properties and Gel-Forming Ability of Surimi from Three Species of Mackerel Caught in Southern Thailand. Food Chemistry 2010, 121, 85–92.
- Tanuja, S.; Viji, P.; Zynudheen, A.A.; Ninan, G.; Joshy, C.G. Composition, Textural Quality and Gel Strength of Surimi Prepared from Striped Catfish (Pangasianodon hypophthalmus, Souvage, 1878). Fishery Technology 2014, 51, 106–111.
- An, H.; Peters, M.Y.; Seymour, T.A. Roles of Endogenous Enzymes in Surimi Gelation. Trends in Food Science and Technology 1996, 7, 321–327.
- Suarez, D.M.; Manca, E.; Crupkin, M.; Paredi, M.E. Emulsifying and Gelling Properties of Weakfish Myofibrillar Proteins as Affected by Squid Mantle Myofibrillar Proteins in a Model System. Brazilian Journal of Food Technology 2014, 17, 8–18.
- De La Fuente-Betancourt, G.; Lugo-Sanchez, M.E.; Garcı´a-Carren, O.F.L.; Cordova-Murueta, J.H. Protein Stability and Production of Gels from Jumbo Squid. Journal of Food Biochemistry 2009, 33, 273–290.
- Takahashi, K.; Amemiya, H.; Tanaka, M.; Klomklao, M.; Okazaki, E.; Osaska, E. Influence of the Endogenous Proteases on the Heat Induced Gelation Properties Y of the Pink Shrimp Pandalus eous Meat. Nippon Suisan Gakkaishi 2014, 80, 979–988.
- Qingzhu, Z.; Quality Indicators of Northern Shrimp (Pandalus borealis) Stored under Different Cooling Conditions. The United Nation University. Fisheriestraningprogramme. http://www.unuftp.is/static/fellows/document/zeng_prf.pdf, 2003, 145 pp.
- Egelandsdal, B.; Martinsen, B.; Autio, K. Rheological Parameters as Predictors of Protein Functionality: A Model Study Using Myofibrils of Different Fibre-Type Composition. Meat Science 1995, 39, 97–111.
- Ziegler, G.R.; Foegeiding, E.A. The Gelation of Proteins. In Advances in Food and Nutrition Research; Kinsella, J.E.; Ed.; New York academic press, New York 1990; Vol. 34, 204–286.
- Chan, J.T.Y.; Omana, D.A.; Betti, M. Functional and Rheological Properties of Proteins in Frozen Turkey Breast Meat with Different Ultimate Ph. Poultry Science 2011, 90, 1112–1123.
- Sun, X.D.; Arntfield, S.D. Gelation Properties of Salt Extracted Pea Protein Induced by Heat Treatment. Food Research International 2010, 43, 509–515.