
ABSTRACT
A methodology based on Fourier transform infrared (FTIR) spectroscopy with different absorption modes, combined with chemometrics techniques, was developed as a tool to quantify the free fatty acids (FFAs) in extra virgin olive oils (EVOOs). The range of FFA contents of calibration samples was extended by adding 0–1.00% oleic acid to refined and deodorized olive oil (RDOO) containing 0.00% FFA. Calibration models were implemented using the partial least-squares (PLS) regression technique. Two absorption modes, reflection and transmission, and two pretreatments, normal and first derivative spectra, were tested in several infrared spectral regions. In order to construct the calibration models, 15 calibration samples were scanned in different absorption modes, and 10 different brands of EVOOs were used for checking the predictive capacity of the best calibration model. The results showed that the best predictions were achieved using normal spectra in the transmission mode using 100 µm CaF2 flow cell with the highest correlation coefficient (R2) of 0.99979 and the lowest root mean square error of calibration (RMSEC) of 0.00441 and root mean square error of cross-validation (RMSECV) of 0.0107 in the infrared spectral region 1724–1646 + 3324–3023 cm−1. The method developed is fast, environment-friendly, and it could be easily used in olive oil industries for the rapid and reliable quantification of FFA content in EVOOs.
Introduction
Olive oil, unlike most vegetable oils, is a natural product obtained from olive fruits. It is a natural juice and can be consumed without further treatments; hence, it has been produced by mechanical extraction without chemicals and any treatment.[Citation1] Environmental and seasonal effects, as well as olive oil-processing methods,[Citation2] have been reported to influence olive oil composition and create different categories of olive oil that have been established by international organizations. To determine the type of olive oil, various analysis methods that measure differing parameters have been developed. Among the analysis methods, it is a commonly used way to determine the level of acidity that measures the free fatty acid (FFA) content, which is one of the main parameters used to establish the different types of olive oil.
Among the different types of olive oil, extra virgin olive oil (EVOO), which is the most valuable olive oil category,[Citation3] must contain no more than 0.8% FFA content according to the relevant international organizations. Besides the FFA content, three criteria should be satisfied for olive oil to be certified as EVOO: it must be produced by mechanical extraction methods without chemicals and hot water; it must come from first cold-pressing; and it must have a perfect taste.[Citation4] Because of these criteria, quantification of FFAs in olive oils has great significance for their categorization.
The oxidation of oils is influenced by the fatty acid composition of the oil, energy of heat or light, oil processing, the concentration and type of oxygen, and especially FFAs. These factors interactively affect the oxidation of EVOOs and the differentiation of the individual effect of the factors is not easy. In addition, the FFA content of EVOO is the result of the degree of split of the triacylglycerols due to a chemical interaction called hydrolysis or lipolysis.[Citation5] Because of these properties, FFAs are thus a direct measure of the quality of the EVOOs, and reflect the care taken right from blossoming to the eventual sale and consumption of the EVOO.
Generally, FFA content is determined by the titration method of the American Oil Chemists’ Society (AOCS). The method is based on titration of the oil dissolved in neutralized ethanol/diethyl ether with a strong base to a phenolphthalein end point.[Citation6] Although it is very simple, the titration process is time-consuming and needs substantial amounts of chemical reagents, which are expensive and toxic, besides generating chemical waste. To eliminate these drawbacks, a number of spectroscopic methods have been proposed as alternatives to the AOCS method in recent years.
Nowadays, FTIR spectroscopic techniques are used often for the authentication and quantitative analysis of oils and fats.[Citation7–Citation9] The McGill IR Group has already developed various spectroscopic methods using Fourier Transform Infrared (FTIR) in combination with chemometrics techniques as alternatives to the official titrimetric methods in the quantitative determination of important quality parameters of oils and fats such as saponification number,[Citation10] iodine value,[Citation10–Citation13] cis and trans content,[Citation10,Citation13] peroxide value,[Citation14–Citation16] and moisture.[Citation17] For the determination of FFAs in EVOOs using spectroscopic methods, a number of articles have been published. Bertran et al. [Citation18] developed a new procedure for determining FFAs in olive oil based on spectroscopic FTIR–attenuated total reflectance (ATR) spectroscopy. They used only one absorption mode and used two wavenumber ranges (1775–1689 cm−1 and 1480–1050 cm−1) and several pretreatments including first and second derivatives and standard normal variate. First, the effect of absorption mode on the quantification of FFAs in EVOO has been studied in this work.
Edible oils are ideal samples for mid-infrared (MIR) analyses because they can be readily analysed in their neat form with the use of either a transmission flow cell or a horizontal ATR accessory in the transmission or reflection mode, respectively.[Citation19] According to the amount of component present in oils, a convenient absorption mode can be selected. To the best of our knowledge, there are hardly any studies determining the FFA levels of EVOOs by FTIR spectroscopy considering different absorption modes. In this study, we developed a simple, rapid, and special method for the quantification of FFAs in EVOOs from a small amount of oil using FTIR spectroscopy without the use of reagents.
Materials and methods
Samples and reagents
All chemicals and solvents used in the study were of analytical grade, obtained from Sigma–Aldrich (St. Louis, MO, USA), and used without further purification. A total of 11 olive oil samples of different brands, including 10 EVOOs and one refined and deodorized olive oil (RDOO), were purchased from the local markets (Montréal, QC, Canada).
Preparation of calibration standards
A set of 15 standards covering a wide range of 0–1.00% FFA were prepared by the gravimetric addition of oleic acid to RDOO after it had been through an activated silica gel column to remove any traces of FFA. The FFA percentages of the prepared standards and EVOO samples were determined by the AOCS titration method.[Citation6] The results are expressed in terms of % oleic acid.
ATR-FTIR-based method
ATR-FTIR spectra of the standards and samples, with known FFA percentages (determined by the AOCS method[Citation6]), were recorded on a Bruker Alpha-FTIR spectrometer (Bruker Optic GmbH, Ettlingen, Germany) equipped with a deuterated triglycine sulfate (DTGS) detector, a temperature-controlled single-bounce diamond ATR crystal. The spectrometer was run under the software OPUS (Bruker Optic). A sample volume of 0.10 mL was uniformly spread on the ATR surface (~2 mm in diameter). Each spectrum was the result of 128 co-added scans recorded at 8 cm–1 resolution over the wavenumber range from 4000 to 650 cm–1. All analyses were carried out at room temperature. The samples were run in triplicates and a new background was recorded between each replicate. The diamond ATR crystal was cleaned with ethanol to remove any residual contamination by the previous sample. Changes in the infrared spectral region of 1724–1646 cm–1 related to the C = O stretch[Citation20] and 3324–3023 cm–1 related to the O-H stretch of carboxylic acid were employed to create partial least squares (PLS)-based calibration models using the TQ Analyst v 7.2 (Thermo-Nicolet, Madison, WI) software.
Transmission-FTIR-based method
FTIR spectra of standards and samples were also recorded on a Bomem FTIR spectrometer (MB Series, Bomem Inc., Quebec, Canada) equipped with a DTGS detector capable of scanning the spectral range of 4000–650 cm–1. The spectrometer was run under the Bomem-Grams/32 software (Galactic Industries Co., Salem, NH). The sample handling accessory was an injected 100-µm CaF2 transmission flow cell (Dwight Analytical, Toronto, ON, Canada). For analysis, the flow cell was filled with an adequate amount of standards and EVOOs and scanned over the spectral range of 4000–650 cm–1. All samples and background spectra were recorded by co-adding 128 scans at a resolution of 8 cm−1. Background spectra were collected every 30 min in the absence of the transmission cell. The same spectral regions employed in the ATR analysis were used to create PLS-based calibration models using the TQ Analyst v 7.2 (Thermo-Nicolet, Madison, WI) software.
Calibration and validation
Calibration models correlating the FTIR spectra and chemical data in both reflection and transmission modes were carried out employing PLS regression. The accuracy and performance of the models were assessed by the value of correlation coefficient (R2), root mean square error of calibration (RMSEC), and root mean square error of cross-validation (RMSECV). To choose the best calibration model, increasing R2 and decreasing RMSEC and RMSECV values were considered. A set of 10 EVOO samples was employed for validation. The results of FFA determination by the proposed FTIR method were compared with the results from the standard AOCS method.
Results and discussion
EVOO FTIR spectra
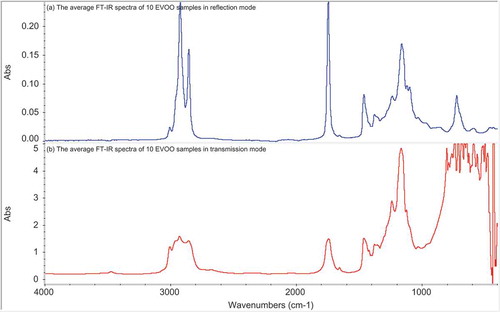
and 1b present the average FTIR spectra of 10 EVOO samples in the reflection and transmission modes, respectively. In both modes, absorption bands were observed at 3007 cm−1 related to the C–H stretch of cis-C = C bonds,[Citation19] and at 2921 and 2855 cm−1 related to the asymmetric and symmetric vibration of the CH2 stretch, respectively.[Citation20] The band at 1744 cm−1 related to the C = O stretch of triglyceride ester linkage,[Citation19] and a small absorption band at 1710 cm−1 is characteristic carbonyl stretching band of FFAs (C = OH). The band at 1654 cm−1 is due to the absorption of cis-C = C bonds, and at 1460 cm−1 related to the C–H absorption of bending vibrations of CH2 and CH3 bands.[Citation21] The bands of CH2 bending vibrations were observed at 1376 and 1236 cm−1. The bands at 1158, 1118, and 1097 cm−1 are due to the absorption of C–O ester bonds. The CH2 rocking vibration can be clearly seen at 722 cm−1.[Citation21]
Figure 1. The average Fourier transform infrared spectroscopy spectra of 10 extra virgin olive oil samples in (a) reflection and (b) transmission modes in view of the full scale.
PLS calibration models and validation
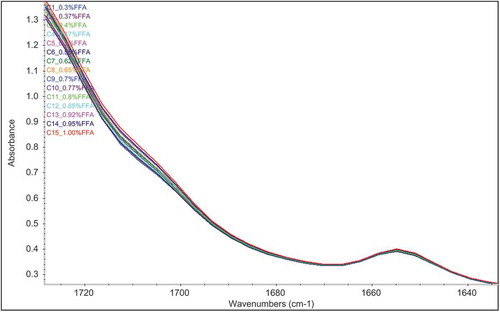
PLS regression is a powerful multivariate analysis technique that has a wide range of usage in quantitative infrared spectroscopy.[Citation22,Citation23] Hence, it is composed of simplified classical least-squares (CLS) and inverse least-squares (ILS) calibration models; PLS exhibits many of the advantages of the ILS and CLS methods for spectral analyses without having the disadvantages of these.[Citation23] and show normal and first derivative spectra of one of the selected regions of the calibration standards. Increasing absorption of the carbonyl stretching band of FFAs was clearly seen in the range of 1724 and 1646 cm−1.
Figure 2. Normal Fourier transform infrared spectroscopy spectra of the 15 calibration standards in the one of selected spectral regions between 1724 and 1646 cm−Citation1 in the transmission mode.
To correlate the FFA in the calibration standards with their FTIR spectrum, 12 multivariate calibration models were built by the PLS algorithm using normal and first derivative spectra of the selected spectral regions in both absorption modes. The FFA concentrations of the calibration standards were plotted against the FFA values measured at the selected spectral regions (). To establish the PLS parameters, a cross-validation process was carried out within the calibration set using the “leave one out” procedure.[Citation24] The number of PLS factors was automatically determined by the software based on the minimal stable predicted sum of squares (PRESS).
Figure 3. First derivative Fourier transform infrared spectroscopy spectra of the 15 calibration standards in one of the selected spectral regions between 1724 and 1646 cm−Citation1 in the transmission mode.
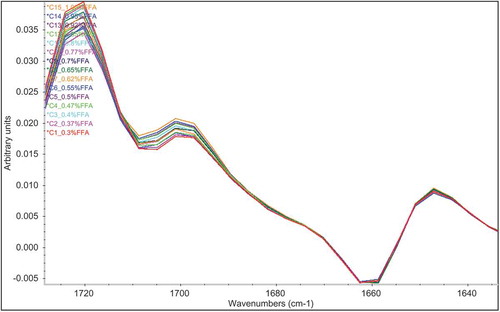
Figure 4. The best partial least squares calibration model for the determination of free fatty acids in extra virgin olive oils by Fourier transform infrared spectroscopy.
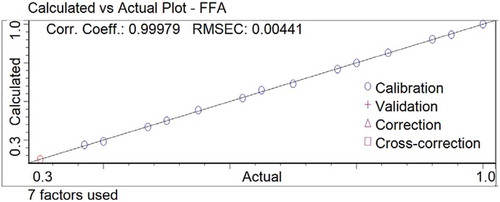
In the PLS plot using 15 calibration points (), “actual” values are the results obtained by the AOCS method, while “calculated” values are those predicted by the proposed FTIR method for the determination of FFAs in EVOOs. shows the statistics for 12 PLS calibration models based on different spectral regions and sampling methods tested. Considering the absorption modes, PLS models using the transmission mode gave slightly improved results compared to the PLS models using the reflection mode. This result was evaluated in this manner. Because of the high levels of absorption (), the transmission mode has more spectral information than the reflection mode in the studied IR region. Considering the spectral modes, it was shown that PLS models using the normal and first derivative spectra have almost the same results in the wavenumber regions studied.
Table 1. Equation values of the developed partial least squares calibration models for the determination of free fatty acids in extra virgin olive oils using Fourier transform infrared spectroscopy.
As seen in , all models have very high R2 values and low RMSEC and RMSECV values. However, the best prediction results were achieved by normal spectra in the transmission mode using a 100-µm CaF2 flow cell with the highest R2 of 0.99979, and the lowest RMSEC of 0.00441 and RMSECV of 0.0107, when all of the parameters used for the statistical results are considered in . Additionally, the root mean square error of prediction (RMSEP) value was calculated for the model that had the best results, while the RMSEP value of 0.0572 indicated that the PLS method using normal spectra in the transmission mode had strong accuracy for predicting the FFAs in EVOOs by FTIR spectroscopy.
Validation results from the best PLS calibration model for the quantification of FFAs in EVOOs are shown in . To check the predictive capacity of the best PLS model, the separate set of 10 EVOO samples was analysed by the proposed FTIR and AOCS methods. As can be seen in , the results were comparable and they indicated that the developed PLS model successfully measured the FFA amounts in the validation samples with low standard deviation values. FFA content is an important factor for classifying EVOOs. For an olive oil to be certified as EVOO, it must contain no more than 0.8% FFA content as mentioned before. However, according to the FFA results in , there were a few EVOO samples containing more than 0.8% FFA in the markets. For this reason, it is very important to use a reliable and fast method having high accuracy and ease of quantification of FFA content in the EVOOs.
Table 2. Results of triplicate analysis of free fatty acids in extra virgin olive oils by American Oil Chemists’ Society and the proposed transmission-based Fourier transform infrared spectroscopy methods.
Conclusions
This study reports that FTIR spectroscopy coupled with chemometrics technique like a PLS model is an adequate method for the quantification of FFAs in EVOOs without any sample pretreatment and a destructive process. When the absorption modes were examined, it was seen that the transmission mode was better than the reflection mode in the spectral regions studied. Moreover, normal spectra in the wavenumber ranges between 1724 and 1646 and between 3324 and 3023 cm−1 were found to have the highest information content to achieve the optimum lowest error. The use of the proposed FTIR method with the developed PLS calibration model allowed us to improve an alternative to the official method, which determines FFAs in EVOOs of different types. Additionally, the developed method could be easily used in olive oil industries for rapid and reliable analysis of the FFA content in EVOOs.
Acknowledgment
The authors of this study thank the Department of Food Science & Agricultural Chemistry at McGill University, Montréal, QC, Canada, for providing a good environment for research.
Funding
The authors also thank the Scientific Research Projects Foundation of Selçuk University (SÜBAP-Grant Number 16101011) for financial support of this work produced from a part of Ismail Tarhan’s PhD Thesis. They thank the Scientific and Technological Research Council of Turkey (TÜBİTAK) under the 2214/A PhD Scholarship Program for providing the financial support to Ismail Tarhan for carrying out this research
Additional information
Funding
Related Research Data
References
- Boskou, D. Olive Oil: Chemistry and Technology; 2nd ed.; AOCS Press: Champaign, IL, 2006; 113.
- Di Vaio, C.; Nocerino, S.; Paduano, A.; Sacchi, R. Influence of Some Environmental Factors on Drupe Maturation and Olive Oil Composition. Journal of the Science of Food and Agriculture 2013, 93, 1134–1139.
- Rohman, A. Infrared Spectroscopy for Quantitative Analysis and Oil Parameters of Olive Oil and Virgin Coconut Oil: A Review. International Journal of Food Properties 2016. doi:10.1080/10942912.2016.1213742
- Calabriso, N.; Scoditti, E.; Pellegrino, M.; Annunziata Carluccio, M. Olive Oil. In The Mediterranean Diet: An Evidence-Based Approach; Preedy, V.R.; Watson, R.R.; Eds.; Academic Press: London, UK, 2015; 135–142.
- Topkafa, M.; Ayyildiz, H.F. An Implementation of Central Composite Design: Effect of Microwave and Conventional Heating Techniques on the Triglyceride Composition and Trans Isomer Formation in Corn Oil. International Journal of Food Properties 2017, 20 (1), 198–212.
- Firestone, D. Official Methods and Recommended Practices of the American Oil Chemists’ Society; American Oil Chemists’ Society: Champaign, IL, 1989.
- Rohman, A.; Che Man, Y.B. Authentication of Extra Virgin Olive Oil from Sesame Oil Using FTIR Spectroscopy and Gas Chromatography. International Journal of Food Properties 2012, 15 (6), 1309–1318.
- Mahesar, S.A.; Shah, S.N.; Mahesar, A.W.; Kandhro, A.A.; Khaskheli, A.R.; Menghwar, P.; Sherazi, S.T.H. A Chemometric Approach for the Quantification of Free Fatty Acids in Cottonseed Oil by Fourier Transform Infrared Spectroscopy. International Journal of Food Properties 2016. doi:10.1080/10942912.2016.1223129
- Nurrulhidayah, A.F.; Che Man, Y.B.; Shuhaimi, M.; Amin, I.; Khatib, A. FTIR-ATR Spectroscopy Based Metabolite Fingerprinting as a Direct Determination of Butter Adulterated with Lard. International Journal of Food Properties 2015, 18 (2), 372–379.
- Li, H.; van de Voort, F.R.; Sedman, J.; Ismail, A.A. Rapid Determination of Cis and Trans Content, Iodine Value, and Saponification Number of Edible Oils by Fourier Transform Near-Infrared Spectroscopy. Journal of the American Oil Chemists’ Society 1999, 76 (4), 491–497.
- Cox, R.; Lebrasseur, J.; Michiels, E.; Buijs, H.; Li, H.; van de Voort, F.R.; Ismail, A.A.; Sedman, J. Determination of Iodine Value with a Fourier Transform-near Infrared Based Global Calibration Using Disposable Vials: An International Collaborative Study. Journal of the American Oil Chemists’ Society 2000, 77, 1229–1234.
- Li, H.; van de Voort, F.R.; Ismail, A.A.; Sedman, J.; Cox, R.; Simard, C.; Buijs, H. Discrimination of Edible Oil Products and Quantitative Determination of Their Iodine Value by Fourier Transform Near-infrared Spectroscopy. Journal of the American Oil Chemists’ Society 2000, 77, 29–36.
- Sedman, J.; van de Voort, F.R.; Ismail, A.A.; Maes, P. Industrial Validation of Fourier Transform Infrared Trans and Lodine Value Analyses of Fats and Oils. Journal of the American Oil Chemists’ Society 1998, 75, 33–39.
- Li, H.; van de Voort, F.R.; Ismail, A.A.; Cox, R. Determination of Peroxide Value by Fourier Transform Near-infrared Spectroscopy. Journal of the American Oil Chemists’ Society 2000, 77, 137–142.
- Ma, K.; van de Voort, F.R.; Ismail, A.A.; Sedman, J. Quantitative Determination of Hydroperoxides by Fourier Transform Infrared Spectroscopy with a Disposable Infrared Card. Journal of the American Oil Chemists’ Society 1998, 75, 1095–1101.
- Ma, K.; van de Voort, F.R.; Sedman, J.; Ismail, A.A. Stoichiometric Determination of Hydroperoxides in Fats and Oils by Fourier Transform Infrared Spectroscopy. Journal of the American Oil Chemists’ Society 1997, 74, 897–906.
- Meng, X.; Sedman, J.; van de Voort, F.R. Improving the Determination of Moisture in Edible Oils by FTIR Spectroscopy Using Acetonitrile Extraction. Food Chemistry 2012, 135, 722–729.
- Bertran, E.; Blanco, M.; Coello, J.; Iturriaga, H.; Maspoch, S.; Montoliu, I. Determination of Olive Oil Free Fatty Acid by Fourier Transform Infrared Spectroscopy. Journal of the American Oil Chemists’ Society 1999, 76, 611–616.
- Li-Chan, E.C.Y.; Ismail, A.A.; Sedman, J.; van de Voort, F.R. Vibrational Spectroscopy of Food and Food Products. In Handbook of Vibrational Spectroscopy; Chalmers, J.M.; Peter, R.G.; Eds.; John Wiley & Sons: NY, USA, 2006; 3629–3662.
- Ismail, A.A.; van de Voort, F.R.; Sedman, J. Chapter 4 Fourier Transform Infrared Spectroscopy: Principles and Applications. In Techniques and Instrumentation in Analytical Chemistry; Paré, J.R.J.; Bélanger, J.M.R.; Eds.; Elsevier: Amsterdam, Netherlands, 1997; 93–139.
- Silverstein, R.M.; Bassler, G.C.; Morill, T.C. Infrared Spectrometry. In Spectrometric Identification of Organic Compounds; Silverstein, R.M.; Bassler, G.C.; Morill, T.C.; Eds.; John Wiley & Sons: NY, USA, 1991; 71–143.
- Fuller, M.P.; Ritter, G.L.; Draper, C.S. Partial Least-Squares Quantitative Analysis of Infrared Spectroscopic Data. Part I: Algorithm Implementation. Applications Spectroscopic 1988, 42, 217–227.
- Haaland, D.M.; Thomas, E.V. Partial Least-squares Methods for Spectral Analyses. 1. Relation to Other Quantitative Calibration Methods and the Extraction of Qualitative Information. Analytical Chemistry 1988, 60, 1193–1202.
- Picard, R.R.; Cook, R.D. Cross-validation of Regression Models. Journal American Statistical Association 1984, 79, 575–583.