
ABSTRACT
In this paper, strawberry freshness forecasting performed using artificial olfactory system (AOS) was investigated. Human sensory evaluation (HSE), firmness, total soluble sugar (TSS), and reducing sugar content (RSC) of the samples were examined to provide physical/chemical references for the AOS system. AOS responses to strawberry samples were measured and measurement data were analyzed by principal component analysis (PCA) and stochastic resonance (SR). Experimental results indicated that the PCA method qualitatively discriminated strawberry samples in different freshness levels. The strawberry freshness forecasting model was established based on AOS. The forecasting model successfully discriminated strawberry samples with regression coefficients of R2 = 0.98159. Validating experiment results indicated that the developed model using AOS presented a predictive accuracy of 92%.
Introduction
Strawberry is favored by people around the world. It contains sugars, crude fibers, amino acids, and minerals. It also has a delicious taste and pleasant fragrance.[Citation1,Citation2] Strawberry has been a beneficial healthy food for mankind due to its unique properties. It makes evident contribution to health and some diseases besides modulating the secretions of human being.[Citation3,Citation4] During storage, the fruit freshness declines, or even gets deteriorated, causing much economic losses to farmers.[Citation2,Citation5] Food freshness analysis methods include human sensory evaluation (HSE), physical/chemical examination, and instrumental analysis. HSE evaluates some food properties, such as color, flavor, firmness, etc.[Citation6–Citation9] Physical/chemical examination is the destructive method. It cannot be used in agriculture product quality rapid analysis applications. The equipment for instrument analysis is expensive. It also has some disadvantages, such as time-consuming, high cost, etc. Moreover, skilled operators are needed to conduct the analysis. Thus, a rapid, nondestructive, and effective method is urgently needed for fruit-quality determination.
Table 1. Sensory evaluation scheme for strawberry samples.
Artificial olfactory system (AOS) has been widely applied in food examination.[Citation10–Citation13] Han et al. quantitatively evaluated Pseudosciaena crocea freshness by AOS and electronic tongue techniques in conjunction with chemometric analysis.[Citation14] Liu et al. successfully developed the relationship between kiwi fruit freshness and storage time by surface acoustic wave resonator (SAWR) combined with electronic nose.[Citation15] Esteves et al. investigated the applications of AOS with new composite porphyrin-conductive polymer gas sensors in tasted vapors discrimination.[Citation16] Russo et al. proposed a nondestructive flavor evaluation method for red onion Ecotypes based on AOS.[Citation17,Citation18]
The strawberry freshness rapid forecasting method based on AOS was investigated in this research. The responses of AOS to strawberry samples with different storage times were measured. HSE, firmness, total soluble sugar (TSS), and reducing sugar content (RSC) of the samples were examined to provide a physical/chemical reference for the AOS system. Strawberry freshness forecasting model was built based on AOS measurement Eigen values.
Materials and methods
Strawberry samples
The strawberry samples were provided by a farmer doing business in a fruit market. All samples were captured from the same planting zone located in the same greenhouse. This condition granted all the fruits had the same irrigation quantity, fertilizers dose, etc. The samples were transported to our laboratory within half an hour at room temperature. The samples were selected for uniformity of size and color, free from disease, ensuring they were at the same physiologically mature stage, and were not subjected to any mechanical damage or postharvest process. All samples were stored at 25°C and 85% relative humidity (RH). All samples were stored at 1°C for 11 days.[Citation19–Citation22]
Chemicals
NaOH (Tianjin Damao Chemical Reagent Co., Ltd, China), HCl (Quzhou Juhua Chemical Reagent Co., Ltd, China), H3BO3 (Dongguan Dongjiang Chemical Reagent Co., Ltd, China), MgO (Beijing Tongguang Chemical Reagent Co., Ltd, China), methyl red (Tianjin Jizhun Chemical Reagent Co., Ltd, China), methylthionine chloride (Shanghai Sanai Chemical Reagent Co., Ltd, China), ethanol (Sinopharm Group Chemical Reagent Co., Ltd, China), and deionized water – all chemicals were of analytically pure grade or better quality.
Human sensory evaluation
HSE of strawberry samples was evaluated by 10 experienced panelists (age ranging from 28 to 38 years, 5 women and 5 men), and voting number was set at k, k∈(1,10) (). Strawberry quality was divided into m levels, and the score of a specific level was set at hj, j ∈(1,m). Strawberry attributes were divided into n elements, and a specific element was set at ui, i ∈(1,n). The contributory weight was determined by the pairwise comparison of each attribute based on the significance of attributes, and a specific contribution weight of attributes was set at xi (∑xi = 1). If there is a specific relationship between two objects of hj and ui, the relation set (matrix) of f is calculated as follows:
Thus, the overall acceptability of strawberry is calculated by the weight grade method as follows:[Citation15]
Firmness
TA.XT2i Texture Analyzer (Stable Micro Systems, UK) was used to conduct texture measurement. Flat cylindrical probe p/5 (5 mm in diameter) was used. In texture analyzer software setting, the TPA mode was selected for instrument control. Speed during measurement and after measurement was 3 mm/s. Measurement speed was 1 mm/s. Compression degree was 50%. Residence time interval was 5 s. Load probe type was Auto-0.2g. Data collection rage was 200. On each day, five samples were used for firmness analysis.
Total soluble sugar
On each day, five strawberries were used for TSS analysis. Strawberry was ground in a mortar and squeezed with a hand press for juice. The juice from one sample was divided into three packages. The juice was packaged by small beakers. The juice was used for TSS measurement. The measurement was conducted utilizing a refractometer (WZ113/ATC, China) at 25°C.
Reducing sugar content
The RSC index is examined according to the AOAC protocols official methods of 945.66 total reducing sugars.[Citation23] Carbohydrates containing a free aldehyde (-CHO) or ketone (-C = O) group act as reducing agents. Most are based on the reduction of Cu2+ (cupric ions) to Cu+ (cuprous ions) in alkaline solution to give a red precipitate of cuprous oxide, Cu2O. A number of tests have evolved using different substances for preventing the formation of black cupric oxide when CuSO4 is heated with alkali. Solutions of cupric sulfate (Fehling’s 1) and alkaline sodium potassium tartrate (Fehling’s 2) were mixed together and then with the reducing sugar solution, and finally heated. A positive reaction showed the red precipitate of Cu2O or with more dilute solutions of reducing sugar, a green orred, or a red-yellow color.
AOS measurement
AOS system
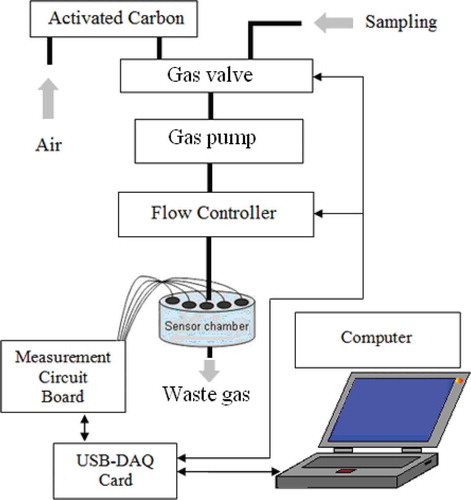
AOS structure is displayed in . It has three parts: data acquisition unit, gas sensor array unit, and power supply unit. The pump is FML201 (Xinweicheng Technology Co., Ltd, Chengdu, China). The valve is WTA-2K (Takasago Electrical Co., Ltd, Tokyo, Japan). Data acquisition unit was developed in a laboratory. The gas sensor array unit has eight metal oxide semiconductor (M.O.S) sensors with various chemical compositions and thicknesses to provide selectivity toward different gases. The selectivity toward volatile compound classes of M.O.S sensors is indicated by the manufacturer: sensor S1 (TGS-825, sulfide), sensor S2 (TGS-821, flammable gases), sensor S3 (TGS-826, ammonia gas), sensor S4 (TGS-822, ethanol, aromatic hydrocarbons), sensor S5 (TGS-842, hydrocarbon component gas), sensor S6 (TGS-813, methane, propane, butane), sensor S7 (TGS-2610, propane, butane), and sensor S8 (TGS-2201, nitrogen oxides). AOS has a gas sensor chamber, which contains eight M.O.S gas sensors. The sensor has a gas inlet hole. The gas-sensing membrane is located within the sensor. AOS response is measured as sampling voltage (V). The M.O.S sensors rely on changes in conductivity induced by molecule adsorption in the gas phase and on subsequent surface reactions. The sensors have a ceramic substrate coated by an M.O.S film, and heated by a wire resistor. Due to the high temperature (about 250–500°C), the volatiles transferred to the surface of the sensors are totally combusted to carbon dioxide and water, leading to a change in the resistance. The high temperature avoids water interference and provides M.O.S fast response and rapid recovery time. Polytetrafluorethylene (PTFE) material is used to fabricate the gas sensor chamber. The gas sensors are distributed along a circle. The sampling gases are blown from the center of the circle into the separated chamber for the reaction with the sensors. The distance between the circle center and the chamber entrance is the same. At the chamber entrance, the foam is placed to disperse the gas flow, which ensures that the flow influence on the sensor is reduced to the lowest. This method effectively decreases the cross-influence and flow influence on sensors within the chamber.
Figure 1. Artificial olfactory system schematic structure.
AOS measurement
Before AOS measurement, all samples were placed into 250 mL beakers. After sealing with a sealing membrane, they were equilibrated at room temperature for 30 min. AOS responses to strawberry samples were measured with the static headspace sampling method. After a series of preliminary experiments, e-nose measurement time was set at 45 s. After each measurement, a sensor array was recovered by zero gas (99.99% high-purity nitrogen) at a flux speed of 1000 mL/min for 600 s, waiting for the next measurement. The responses to zero gas were also recorded during the experimental period. Results suggested that the responses to zero gas were relatively weak (near zero), indicating that the e-nose system utilized in this research had high stability.
Statistics
Mean values with standard deviation (SD) were reported for each experiment. Each test was repeated in triplicate. Data were subjected to one-way ANOVA processing. Differences at the p < 0.05 level were considered significant. MATLAB R2009 was used for statistical analysis of the data. Principal component analysis (PCA) is a frequently used method that uses an orthogonal transformation to convert a set of observations of possibly correlated variables into a set of values of linearly uncorrelated variables called principal components.[Citation17,Citation18] The number of principal components is less than or equal to the number of original variables. This transformation is defined in the way that the first principal component has the largest possible variance, and each succeeding component has the highest variance possible under the constraint that it is orthogonal to the preceding components. The resulting vectors are an uncorrelated orthogonal basis set. The principal components are orthogonal because they are the eigenvectors of the symmetric covariance matrix.[Citation23–Citation25]
Stochastic resonance (SR) is proposed for the explanation of Earth climate periodical changes, which has been widely applied in the signal processing field.[Citation26–Citation28] SR is a typical nonlinear model and plays an active part in signal processing and pattern recognition in recent years. This method converts the energy of intrinsic noise into the weak input signal. The input signal can be amplified so that it can be detected. SR has been successfully applied in AOS signal processing. The usage of the SR technique realizes two functions, the reduction of noise and the amplification of aimed weak signal (AOS measurement data). The SR model can be described as follows:[Citation26,Citation27]
where is the position of the Brownian particle,
is the time, M and C are adjustable parameters,
is an input signal
with an intrinsic noise
,
is the external noise, and
is the simplest double-well potential with the constants
and
.
Eq. (3) can be transformed as
The minima ofare located at
, where
. A potential barrier separates the minima with the height given by
. The barrier top is located at
. When three elements of SR interact coherently, the potential barrier can be reduced and the Brownian particle may surmount the energy barrier and enter another potential well. The intensity of signals will increase, which makes it possible that the weak signal can be detected from noise background. Signal-to-noise ratio (SNR) is usually utilized for SR characterization:
is the density of the signal spectral, and
is noise intensity within the range of signal frequency.
Results and discussion
Human sensory evaluation
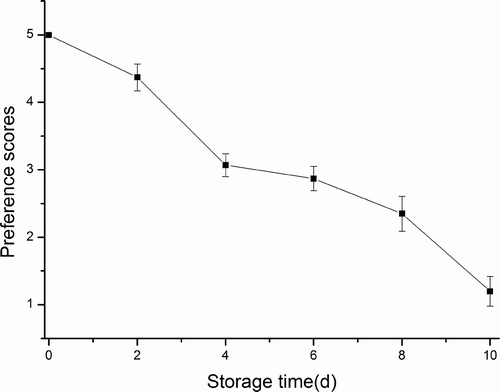
Sensory attributes of strawberry were divided into five elements, whose preference levels were scored from 1 to 5. The higher the preference level, the higher the element score. Strawberry HSE results are displayed in . All samples started with a score of 5. On day0, the samples had a particularly bright red color, dry and hard skin, delicious taste, and rich fruity odor. On day2 and day4, the samples’ color slightly turned dark. On day6, decay within small scale was observed. The skin got slightly soft and wet. The fruity odor decreased slightly. The taste got off-flavor slightly. On day6 and day8, obvious decay was observed, and the fruit skin got softer and wet. The samples gave panelists off-flavor taste and vinosity odor. The samples were not suitable for eating any more. On day10, the samples’ skin became very wet and soft. The samples emitted strong vinosity, and decayed totally.
Figure 2. HSE evaluation results.
Firmness
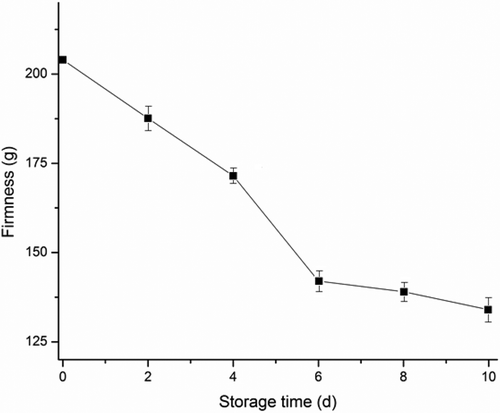
Firmness measurement results are displayed in . This index continuously declines during the whole measurement procedure. A possible explanation for this phenomenon is that the pectinase within strawberry completes the hydrolysis of pectin into soluble pectin acid during storage. Pectin and cellulose, comprising the main components of the cell wall, are separated, leading to the decline in strawberry firmness. Meanwhile, the pressure that cells endure decreases gradually. This factor also reduces the firmness index. Another factor is that the water percentage of the fruit samples gradually decreases. Strawberry physical structure gets softened and there develops a wrinkled skin without water support.
Figure 3. Firmness examination results.
Total soluble sugar
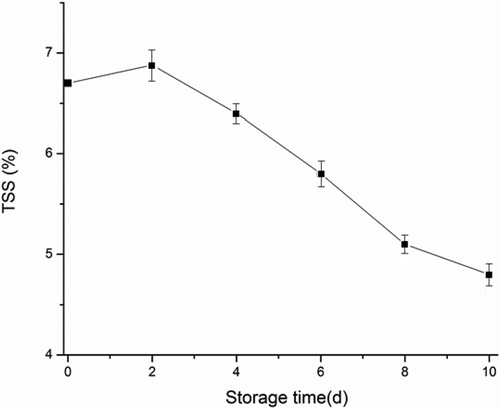
TSS is an important index in fruit-quality evaluation. Soluble sugar within strawberry includes glucose, sucrose, and fructose. Soluble sugar content continuously increases before harvest. However, the soluble sugar amount declines in storage after harvest. In this study, the strawberry TSS index decreases during experiment (see ). The TSS value is about 6.7% on day0t. On day2, TSS reaches about 6.9%. From day2 to day10, the TSS index continuously decreases. A possible explanation lies in the ripeness of strawberry, leading to individual respiration and metabolic activity. In addition, the solubilization of the cell wall polysaccharides and hemicelluloses in senescent strawberry samples might also contribute to the increase in TSS.
Figure 4. TSS examination results.
Reducing sugar content
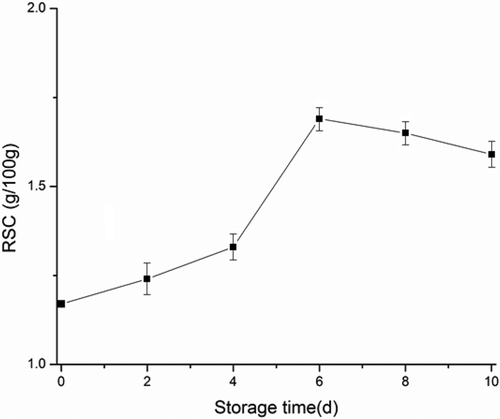
RSC examination results are displayed in . The RSC index increases on the first six days. After day6, RSC declines, and reaches about 1.6 g/100 g on day10. The decline in RSC possibly relates to the decay procedure during storage. A possible explanation lies in the increase of oxidized substances within the fruits, and the reducing sugars are continuously consumed, leading to the decrease of RSC. A mirror result has been reported by Kazim et al.[Citation29]
Figure 5. RSC examination results.
PCA results
AOS responses to samples are displayed in . The volatile gases existing in the headspace of samples are inhaled into the AOS gas chambers and sensed by the sensing materials equipped within the gas sensors. The specific gases absorbed by the function materials induce material changes in their electrical properties. And the responses rise in accordance with the increase of gas concentration. Thus the signals induced by electrical changes can be used to characterize gas species or concentration. Meanwhile, eight M.O.S sensors present various responses due to their different sensing abilities for specific gases. The sensor array generates different response patterns for samples with different qualities. All sensors’ initial responses to samples are close to zero. Then sensors’ responses gradually increase and finally reach their stable values. Sensor S4 presents the maximal value (about 0.02 V). The maximal value of S1 is about 0.02 V. S5, S7, and S6 are similar, and their maximal values are much lower than S4 and S1’s. S8, S3, and S2 present relatively weaker responses. In the following examinations, S1, S4, S5, S6, and S7 have much higher response values than the sensors of S2, S3, and S8.
Figure 6. Artificial olfactory system measurement (a); original responses to samples (b); PCA results to strawberry under different storage times.
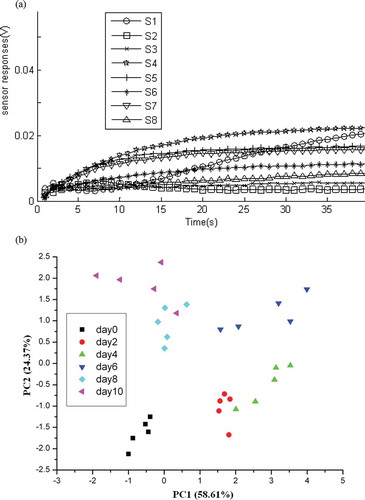
The PCA results are displayed in . The analysis is conducted by MATLAB software. The first principal components (PC1) and the second principal components (PC2) capture 82.98% of the data variance, indicating these two principal components contains most of the original sensing information. The PC1 values of different samples differ a lot. PC2 shows a similar change trend. Day 6 is a transition point during the storage. Some samples overlap in PCA scatter plotting. Therefore, the samples with different storage days can be approximately discriminated by the PCA method. However, this method is not suitable for the quantitative discrimination of strawberry.[Citation18,Citation19]
Development of the freshness predictive model
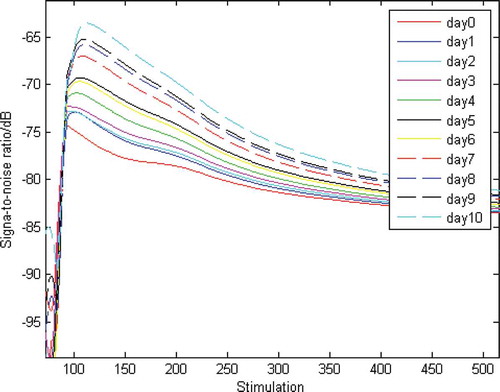
AOS measurement data SNR spectrum calculated by SR as a function of external noise intensity is shown in . Derivative values emerge before the formation of Eigen peaks of samples under different storage times. After that, the SNR value increases gradually with the increase of stimulating noise intensity. The Eigen peak appears at a noise intensity of 80. The SNR maximal values (MaxSNR) range between −76.42 and −65.20 dB. MaxSNR values increase with the increase of storage time. Samples under different storage times can be discriminated via MaxSNR values. MaxSNR values were selected as Eigen values, and the strawberry freshness determination model was developed after linear fitting (see and Eq. (7)). After one-step transform, Eq. (8) was used as the strawberry freshness predictive model.
Figure 7. Signal-to-noise ratio curve of artificial olfactory system measurement data.
According to the physical/chemical examination results, strawberry quality is acceptable before day4. After day4, the strawberry is not suitable for food. According to Eq. (8), AOS MaxSNR should be no more than −67.87908 dB if strawberry can be used as food. To validate the robustness of the predicting model, a group of samples with unknown storage time is examined by AOS. AOS measurement data SNR calculated by SR are input into Eq. (8) and the predicting values are calculated. The results indicate that the predictive accuracy of the developed model is 92%.
Conclusion
Strawberry freshness rapid determination method by using AOS was investigated in this paper. HSE, firmness, TSS, and RSC of the samples were examined to provide physical/chemical reference for the AOS system. Responses of the AOS system to strawberry samples under different storage times were measured. Strawberry storage time predicting model was (R2 = 0.98159). The quality threshold for AOS is −67.87908 dB. The results demonstrated that the predicting model presented an accuracy of 92%. The proposed method has some advantages including nondestructive, easy operation, rapid response, high accuracy, low cost, etc. This technique is promising in fruit-quality rapid analysis. We will carry out a long-term project to investigate the applications of this method in fruit nondestructive field analysis.
Funding
This work is supported by Research Project of Department of Education of Zhejiang Province (No. Y201534661).
Additional information
Funding
Related Research Data
References
- David, G.; Isolde, A.; Howard, Z.; Glenn, B.; Joseph, S.; Andrew, B. Validation of a Pulsed Electric Field Process to Pasteurize Strawberry Purée. Journal of Food Engineering 2015, 166, 384–389.
- Wang, Z.; Cang, T.; Qi, P.; Zhao, X.; Xu, H.; Wang, X.; Zhang, H.; Wang, X. Dissipation of Four Fungicides on Greenhouse Strawberries and an Assessment of Their Risks. Food Control 2015, 55, 215–220.
- Bermejo-Prada, A.; Segovia-Bravo, K.A.; Guignon, B.; Otero, L. Effect of Hyperbaric Storage at Room Temperature on Pectin Methylesterase Activity and Serum Viscosity of Strawberry Juice. Innovative Food Science & Emerging Technologies 2015, 30, 170–176.
- Przemyslaw, J.S.; Sandra, M.-P.; Antoni, S.; Ángel, A.C.-B.; Francisca, H. Quality Parameters, Bio-Compounds, Antioxidant Activity and Sensory Attributes of Spanish Quinces (Cydonia oblonga Miller). Scientla Horticulturae 2014, 165, 163–170.
- Nizar, T.; Houda, M.; Yassine, Y.; Ezzeddine, S.; Saloua, R.; Abdelhamid, K.; Nizar, N. Phytochemicals and Antioxidant Activities of Rhus tripartitum (Ucria) Fruits Depending on Locality and Different Stages of Maturity. Food Chemistry 2014, 160, 98–103.
- Fatih, M.; Nejat, Y. Classification of E-Nose Aroma Data of Four Fruit Types by ABC-based Neural Network. Sensors 2016, 16, 304.
- Qiu, S.; Wang, J.; Gao, L. Discrimination and Characterization of Strawberry Juice Based on Electronic Nose and Tongue: Comparison of Different Juice Processing Approaches by LDA, PLSR, RF, and SVM. Journal of Agricultural and Food Chemistry 2014, 62, 6426–6434.
- Prat, L.; Espinoza, M.I.; Agosin, E.; Silva, H. Identification of Volatile Compounds Associated with the Aroma of White Strawberries (Fragaria chiloensis). Journal of the Science of Food & Agriculture 2014, 94, 752–759.
- Arena, E.; Guarrera, N.; Campisi, S.; Asmundo, N.C. Comparison of Odor Active Compounds Detected by Gas-chromatography–Olfactometry between Hand-squeezed Juices from Different Orange Varieties. Food Chemistry 2006, 98, 59–63.
- Raj, V.B.; Singh, H.; Nimal, A.T.; Tomar, M.; Sharma, M.U.; Gupta, V. Effect of Metal Oxide Sensing Layers on the Distinct Detection of Ammonia Using Surface Acoustic Wave (SAW) Sensors. Sensors and Actuators B: Chemical 2013, 187, 563–573.
- Kim, J.-G.; Lee, T.-J.; Park, N.-C.; Park, Y.-P.; Park, K.-S. SAW Signal Conditioner-Based Dynamic Capacitive Sensor for High-Speed Gap Measurement. Sensors and Actuators A: Physical 2013, 189, 204–211.
- Campos, I.; Bataller, R.; Armero, R.; Gandia, J.M.; Soto, J.; Martínez-Máñez, R.; Gil-Sánchez, L. Monitoring Grape Ripeness Using a Voltammetric Electronic Tongue. Food Research International 2013, 54, 1369–1375.
- Guan, B.B.; Zhao, J.W.; Lin, H.; Zou, X.B. Characterization of Volatile Organic Compounds of Vinegars with Novel Electronic Nose System Combined with Multivariate Analysis. Food Analytical Methods 2014, 7, 1073–1082.
- Han, F.K.; Huang, X.Y.; Teye, E.; Gu, F.F.; Gu, H.Y. Nondestructive Detection of Fish Freshness during Its Preservation by Combining Electronic Nose and Electronic Tongue Techniques in Conjunction with Chemometric Analysis. Analytical Methods 2014, 6, 529–536.
- Liu, W.; Hui, G.H. Kiwi Fruit (Actinidia chinensis) Quality Determination Based on Surface Acoustic Wave Resonator Combined with Electronic Nose. Bioengineered 2015, 6, 1–9.
- Esteves, C.H.A.; Iglesias, B.A.; Li, R.W.C.; Ogawa, T.; Araki, K.; Gruber, J. New Composite Porphyrin-conductive Polymer Gas Sensors for Application in Electronic Noses. Sensors and Actuators B: Chemical 2014, 193, 136–141.
- Russo, M.; Di Sanzo, R.; Cefaly, V.; Carabetta, S.; Serra, D.; Fuda, S. Non-Destructive flavour Evaluation of Red Onion (Allium cepa L.) Ecotypes: An Electronic-nose-based Approach. Food Chemistry 2013, 141, 896–899.
- Yu, H.C.; Wang, J.; Xiao, H.; Liu, M. Quality Grade Identification of Green Tea Using Eigen Values of PCA Based on the E-nose Signals. Sensors and Actuators B: Chemical 2009, 140, 378–382.
- Pan, L.Q.; Zhang, W.; Zhu, N.; Mao, S.B.; Tu, K. Early Detection and Classification of Pathogenic Fungal Disease in Post-harvest Strawberry Fruit by Electronic Nose and Gas Chromatography-mass Spectrometry. Food Research International 2014, 62, 162–168.
- Arnon, H.; Zaitsev, Y.; Porat, R.; Poverenov, E. Effects of Carboxymethyl Cellulose and Chitosan Bilayer Edible Coating on Postharvest Quality of Citrus Fruit. Postharvest Biology and Technology 2014, 87, 21–26.
- Melgarejo, P.; Calín-Sánchez, Á.; Hernández, F.; Szumny, A.; Martíneza, J.J.; Leguaa, P.; Martíneza, R.; Carbonell-BarrachinaÁ, A. Chemical, Functional and Quality Properties of Japanese Plum (Prunus salicina Lindl.)As Affected by Mulching. Scientia Horticulturae 2012, 134, 114–120.
- Ali, A.; Muhammad, M.T.M.; Sijam, K.; Siddiqui, Y. Effect of Chitosan Coatings on the Physicochemical Characteristics of Eksotika II Papaya (Carica papaya L.). Fruit during Cold Storage. Food Chemistry 2011, 124, 620–626.
- AOAC International. AOAC Official Method 939.03, Sugars (Reducing and Nonreducing) in Flour Titrimetric Method First Action 1939, Final Action. 2013.
- Zhu, W.L.; Zhou, J.Z.; Xia, X.; Li, C.S.; Xiao, J.; Xiao, H.; Zhang, X.X. A Novel KICA-PCA Fault Detection Model for Condition Process of Hydroelectric Generating Unit. Measurement 2014, 58, 197–206.
- Zhou, C.J.; Wang, L.; Zhang, Q.; Xie, X.P. Face Recognition Based on PCA and Logistic Regression Analysis. Optik 2014, 125, 5916–5919.
- Dutta, R.; Das, A.; Stocks, N.G.; Morgan, D. Stochastic Resonance-Based Electronic Nose: A Novel Way to Classify Bacteria. Sensors and Actuators B: Chemical 2006, 115, 17–27.
- Gammaitoni, L.; Hanggi, P.; Jung, P.; Marchesoni, F. Stochastic Resonance. Review of Modern Physics 1998, 70, 223–287.
- Benzi, R.; Sutera, A.; Vulpiana, A. The Mechanism of Stochastic Resonance. Journal of Physics A 1981, 14, L453–L456.
- Kazim, G.; Emine, Ö. The Effects of Genotype and Growing Conditions on Antioxidant Capacity, Phenolic Compounds, Organic Acid and Individual Sugars of Strawberry. Food Chemistry 2014, 155, 298–303.