
ABSTRACT
The essential oil components of Iranian Anethumgraveolens L.(dill) were extracted using a Clevenger-type apparatus and microwave-assisted hydro distillation and analysed by gas chromatography-mass spectrometry. A multivariate curve resolution approach was used to overcome the problem of background, baseline offset, and overlapping/embedded peaks. Based on the results related to the GC-MS, 33 and 18 components for dill oil were extracted by hydro distillation and microwave-assisted hydro distillation, respectively. The numbers were extended to 64 and 55 components with concentrations higher than 0.01 g/100 g dry-solids using chemometric techniques. The results of this study showed that hydro distillation was suitable for extraction of β-phellandrene, O-cymen, 3, 6-Dimethyl-2, 3, 3a, 4, 5, 7a-hexahydrobenzofuran, Thymol, Germacrene D, Dill Apiole, 3-Octadecyne, and Phytol; and microwave distillation was suitable for the extraction of α-pinene and α-Phellandrene.
Introduction
Anethumgraveolens L. or dill belongs to the Apiaceae (umbelliferae) family and is an annual aromatic herb well known for medical and culinary applications since ancient times.[Citation1] Anethumgraveolens L.(dill) is believed to have originated in south-west Asia or south-east Europe.[Citation2] A variant called east Indian dill or sowa (AnethumsowaRoxb) is cultivated in India, Egypt, and Japan.[Citation1] Anethum grows up to 90 cm in height, with slender, alternate stem leaves, which are finally divided into three or four times slightly broader pinnate sections than similar leaves of fennel. Its yellow flower develops into umbels.[Citation3]
The well-known properties of dill as a traditional medicine such as carminative and diuretic have been reported.[Citation4,Citation5] Anethum stimulates milk flow in lactating mothers and is often given to cattle for this reason. Urinary and mental disorder and piles, too, can be cured by Anethum.[Citation6] The dill essential oil has hypo-lipidemic activity and can be a cardio-protective agent.[Citation7] In recent years, some pharmacological effects of dill such as antibacterial,[Citation8,Citation9] anti-micro-bacterial,[Citation10] antioxidant,[Citation11–Citation14] and cancer chemo-preventive[Citation15] activities have been reported.
Hydro distillation is the simplest and oldest technique for the extraction of essential oils from plants. The ability of microwave radiation to heat solid material effectively can also be used for obtaining essential oils. Thus, the herb is placed in a microwave chamber and irradiated with microwaves.[Citation16] Microwave-assisted methods have been increasingly used in the last few years especially for extraction.[Citation17–Citation21] The advantages of using microwave heating compared to conventional methods include a shorter extraction time, faster energy transfer, reduced thermal gradients within the matrix, and higher quality and quantity of the extract.[Citation22,Citation23] The rate and chemical composition of the essential oil may vary due to the application of different extraction methods, and the selection of a suitable extraction technique might be important in pharmaceutical industries.
Gas chromatography-mass spectroscopy (GC-MS) was used as a powerful tool for the analysis of volatile components. The components of essential oils are often determined by GC-MS, and their qualitative and quantitative analyses are based on the retention index of gas chromatography and mass spectra.[Citation24] Effective separation, however, is still the key to obtain information concerning components in complex samples, and, hence, great efforts are made to optimise experimental conditions. Unfortunately, despite such efforts, it is still difficult to separate all the components in complex samples. This is due to the existence of some overlapping/embedded peaks even under good separation conditions. This justifies a growing number of research in the challenging field of the resolution of overlapping signals.[Citation25–Citation32] Chemometricians have made considerable efforts to develop methods to resolve overlapping signals from complex samples. The multivariate curve resolution (MCR) has been shown to be a powerful tool for the investigation of complex chemical systems, particularly for the investigation of chemical systems about which there was little or no previous knowledge.[Citation33,Citation34] The MCR methods perform the decomposition of an experimental data matrix in the production of two simpler matrices, one related to the rows of the original data matrix (usually related to the changes in chemical composition) and another related to the columns of the original matrix (usually related to the measured instrumental or spectroscopic changes). The MCR methods can be divided into iterative and non-iterative types. Some non-iterative resolution methods consist of window factor analysis (WFA),[Citation35] sub-window factor analysis (SFA),[Citation36] and the heuristic evolving of latent projections (HELP).[Citation37] Two of the most widely used iterative methods were the iterative target transformation factor analysis (ITTFA)[Citation38] and the multivariate curve resolution-alternating least squares (MCR-ALS).[Citation39–Citation41] The alternating least squares (ALS) has emerged as an excellent algorithm to accomplish the goals of MCR because it can easily incorporate iterative procedures for constraint implementation.
Recently, several applications of MCR-ALS to solve HPLC co-elution problems have been reported. This chemometric method has been applied to solve co-elution problems in liquid chromatography with diode array detection (LC-DAD),[Citation42–Citation45] mass spectrometry detection (LC-MS),[Citation46,Citation47] and combined data from both detectors.[Citation48] MCR-ALS has also been applied to data acquired by gas chromatography with mass spectrometry detection (GC-MS)[Citation46] and capillary electrophoresis with diode array detection (CE-DAD).[Citation49–Citation51] The main goal of this work was to compare the rate and chemical composition of essential oils of dill cultivated in Iran, extracted with two distillation methods. Essential oils of dill were extracted with the hydro distillation and microwave-assisted hydro-distillation (MWAHD) techniques and determined using GC-MS under appropriate conditions. The preprocessing of data and the determination of the chemical rank were performed. The MCR-ALS method was used for qualitative and quantitative analyses. Finally, a comparison of the components of dill volatile oils extracted by hydro distillation and microwave-assisted hydro distillation (MWAHD) was done, and a suitable technique for the extraction of major components from dill essential oil was investigated.
GC-MS data are frequently resolved using multivariate curve resolution methods. The MCR-ALS method is an iterative resolution method developed by Tauler. The data matrices can be written as in Eq.(1), where D is the data matrix of mass spectra, and matrices C and S denote the pure concentration and spectral profiles of the A chemical components.
GC-MS analyses
A GC-MS analysis was carried out by an HP-Agilent 6890 gas chromatograph fitted with a fused silica HP-5MS capillary column (30*0.25 mm i.d.; film thickness 0.25 µm). The oven temperature was set at 50°C for 5 min, and then set to soar up to the programmed mode at 3°C min−1 to 240°C, and after that it was set on the other programmed mode, 15°C min−1 to 300°C, and held for 3 min. Other operating conditions were as follows: injector temperature, 290°C; carrier gas, He (99.99%) with flow rate 0.8 mL min−1. Injector type: split-less. The gas chromatograph was coupled with an Agilent 5973 mass selective detector. The MS operating parameters were an ionisation voltage of 70 eV; ionisation source temperature of 220°C; and an ionisation method of electron ionisation (EI).
Identification and data analysis
Identification of the components of dill volatile oils was based on calculating Kovats retention indices (RIs) and a comparison of their retention indices (RI) and mass spectra with those reported by data in the National Institute of Standards and Technology (NIST) library. A software, G1701DA MSD ChemStation, version D.00.00.38, was used for data collection and conversion to the ASCII format. Data analysis was performed using a Pentium5 HP Compaq personal computer. The computer package, MCRC, version 1.0, was used for chemometrics resolution. The library searches and spectral matching of the resolved pure components were conducted using the NIST MS data base.
Results and discussion
Qualitative analysis of dill cultivated in Iran
The total ion chromatograms (TICs) of the dill essential oils collected with two methods of extraction (hydro distillation and microwave-assisted hydro distillation) are shown in and , respectively. Two chromatograms demonstrate the complexity of the systems. The selected TICs show several overlapped peaks.
Figure 1. Total ion chromatograms of (a) hydro distillation by Clevenger-type apparatus and (b) microwave-assisted hydro distillation.
TICs were divided into 48 and 46 peak clusters for essential oils extracted by hydro-distillation and microwave-assisted hydro distillation (MWAHD), respectively, by using zero component regions with an elution sequence of two essential oils. Some of the sub-matrices were single component peaks, and other overlapped peaks had to be resolved into pure chromatographic profiles and mass spectra for quantitative and qualitative results.
To illustrate the resolution procedure, two peak clusters A and B that were related to the essential oils extracted with the hydro distillation and microwave-assisted hydro distillation techniques were selected respectively. The local TICs are shown in , . The sizes of matrices A and B were (60*281) and (70*281), respectively. The retention time of A was 16.630–16.942 (scan points: 2184–2243), and the retention time of B was 43.623–43.988 (scan points: 7288–7357).
Figure 2. Total ion chromatogram (TIC) of the selected peak cluster, (a) hydro distillation by Clevenger-type apparatus (b) microwave-assisted hydro distillation.
Before using the curve resolution, direct library searches for these peak clusters showed no components for peak clusters A and B. In this work, data preprocessing was done, and background correction was performed using the method of Liang et al.[Citation52] Then the morphological score method[Citation53] and the Savitzky-Golay[Citation54] filter were used for de-noising and smoothing, respectively. This step was necessary for obtaining accurate results. In the next step, chemical rank determination was done using the morphological score[Citation53] and subspace comparison.[Citation55] The plots of morphological score for peak clusters A and B are shown in and , respectively. These plots show that there are three components in both peak clusters A and B.
Figure 3. Morphological score plots, (a) peak cluster A and (b) peak cluster B.
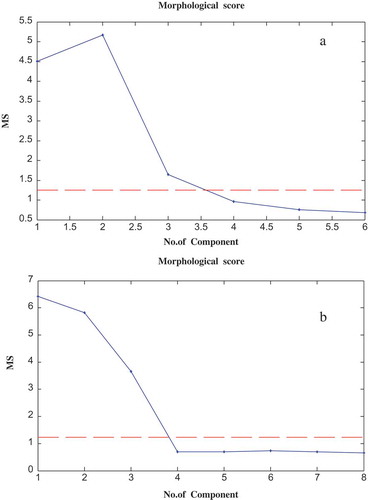
This was concluded by counting the number of singular vectors with a morphological score more than that of the noise levels. The results of using subspace comparison for peak clusters A and B are shown in and , respectively. These plots show the existence of three components in both A and B peak clusters.
Figure 4. Subspace comparison, (a) peak cluster A and (b) peak cluster B.
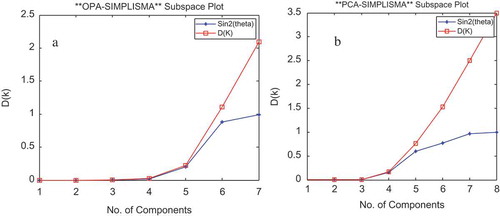
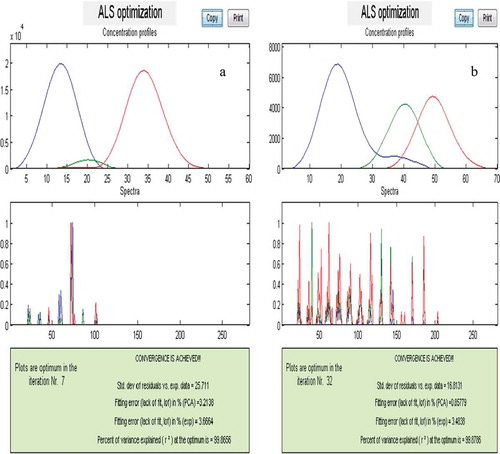
The results of subspace comparison were similar to the results of morphological score plots for the two peak clusters, A and B. Finally, the resolved pure chromatographic profile and mass spectra for each component were obtained using MCR-ALS. In the MCR-ALS window, with initial estimates of chromatographic profile obtained by EFA,[Citation56] some constraints such as non-negativity in concentration and mass spectra, unimodality in concentration, and normalisation were applied. and show the pure chromatograms and mass spectra obtained with MCRC software for peak clusters A and B, respectively.
Figure 5. Chromatographic profile and mass spectra, (a) peak cluster A and (b) peak cluster B.
After these steps, the identification of components was done by similar searches using the NIST mass database and verified with their retention indices. Resolved and standard mass spectra for components of peak cluster B, for example, have been shown in . The three components were identified with this technique in both peak clusters A and B.
Figure 6. Resolved and standard mass spectra for the selected peak cluster, (a) standard and (b) resolved mass spectra of β-Eudesmol, (c) standard and (d) resolved mass spectra f ɑ-Eudesmol, (e) standard and (f) resolved mass spectra of Juniper camphor.
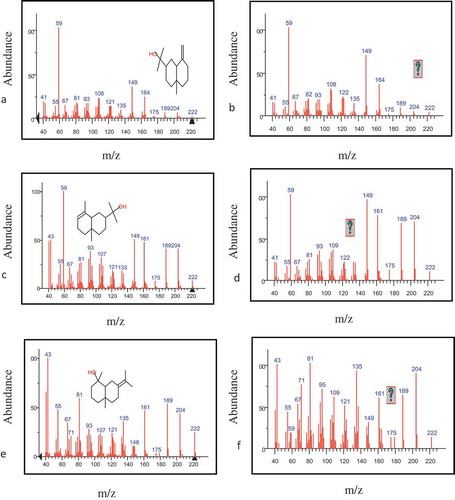
β-trans ocimene (0.03 g/100 g dry-solids) and Phenyl acetaldehyde (0.02 g/100 g dry-solids) existed in the peak cluster A, whileβ-Eudesmol (0.08 g/100 g dry-solids), ɑ-Eudesmol (0.06 g/100 g dry-solids), Juniper camphor (0.13 g/100 g dry-solids) existed in the peak cluster B. No data were found in library searches regarding any components for one of the identified components in peak cluster A with a concentration of 0.001 g/100 g dry-solids. Chemical components of dill essential oil extracted by the hydro distillation method are showed in . The components of dill essential oil extracted with microwave-assisted hydro distillation have been presented in .
Table 1. Chemical components of dill essential oil extracted with hydro distillation method.
Table 2. Chemical components of dill essential oil extracted with microwave-assisted hydro distillation method.
Quantitative analysis of chemical components of dill essential oil
After the extraction of pure chromatographic profile and mass spectrum for each component, the total two-way response for each component could be obtained from the outer product of its concentration and spectrum vectors. This quantitative method is called the overall volume integration (OVI).[Citation57] In this method, all mass spectral points are taken into consideration. The results present 64 and 55 components with a concentration higher than 0.01 g/100 g dry-solids for dill essential oil extracted by a Clevenger-type apparatus and microwave-assisted hydro-distillation shown to be 90.30% and 96.95% of the total oil, respectively.
The major chemical compounds that were found in the dill volatile oil from hydro-distillation by the Clevenger-type apparatus extraction method () were ɑ-Phellandrene (46.50 g/100 g dry-solids), β-Phellandrene (12.05 g/100 g dry-solids), O-Cymene (5.21 g/100 g dry-solids), 3,6-Dimethyl-2,3,3,a,4,5,7a-hexahydrobenzofuran (4.27 g/100 g dry-solids), DillApiole (3.98 g/100 g dry-solids), Thymol (3.22 g/100 g dry-solids), Germacrene D (3.13 g/100 g dry-solids).
The main constituent compounds that were found in the dill essential oil extracted by microwave-assisted hydro-distillation () were ɑ-Phellandrene (64.72 g/100 g dry-solids), β-Phellandrene (11.87 g/100 g dry-solids), O-Cymene (4.58 g/100 g dry-solids), 3,6-Dimethyl-2,3,3,a,4,5,7a-hexahydrobenzofuran (3.43 g/100 g dry-solids). compares components with a concentration higher than 1 g/100 g dry-solids in essential oil extracted by hydro-distillation and microwave assisted hydro-distillation. The suitable extraction method can be chosen on the basis of GC-MS combined with MCR-ALS analysis.
Table 3. Components of dill essential oils extracted by hydro distillation and microwave-assisted hydro distillation with concentration higher than 1 g/100 g dry-solids.
Microwave-assisted hydro distillation was suitable for the extraction of α-pinene and α-phellandren, and hydro distillation was suitable for extraction of β-phellandrene, O-cymen, 3,6-Dimethyl-2,3,3a,4,5,7a-hexahydrobenzofuran, Thymol, Germacrene D, Dill Apiole, 3-Octadecyne and Phytol. Without using the chemometrics technique and by direct library searching, Gamma Terpinene, Isoterpinolene, Phytol, and Sabinen were not observed in the dill essential oil extracted with microwave-assisted hydro distillation, while results from the MCR technique showed the existence of the mentioned components in essential oil from microwave-assisted hydro distillation with concentrations 0.05 g/100 g dry-solids, 0.39 g/100 g dry-solids, 0.13 g/100 g dry-solids, 0.13 g/100 g dry-solids, respectively.
It is significant that in the initial results of the GC-MS technique without the use of chemometrics, Sabinen existed in the essential oil of hydro distillation with a concentration of 0.16 g/100 g dry-solids, but this compound was not observed in the microwave-assisted hydro distillation, while, after using the MCR-ALS, the obtained results showed the existence of Sabinen with a concentration of 0.13 g/100 g dry-solids in the essential oil from the microwave-assisted hydro distillation but was not observed in the volatile oil from hydro distillation.
Conclusion
In this work, two methods, hydro distillation by a Clevenger-type apparatus and microwave equipment using the chemometrics resolution technique, were compared. Essential oils from the microwave-assisted hydro distillation were analysed with GC-MS, and component characterisation was performed with direct similarity searches in the MS database attached to the GC-MS instrument. Accurate results could be obtained after the application of the chemometrics technique due to the existence of overlapping peaks in the initial experimental data. A total of 64 and 55 components with concentrations higher than 0.01 g/100 g dry-solids were identified in the essential oils extracted with hydro distillation and microwave-assisted hydro distillation with the help of the chemometrics techniques, respectively. A suitable method of extraction was selected for extract of important constituents in dill essential oils.
Related Research Data
References
- Radulescu,V.; Popesco, M.L.; Ilies, D.C. Chemical Composition of the Volatile Oil from Different Plant Parts of Anethum graveolens L. (umbelliferae) cultivated in Romania. Farmacia 2010, 58, 594–600.
- Bailer, J.; Aichinger, T.; Hackl, G.; Hueber, K.D.; Dachler, M. Essential Oil Content and Composition in Commercially Available Dill Cultivars in Comparison to Caraway. Industrial Crops and Products 2001, 14, 229–239.
- Warrier, P.K.; Nambiar V.P.K.; Ramakutty, C. Indian Medicinal Plants; Vol.1. Orient Longman Limited: Arya Vaidya Sala, Kottakkal Madras, India, 1994; 153 pp.
- Hosseinzadeh, H; Karemi, G.R.; Ameri, M. Effects of Anethum graveolens L. Seed Extracts on Experimental Gastric Irritation Models in Mice. Journal of BMC Pharmacology 2002, 2, 21–30.
- Amin, W.M.; Sleem, A.A. Chemical and Biological Study of Aerial Parts of Dill (Anethum graveolens L.). Egyption Journal of Biomedical Sciences 2007, 23, 73–90.
- Nair, R.; Chanda, S. Antibacterial Activities of Some Medical Plants of the Western Region of India. Turkish Journal of Biology 2007, 31, 231–236.
- Hajhashemi, V.; Abbasi, N. Hypolipidemic Activity of Anethum graveolens in Rats. Phytotherapy Research 2008, 22, 372–375.
- Singh, G.; Kapoor, I.P.S.; Pandey, S.K.; Singh, U.K.; Singh, R.K. Studies on Essential Oils: Part 10, Antibacterial Activity of Volatile Oils of Some Spices. Phytotherapy Research 2002, 16, 680–682.
- Lopez, P.; Sanchez, C.; Batlle, R.; Nerin, C. Solid - and Vapor- Phase Anti Microbial Activities of Six Essential Oils: Susceptibility of Selected Food Borne Bacterial and Fungal Strains. Journal of Agricultural and Food Chemistry 2005, 53, 6939–6946.
- Stavri, M.; Gibbons, S. The Anti-mycobacterial Constituents of Dill (Anethum graveolens). Phytotherapy Research. 2005, 19, 938–941.
- Satyanarayana, S.; Sushruta, K.; Sarma, G.S.; Srinivas, N.; Subba Raju, G.V.; Antioxidant Activity of the Aqueous Extracts of Spicy Food Additives- Evaluation and Comparison with Ascorbic Acid in In-vitro Systems. Journal of Herbal Pharmacotherapy 2004, 4, 1–10.
- Lado, C.; Then, M.; Varga, I.; Szoke, E.; Szentmihalyi, K. Antioxidant Property of Volatile Oils Determinated by the Ferric Reducing Ability. Zeitschrift für Natur for Schung B 2004, 59c, 354–358.
- Taher, M.; Ghannadi, A.; Karmiyan, R. Effects of Volatile Oil Extracts of Anethum graveolens L. and Apium Graveolens L. Seeds on Activity of Liver Enzymes in Rat. Journal of Qazvin University of Medical Sciences 2007, 11, 8–12.
- Singh, G.; Maurya, S.; De Lampasona, M.P.; Catalan, C.Chemical Constituents, Antimicrobial Investigations, and Anti Oxidative Potentials of Anethum graveolens L. Essential Oil and Acetone Extract: Part 52. Journal of Food Science 2006, 70, 208–215.
- Zheng, G.; Kenney, P.M.; Lam, L.K.T.; Anethofuran, Carvone and Limonene: Potential Cancer Chemo Preventive Agents from Dill Weed Oil and Caraway Oil. Journal of Medicinal Plant and Natural Product Research 1992, 58, 339–341
- Handa, S.S; Khanuja, S.S; Longo, G.; Rakesh D.D. Extraction Technologies for Medicinal and Aromatic Plants; UNIDO International Centre for Science and High Technology (ICS): Trieste, 2008; 136 pp.
- Simoneau, C.; Naudin, C.; Hannaert, P.; Anklam, E. Comparison of Classical and Alternative Extraction Methods for the Quantitative Extraction of Fat from Plain Chocolate and the Subsequent Application to the Detection of Added Foreign Fats to Plain Chocolate Formulations. Food Research International 2000, 33, 733–741.
- Shu, Y.Y.; Ko, M.Y.; Chang, Y.S. Microwave-assisted Extraction of Ginseno Sides from Ginseng Root. Microchemical Journal 2003, 74, 131–139.
- Ramil Criado, M.; Rodriguez Pereiro, I.; Cela Torrijos, R. Optimization of a Microwave-Assisted Extraction Method for the Analysis of Polychlorinated Biphenyls in Ash Samples. Journal of Chromatography A 2003, 985, 137–145.
- Tomaniová, M.; Hajšlová, J.; Pavelka Jr, J.; Kocourek, V.; Holadová, K.; Klimová, I. Microwave-assisted Solvent Extraction -a New Method for Isolation of Polynuclear Aromatic Hydrocarbons from Plants. Journal of Chromatography A 1998, 827, 21–29.
- Pino, V.; Ayala, J.H.; Afonso, A.M.; González, V. Determination of Polycyclic Aromatic Hydrocarbons in Marine Sediments by High-Performance Liquid Chromatography After Microwave-assisted Extraction with Micellar Media. Journal of Chromatography A 2000, 869, 515–522.
- Eskilsson, C.S; Bjorklund, E. Analytical-scale Microwave-assisted Extraction. Journal of Chromatography A 2000, 902, 227–250.
- Ondruschka, B.; Asghari, J. Microwave-Assisted Extraction – A State-of-the-Art Overview of Varieties. CHIMIA International Journal for Chemistry 2006, 60, 321–325.
- Jalali-Heravi, M.; Zekavat, B.; Sereshti, H. Use of Gas Chromatography-mass Spectrometry Combined with Resolution Methods to Characterize the Essential Oil Components of Iranian Cumin and Caraway. Journal of Chromatography A 2007, 1143, 215–226.
- Shao, X.G.; Wang, G.O.; Wang, S.F.; Su, Q.D. Extraction of Mass Spectra and Chromatographic Profiles from Overlapping GC/MS Signal with Background. Analytical Chemistry 2004, 76, 5143–5148.
- Schostack, K.J.; Malinowski, E.R. Investigation of Window Factor Analysis and Matrix Regression Analysis in Chromatography. Chemometrics and Intelligent Laboratory Systems 1993, 20, 173–182.
- Manne, R.; Shen, H.L.; Liang, Y.Z. Sub-window Factor Analysis. Chemometrics and Intelligent Laboratory Systems 1999, 45, 171–176.
- Gemperline, P.J. A Priori Estimates of the Elution Profiles of the Pure Components in Over-Lapped Liquid Chromatography Peaks Using Target Factor Analysis. Journal of Chemical Information and Computer Sciences 1984, 24, 206–212.
- Kvalheim, O.M.; Liang, Y.Z. Heuristic Evolving Latent Projections- Resolving 2-Way Multi Component Data #1. Selectivity, Latent –Projection Graph, Data Scope, Local Rank, and Unique Resolution. Analytical Chemistry 1992, 64, 936–946.
- Shao, X.G.; Cai, W.S. Resolution of Resolution of Multi component Chromatograms by Window Factor Analysis with Wavelet Transform Preprocessing. Journal of Chemometrics 1998, 12, 85–93.
- Windig, W.; Guilment, J. International Self-modeling Mixture Analysis. Analytical Chemistry 1991, 63, 1425–1432.
- Windig, W. Spectral Data Files for Self-Modeling Curve Resolution with Examples Using the Simplisma Approach. Chemometrics and Intelligent Laboratory Systems 1997, 36, 3–16.
- Navea, S.; de Juan, A.; Taule, R. Modeling Temperature –Depent Protein Structural Transitions by Combined Near-IR and Mid-IR Spectroscopies and Multivariate Curve Resolution. Analytical Chemistry 2003, 75, 5592–5601.
- Jaumot, J; Escaja, N; Gargallo, R; Gonzalez, C; Pedroso, E; Tauler, R. Multivariate Curve Resolution: A Powerful Tool for the Analysis of Conformational Transitions in Nucleic Acids. Nucleic Acids Research 2002, 30, e92/1–e92/10.
- Den, W; Malinowski, E.R. Investigation of Copper (II)-ethylene Diamine Tetra Acetate Complexation by Window Factor Analysis of Ultraviolet Spectra. Journal of Chemometrics 1993, 7, 89–98.
- Manne, R; Shen, H.L.; Liang,Y.Z. Sub-window Factor Analysis. Chemometrics and Intelligent Laboratory Systems 1999, 45, 171–176
- Liang, Y.Z.; Kvalheim, O. M.; Keller, H.R .; Massart, D.L.; Kiechle, P.; Erni, F. Heuristic Evolving Latent Projections: Resolving Two-Way Multicomponent Data. 2. Detection and Resolution of Minor Constituents. Analytical Chemistry 1992, 64, 946–953.
- Essers, R.; Bosman, T.; Vandeginste, B.; Reijnen, J.; Kateman, G. Three-component Curve Resolution in Liquid Chromatography with Multi Wavelength Diode Array Detection. Analytical Chemistry 1985, 57, 971–985.
- de Juan, A.; Tauler, R. Chemometrics Applied to Unravel Multicomponent Processes and Mixtures. Revisiting Multivariate Resolution. Analytica Chimica Acta 2003, 500, 195–210.
- Tauler, R.; Smilde, A.; Kowalski, B.R. Selectivity, Local Rank, Three-Way Data Analysis and Ambiguity in Multivariate Curve Resolution. Journal of Chemometrics 1995, 9, 31–58.
- Jamout, J.; Gargallo, R.; de Juan, A.; Tauler, R.; A Graphical User-Friendly Interface for MCR- ALS: A New Tool for Multivariate Curve Resolution in MATLAB. Chemometrics and Intelligent Laboratory Systems 2005, 76, 101–110.
- Tauler, R.; Barcelo, D. Multivariate Curve Resolution Applied to Liquid Chromatography- Diode Array Detection. TrAC-Trends in Analytical Chemistry 1993, 12, 319–327.
- Lacorte, S.; Barcelo, D.; Tauler, R. Determination of Traces of Herbicide Mixtures in Water by On-Line Solid-Phase Extraction Followed by Liquid Chromatography with Diode-Array Detection and Multivariate Self-Modeling Curve Resolution. Journal of Chromatography A. 1995, 697, 345–355.
- Per´e-Trepat, E.; Hildebrandt, A.; Barcel´o, D.; Lacorte, S.; Tauler, R. Fast Determination of Complex Biocide Mixtures by Short Column LC-DAD and Multivariate Curve Resolution. Chemometrics and Intelligent Laboratory Systems 2004, 74, 293–303.
- Tauler, R.; Lacorte, S.; Barcelo, D. Application of Multivariate Self-Modeling Curve Resolution to the Quantitation of Trace Levels of Organo Phosphorus Pesticides in Natural Waters from Interlaboratory Studies. Journal of Chromatography A 1996, 730, 177–183.
- J.S. Salau, J.S.; Honing, M.; Tauler, R.; Barcelo, D. Resolution and Quantitative Determination of Coeluted Pesticide Mixtures in Liquid Chromatography–Thermo Spray Mass Spectrometry by Multivariate Curve Resolution. Journal of Chromatography A 1998, 795, 3–12.
- Peré-Trepat, E.; Lacorte, S.; Tauler, S. Solving Liquid Chromatography Mass Spectrometry Coelution Problems in the Analysis of Environmental Samples by Multivariate Curve Resolution. Journal of Chromatography A 2005, 1096, 111–122.
- Per´e-Trepat, E.; Tauler, R. Analysis of Environmental Samples by Application of Multivariate Curve Resolution on Fused High-Performance Liquid Chromatography-Diode Array Detection Mass Spectrometry Data. Journal of Chromatography A 2006, 1131, 85–96.
- R.M. Latorre, R.M.; Saurina, J.; Hernandez-Cassou, S. Capillary Electrophoresis and Electro Chromatography - Resolution of Overlapped Peaks of Amino Acid Derivatives in Capillary Electrophoresis Using Multivariate Curve Resolution Based on Alternating Least Squares. Electrophoresis 2000, 21, 563–572.
- Sentellas, S.; Saurina, J.; Hernandez-Cassou, S.; Galceran, M.T.; Puignou, L. Determination of Ebrotidine Metabolites in Overlapping Peaks from Capillary Zone Electrophoresis Using Chemometric Methods. Electrophoresis 2001, 22, 71–76.
- Li, H.; Zhang, F.; Havel, J. Quantification of Analytes in Overlapping Peaks from Capillary Electrophoresis Using Multivariate Curve Resolution-Alternating Least Squares Methods. Electrophoresis 2003, 24, 3107–3115.
- Kvalheim, O.M.; Liang, Y.Z. Heuristic Evolving Latent Projections: Resolving Two-Way Multi Component Data. 1. Selectivity, Latent-Projective Graph, Data Scope, Local Rank, and Unique Resolution. Analytical Chemistry 1992, 64, 936–946.
- Shen, H.; Stordrange, L.; Manne, R.; Kvalheim, O.M.; Liang, Y.Z. The Morphological Score and Its Application to Chemical Rank Determination. Chemometrics and Intelligent Laboratory Systems 2000, 51, 37–47.
- Brereton, R.G. Chemometrics: Data Analysis for the Laboratory and Chemical Plant; Wiley: New York, 2002.
- Shen, H.; Liang, Y.Z.; Kvalheim, O.M.; Manne, R. Determination of Chemical Rank of Two-Way Data from Mixtures Using Subspace Comparisons. Chemometrics and Intelligent Laboratory Systems 2000, 51, 49–59.
- Maeder, M. Evolving Factor Analysis for the Resolution of Overlapping Chromatographic Peaks. Analytical Chemistry 1987, 59, 527–530.
- Gong, F.; Liang, Y.Z.; Cui, H.; Chau, F.T.; Chan, B.T.P. Determination of Volatile Components in Peptic Powder by Gas Chromatography–Mass Spectrometry and Chemometric Resolution. Journal of Chromatography A 2001, 909, 237–247.