
ABSTRACT
Magnetic resonance imaging (MRI) is a non-invasive imaging technique that can visualise samples’ interior by using the signal coming from mobile protons. The aim of this study was to examine the effects of oil content and peanut/raisin addition on cake quality and to illustrate the power of MRI in analysis of moisture and oil distribution. For this purpose, MR images were acquired with a spin echo sequence and relaxation times T1 and T2, and moisture content and firmness of cakes were measured. High oil cakes (HOC) had higher moisture content and lower firmness than low oil cakes (LOC). However, addition of raisin/peanut did not affect the firmness of cakes significantly. In MR images, HOC cake crumb, owing to its higher oil content, displayed larger signal intensities. Signal acquired from different slices demonstrated an increase in moisture content from crust to centre of the cakes. Peanut and raisin signals were suppressed in fat and water suppression sequences, respectively. Significant correlation between transverse relaxation time (T2a) and oil content (R2 = 0.99) was found. Moreover, longitudinal relaxation time (T1) was found to be strongly correlated with moisture content (R2 = 0.99). The results demonstrated MRI’s power as an accurate and non-invasive analysis method in baking.
Introduction
There are countless different cake formulations, but almost all cake batters are obtained by mixing of flour, eggs, fat/oil, water, and sugar. Each of these ingredients play essential roles in forming the final structural, sensorial, and textural attributes of the cake. Mixing of these ingredients results in the formation of a stable oil-in-water emulsion that is viscous enough to entrap gas bubbles and preserve them during baking.[Citation1,Citation2] The combined effect of starch gelatinisation and protein denaturation accompanied by the presence of other ingredients convert the liquid cake batter into a solid foam that is referred to as cake.[Citation3,Citation4] The multiple functions fat plays in cakes such as aiding in entrapment of air or providing a desirable mouth-feel highlight the role of fat content in defining cake’s final properties. Reduction or an increase in fat portion of a formulation can have adverse consequences on taste, texture, and volume.[Citation5] Addition of other ingredients such as chocolate chips, confectionary, seeds, nuts, and dried fruits are quite common in cake production. However, the moisture or fat transfer from these ingredients to the batter could change batter composition and have undesirable consequences.
Moisture and fat content and distribution directly influence textural properties such as softness of crumb and crispness of the crust as well as shelf life. Water also plays an essential role in chemical changes that occur during baking (e.g., Maillard browning, starch gelatinisation).[Citation6] However, a visual analysis of cake’s inner structure or measurement of moisture or oil distribution is often damaging to the sample. Placement of invasive measurement probes inside the dough can interfere with the dough’s normal baking procedure and introduce a bias by causing an unstable crumb to collapse or shrink.[Citation7] Magnetic resonance imaging is a non-invasive imaging technique than is traditionally used in medical applications for visual assessment of biological tissues. This method distinguishes different components in a sample depending on their relaxation rates and uses this difference to constitute a contrast in the image.[Citation8] MRI instruments’ high investment and running costs and large space occupation greatly limit their utilisation for research purposes. However, the recent advancements in technology and the method’s promising results have increased the popularity of low field benchtop H1 Nuclear Magnetic Resonance (1H NMR) devices that do not provide an image yet still can give invaluable information on samples via analysis of magnetic relaxation times (T1 and T2) which are intrinsic properties of substances.[Citation8] MRI has been used in multiple studies for imaging purposes in monitoring and quantifying volumetric changes such as dough expansion, crust formation, porous structure, and amount of local densifications[Citation6,Citation9,Citation10]; yet the method’s capability of showing moisture and fat distribution has still not been widely utilised in baking.[Citation7] There has been studies that investigated the moisture and oil distribution in fried food products as oil content is one of the most important attributes of such products; gelatin gels and confectionery products such as chocolate are where the migration of oil to the chocolate surface was mathematically quantified using MRI.[Citation11–Citation18] However, the effect of different ingredients on the moisture and oil distribution of baked products through a technique where visual information could be used for quantification purposes has not been widely explored. Therefore, in this study, it was aimed to investigate the effect of oil content and peanut/raisin addition on cake’s final structure; to demonstrate the potential of MRI in visual assessment of cake’s inner structure; to monitor moisture and oil distribution; and to estimate moisture and oil content via the relaxation times of T1 and T2.
Material and methods
Materials
Cake flour was obtained from Basak Flour Factory Inc. (Ankara, Turkey). Egg white powder was provided from ETI Food Industry Co. Inc. (Eskisehir, Turkey). Other ingredients like sugar, non-fat dry milk (Bağdat Baharat, Ankara, Turkey), salt, sunflower oil (Yudum, Istanbul, Turkey), and baking powder (Dr. Oetker, Istanbul, Turkey) were bought from local markets in Ankara. Raisin and air roasted peanuts were purchased from local markets in Ankara.
Cake batter formulation based on flour weight was 100% sugar, 9% egg white powder, 12% non-fat dry milk, 3% salt, 5% baking powder, 100% water and sunflower oil at different ratios (75, 100, and 125%). Cakes containing 100% oil were used as control, while 75% and 125% oil containing cakes were low oil cakes (LOC) and high oil cakes (HOC), respectively. For raisin cakes (RC) and peanut cakes (PC), 4 gram of raisin or peanut was added to control cake batter (100% oil).
While preparing cake batter, all dry ingredients (sugar, egg white powder, non-fat dry milk, salt, baking powder, flour) were mixed with mixer (Kitchen Aid, 5K45SS, USA) for 1 min at low speed (85 rpm). Then, water was added and mixed for 1 min at low speed (85 rpm), then 2 min at high speed (140 rpm), and finally 1 min at low speed (85 rpm). Baking was performed in electrical oven (Arçelik A.S., Istanbul, Turkey) at 200°C for 6 min. Before analysis, cakes were kept at room temperature to reach equilibrium for 1 h.
Moisture content and weight loss measurements
Moisture content of cakes was measured using moisture analyser (IR-35, Denver Instrument). Results were expressed on dry basis. The percentage weight loss of cakes was calculated by using the weight of cake batter (Wbatter) and weight of cake sample just after baking (Wcake). Percent weight loss of cake samples was calculated using the Eq. 1:
where Wbatter represents initial weight of cake batter (g), and Wcake represents weight of cake sample (g) just after baking.
Firmness
Firmness of cakes was evaluated by the Texture Analyzer (The TA.X TPlus, England). Samples were compressed to 25% of their original height at a speed of 55 mm/min. A cylindrical probe with a diameter of 10 mm and a load cell of 50 N was used for measurements.
Magnetic resonance imaging
Proton density weighted and water/fat suppression spin echo images
MRI experiments were conducted at Bilkent University National Magnetic Resonance Research Center (Ankara, Turkey) with a 3.0 T (123.5 MHz) system (Siemens, Germany). Coronal MR images of cakes were acquired with a Spin Echo (SE) sequence using five slices with slice thickness of 2 mm, field of view (FOV) of 140, matrix size of 256 × 256, number of excitation steps (NEX) of 1, and echo time (TE) and repetition time (TR) of 12 and 1000 ms, respectively. Echo time and repetition time were set after preliminary measurements of T1 and T2 of the samples to ensure the images were proton density weighted. TR was set to 1000 ms to which provided sufficient delay for the longitudinal magnetisation to almost totally recover (99% recovery) to its initial value (TR≥5T1) before application of another radio frequency (RF) pulse signal. Different cake samples were placed at different rows, and cakes at the same row (next to each other) were replicates. Water suppression and fat suppression images were acquired by using the instrument’s built-in sequences with a TR of 600 ms and TE of 12 ms. Image analysis was conducted using Radiant Viewer (Medixant, Poland) and Matlab (Mathworks, USA).
Transverse relaxation time (T2) measurements
Multi Slice Multi Echo (MSME) sequence was used to obtain coronal T2 maps of the cakes. A T2 map is an MR image with each voxel showing the T2 values rather than the signal intensity. Measurements were conducted with the parameters; TR = 600 ms, TE = 13.8 ms, echo number = 32, slice number = 3. MSME is a spin echo sequence, which increases the echo time after each experiment resulting in an exponentially decaying signal for each voxel in the image. Mean T2 data (T2a and T2b) were extracted by fitting the decaying signal to a bi-exponential function using Matlab (Mathworks, USA).
Longitudinal relaxation time (T1) measurements
Coronal T1 maps of the samples were obtained using a Gradient Echo (GRE) based sequence with the parameters; TR = 15 ms and TE = 1.81 ms. Images were acquired at two different flip angles (9° and 50°). Using the signal intensities from these two flip angles, T1 maps were obtained by the software of the instrument (Magnetom, Siemens, Germany).
Statistical analysis
Moisture, weight loss, and firmness measurements were carried out in triplicates, whereas MR measurements were performed in duplicates. To compare the means of measurements, analysis of variance (ANOVA) with Tukey’s multiple range test was used.
Results and discussion
Moisture content of cakes
shows the moisture content of cakes after baking. Though initially all cake batters were at the same moisture content, different formulations lost varying amounts of water during baking which resulted in differences on the final moisture contents given in . High oil cake (HOC) had the highest moisture content, whereas the low oil cake (LOC) and raisin cakes (RC) displayed significantly lower moisture contents (p < 0.05). Fat/oil content is known to be a significant factor influencing moisture retention capability during baking. Higher fat content is known to aid in retaining moisture in bakery products.[Citation19] Seyhun et al. (2005) observed the highest amount of water loss from the cakes formulated without fat and also an increase in moisture retention with increasing fat content. This also explains the lower moisture content of LOC.
Table 1. Physical characteristics and relaxation times of cakes containing different formulations.
Moisture content of peanut cakes was not significantly different from control cakes (p > 0.05). Peanut cakes had the same formulation with control cakes, which shows that peanut addition did not affect moisture preservation capability of batter. However, raisin cakes displayed significantly lower moisture contents than peanut cakes despite having the same amount of oil and water in formulation. The raisins have a lower moisture content (14.5% by wt) and higher hygroscopicity (owing to its high reducing sugar content) compared to cake crumb.[Citation20] There appeared to be an osmosis-driven moisture transfer from cake batter to raisins, which resulted in a decreased level of moisture in raisin cakes’ crumb. Only crumb of the cakes was taken for moisture measurements in order to minimise bias coming from sample heterogeneity (by inclusion of peanuts or raisins) and to more closely observe the changes in cake batter. The fact that RC samples lost significantly lower amount of weight during baking (8.11%) compared to control (10.19%) yet had a lower final moisture content in cake crumb also indicated a possible moisture transfer from cake batter to the raisins. This observation was supported by MR images of cakes, which showed that raisins had higher signal intensities than cake crumb despite raisins’ initial lower moisture content ( and ).
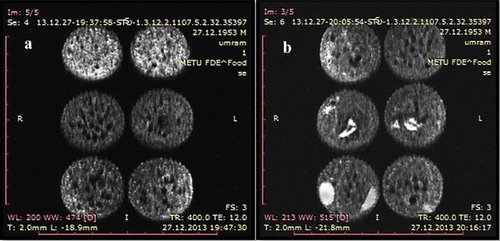
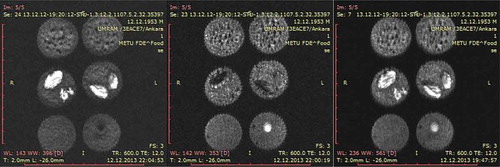
Figure 1. Proton density weighted SE images of cakes with different formulations. (a) Cakes with different oil content. Top: High oil cake, middle: Low oil cake, bottom: Control cake. (b) Cakes with peanut/raisin. Top: Control cake, middle: Raisin cake, bottom: Peanut cake. *Cakes in the same row are replicates.
Firmness measurements
Firmness measurements are given in . Peanut and raisin addition to cakes did not have a significant effect on cake texture, as firmness of peanut and raisin cakes was not significantly different from the control cakes (p > 0.05). This indicated that there was negligible oil transfer between the cake batter and peanut/raisin; and moisture transfer was not prominent enough to affect firmness. Nevertheless, it was clear from the that oil content of the formulation had a major impact on cake texture. Firmness of cakes decreased with increasing oil content. As a matter of fact, a 25% increase in oil content resulted in 86% decrease in cake firmness. Firmness is related with both moisture and oil content of cakes.[Citation21,Citation22] It was expected for HOC with the highest moisture and oil content to display the lowest firmness. The tenderising effect of fats and oils is well known.[Citation23,Citation24] In a cake system, oil has three major functions: to entrap air during the creaming process, to physically separate the starch and protein particles, and to emulsify the liquid in the formulation.[Citation25] Oil content increases the amount of air entrapped into the cake batter, and firmness decreases with increasing air entrapment. During batter preparation, air is actually entrapped inside the liquid oil. Therefore, for proper air incorporation and texture development, the amount of fat/oil used and the solid fat content (SFC) of the fat is crucial.[Citation25]
MR images and signal intensity measurements
MR images of cakes are given in and . Brighter areas in the images are associated with higher signal intensities (SI). Depending on the parameters (TR and TE) chosen, the signal intensities can be used to gain information on the content, state, compartmental structure, and mobility of water and oil as well as their interaction with the surrounding matrix. The chosen TR and TE (TR = 1000 ms, TE = 12 ms) ensured that the images are proton density weighted, meaning the changes in signal intensities were mostly related with water and oil content. This made it possible to map the moisture: oil distribution inside the cakes along with the observation of porosity (as air gives no signal in MR, which makes pores identifiable as black spots).
Proton Density Weighted Spin Echo (SE) images
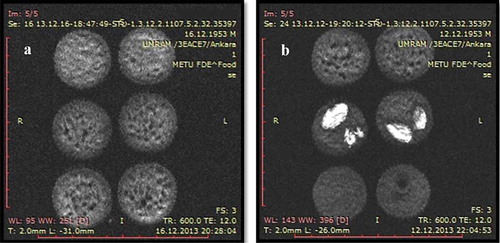
As seen in , HOCs had higher signal intensities (brighter in images) (top), and LOCs (middle) had lower signal intensities than control (bottom). This was the result of higher oil content giving higher signal in MRI. Higher signal intensity resulting from the increase in oil content has also been observed in other studies. Cikrikci and Oztop (2017) observed that as peanut butter migrates to the chocolate, it resulted in increase in signal intensity which enables the quantification of migration rate in the system.[Citation16] Additionally, the higher moisture content of HOCs also contributed to this result. Peanut and raisin cakes’ MR images can be seen in . Peanuts and raisins, due to their high fat and moisture content respectively, can be seen as bright spots in the images. Raisins appear much brighter than cake crumb despite initially possessing a much lower moisture content (14.5% by wt for raisins, 24.5% by wt for crumb), which confirms the transfer of moisture from the crumb to the raisins. Mean SIs of the crumb of control, raisin, and peanut were not significantly different (p > 0.05). This was to be expected as batter formulations of these samples did not differ from control and the moisture and/or oil transfer was not significant enough to affect the SIs of the crumb.
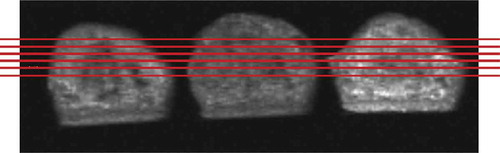
Measurements were taken in five slices, with slice one starting from the top of the cakes and slice five ending at the middle portion of the cake’s height (shown in ). Water and oil combination seems to be homogenously distributed throughout the cakes in radial direction. Oil seems to compensate for the spots with less moisture (displaying equally distributed SIs throughout each slice) and vice versa. However, when slices were compared to one another, it was observed that from slice 1 (at the top) to slice 5 (at the centre), there was an increasing trend in mean signal intensities (). This trend was observed clearly for all empty cakes (control, LOC, and HOC). Slice 1 covers a higher amount of cake crust than the other slices and displayed the lowest signal intensities in all cakes. This trend signifies a moisture and/or oil gradient inside the cakes. For cakes baked in a conventional oven, it is expected for the cakes to have a higher moisture content next to the centre inside the crumb and a lower moisture content closer to the crust.[Citation7,Citation9,Citation26] In conventional ovens, cakes are cooked via combined mechanisms of convection and radiation from the outside and via conduction on the inside. Heating taking place from outside and water evaporation being driven from the inside to the outer air gives rise to the moisture gradient observed.[Citation6]
Figure 2. Sagittal MR images of cakes (TR = 1000, TE = 12 ms) showing slice positions of coronal images. Slice 1 to 5 descending from top to middle.
A similar trend could not be observed in PC and RC slices. This was most likely related with the heterogeneity introduced by raisins and peanuts unequally distributed inside the cakes. The mean signal intensity of a raisin or peanut is approximately 5–8 times larger than mean SIs of crumb, and thus the presence of these interferes with the results makes it impossible to quantify the fat or moisture distribution between slices.
Fat suppression SE images
By using a proton density weighted fat suppression sequence, it is possible to kill all the signals coming from the fat and ensure that the images only show the distribution of water. Use of fat images to extract information about water/oil content was also explored in previous studies.[Citation27,Citation28] Fat suppression SE images are given in . The SIs of fat suppression images were highly correlated with moisture content data (R2 = 0.99). The high correlation between moisture content and image SIs demonstrates MRI’s accuracy in estimation of moisture content. Similar to SE images, going from slice 1 to slice 5, the mean SIs displayed an increasing trend, which means the increase in SI in SE images is partly due to uneven moisture distribution throughout the cake’s height, as mentioned previously. As seen in , in fat suppression images, peanuts could not be observed. This signifies that whole signal coming from peanut was due to its fat content as peanuts were roasted and had very low moisture content (1.8% by wt). The raisin signal on the other hand was unaffected, which similarly signifies that raisin signal was only due to water since raisins contain almost no fat.[Citation20] These also confirmed that the fat suppression images were water maps of the cakes. Moisture increases getting closer to the centre of the cakes and is lower near the crust. This result could not be observed in SE images as the signal from fat interfered with the water signal and oil replaced the empty voids caused by moisture migration and/or evaporation, which resulted in a uniform SI distribution in SE images.
Figure 3. Fat suppression SE images of cakes with different formulations. (a) Cakes with different oil content. Top: High oil cake, middle: Low oil cake, bottom: Control cake. (b) Cakes with peanut/raisin. Top: Control cake, middle: Raisin cake, bottom: Peanut cake. *Cakes in the same row are replicates.
Water suppression SE images
Water suppression SE images are given in and . Overall signal to noise ratio (SNR) of water suppression images turned out to be higher than the fat suppression images. This means that the overall SE signal was owing to oil content rather than the water. Correlation of SIs of water suppression images and oil contents yielded a Pearson correlation coefficient of 0.92. In water suppression images, PC samples showed the highest mean SI values, as peanut signal was not affected from water suppression. On the other hand, when the water is suppressed, contrary to fat suppression images where peanut signal was killed, this time raisins could not be seen, which further confirmed the method’s accuracy in distinguishing signal from fat and water. In , it is possible to see fat suppression, water suppression, and SE images side by side, for the same slice (slice 5 from the centre). From left to right, raisins cannot be observed (dark spots) in the fat suppression image, peanuts are not visible in the water suppression image, and both are clearly observable in SE images. As marked in , oil seems to have formed small clumps near the surface of the cakes. The distribution of oil seems to follow an opposite trend with water, accumulating closer to the surface.
Figure 4. Water suppression SE images of cakes with different formulations. (a) Cakes with different oil content. Top: High oil cake, middle: Low oil cake, bottom: Control cake. (b) Cakes with peanut/raisin. Top: Control cake, middle: Raisin cake, bottom: Peanut cake. *Cakes in the same row are replicates.
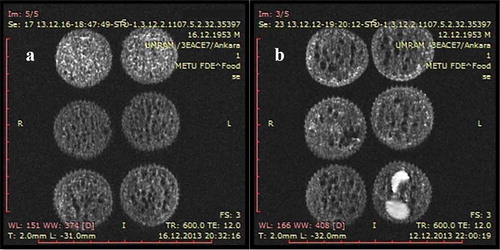
Figure 5. SE images of cakes with peanut/raisin. Top: Control cake, middle: Raisin cake, bottom: Peanut cake. Fat suppression SE images (left), water suppression SE images (middle), proton density weighted SE images (right). *Cakes in the same row are replicates.
Transverse relaxation time (T2) measurements
lists the mean T2 relaxation times of cakes. The relaxation of transverse magnetisation is defined by an exponential relation. T2 relaxation time is the time constant governing the decay of transverse magnetisation by transfer of magnetisation energy between adjacent spins.[Citation8] A bi-exponential relaxation behaviour was found to more suitably represent the relaxation of cakes, which means cakes have two components that illustrated two distinct relaxation rates. The relaxation times were given as T2a and T2b. Any component that contains hydrogen atoms contributes to the MR signal and thus can be magnetised and relaxed at a different rate. However, by setting an echo time (TE) of 14 ms, it was ensured that the signal only comes from the mobile protons, which, in our case, was majorly dominated by protons from oil and water.[Citation29] Pure oils have a T2 of around 150 ms,[Citation30] whereas bulk water has a T2 of 2500–3000 ms.[Citation31] Nevertheless, in the case of water, the T2 time varies inside a very wide spectrum with 3000 ms beings the upper end. Changes in the state and mobility of water can carry this value even down below 10 ms.[Citation32] General qualitative nature of the observations on the mobility of water has led to the use of some ill-defined terms such as ‘bound’, ‘free’, ‘immobilised’, ‘structured’, and so forth. Water molecules upon contact with macromolecules containing hydrophilic groups forms hydrogen bonds with polar sorption sites of the rigid macromolecules, which causes formation of a monolayer of water that is almost completely immobilised. This layer represents one end of the spectrum, which frequently is regarded as ‘bound’ water. Water molecules that do not form any bonds and are not restricted by any physical interaction can be regarded as ‘free’ water.[Citation33] Water molecules that align with the first immobilised monolayer form hydrogen bonds with the water molecules that were tightly bound to the macromolecules and a tertiary layer bind to the secondary layer and so on. These intermediate water layers all lie between the two ends of the spectrum and are partly immobilised.[Citation32,Citation33] T2 relaxation times of water in a system can be utilised to quantify the mobility of water.[Citation34]
Considering the T2a and T2b results, T2a in cakes was associated with oil, and T2b was associated with water. Cakes were composed of an abundance of components that interacted favourably with water such as starch, sucrose, and proteins. Water inside that cakes was entrapped within the continuous gel network formed by gelatinisation of starch and was tightly associated with the gluten matrix that forms the bulk of the cake.[Citation35,Citation36] This explains why the T2b times range between 17 and 25 ms. T2a was most likely the relaxation time of oil. Pure oil normally has a relaxation time of around 150; yet the presence of emulsifiers increases the proton exchange between different components and brings the two components’ relaxation rate closer.[Citation30] Cake batter is an oil-in-water emulsion stabilised by egg lecithin; hence, the lower T2 times of ‘bound’ water, the lower T2 times for oil owing to increased proton exchange rates due to presence of emulsifiers adsorbed on the interface.[Citation37] Apart from proton exchange environment, oil relaxation time (T2a) is also shaped by the amount of oil in a system, increasing with increasing oil content.[Citation33,Citation36] The correlation between T2a times and oil content (by wt) yielded a Pearson correlation coefficient of over 0.99. Higher correlation between T2 and oil content was also observed in another study where moisture and oil distribution in fried chicken nuggets with different coating materials was explored.[Citation38] T2a times of the cake samples were also found to be strongly correlated with firmness values for empty cakes (R2 = 0.93). RC and LOC with marginally lower moisture contents also displayed the lowest T2b values. Transverse relaxation of raisin and peanuts inside the cakes were better identified with a mono-exponential relation, and the mean T2 times were found to be 95 ms and 127 ms for raisin and peanuts, respectively. T2 times of peanuts were quite close to T2 times of fat, which was to be expected as almost whole signals from peanuts were acquired from fat, as mentioned in discussion of fat/water suppression images. Raisins’ increased moisture content after moisture sorption from cake crumb was evident in the higher T2 time compared to the crumb. Also, raisins being almost devoid of bulky macromolecules, which left sugars as the only molecules to restrict water’s mobility could have contributed to the higher T2 time.
Longitudinal relaxation time (T1) measurement
Overall T1 relaxation times are listed in . T1 relaxation times govern the relaxation rate of transverse magnetisation and are a measure of the magnetic energy transfer efficiency between the protons and the surrounding lattice and hence called spin-lattice relaxation time. Similar to T2 times, T1 times are effected by the variations in the ability of macromolecules to ‘bind’ water molecules. Yet, some systems are more sensitive to T1 variations and differentiated better with T1 changes. However, T1 is most frequently used in analysis of moisture distribution of tissues as it is shown to correlate well with it.[Citation34,Citation39] T1 times of RC and PC cakes were not significantly different from control (p > 0.05) (around 170 ms). This indicated that cake crumb composition was the dominant factor influencing T1 times. T1 time of HOC, which possessed the highest moisture content, also had the highest T1 time (32% higher than control). As a matter of fact, T1 times were found to be strongly correlated with moisture content (R2 = 0.993). There are numerous studies in literature that explain moisture-related changes with T1 relaxation times.[Citation7,Citation39,Citation40]
Conclusion
The results of this study have shown that by use of suitable sequences and parameters, it is possible to acquire images that map moisture or oil distribution as well as quantitatively measure mobility of water and water/oil content by coming up with relations that relate these data to MR relaxation times, T1 and T2. Though high field MR scanners’ high investment and running costs limit their utility in research and industrial applications, NMR relaxation times T1 and T2 that could also be measured by low field and affordable 1H NMR devices also yielded promising results. Both MRI images and NMR relaxation times proved to be powerful tools in analysis of bakery products and be strong alternatives to current methods, especially in measuring moisture/oil distribution and monitoring the inner porous structure. However, it is worth mentioning to state that addition of other ingredients such as different hydrocolloids (i.e., gums) to the formulation or use of different flour types could also affect the structure and thus be explored through MRI, as the water binding ability and consequently the relaxation times would be affected in the presence of such ingredients.
Acknowledgements
The authors gratefully acknowledge Bilkent University National Magnetic Center (UMRAM), Ankara, Turkey for providing the opportunity to use the MRI scanner. We would also like to thank Mutlu Yucekutlu (MSc.) for her contribution to the study.
References
- Conforti, F.D. Cake manufacture. In Bakery Products: Science and Technology; Hui, Y.H., Eds.; Blackwell Publishing: Ames, Iowa, USA, 2006; 393–410.
- Wilderjans, E.;Pareyt, B.;Goesaert, H.;Brijs K.;Delcour, J.A. The Role of Gluten in a Pound Cake System: A Model Approach Based on Gluten-Starch Blends. Food Chemistry 2008, 110, 909–915.
- Wilderjans, E.;Luyts A.;Goesaert, H.;Brijs K.;Delcour, J.A. A Model Approach to Starch and Protein Functionality in a Pound Cake System. Food Chemistry 2010, 120, 44–51.
- Wilderjans, E.;Luyts, A.;Brijs, K.;Delcour, J.A. Ingredient Functionality in Batter Type Cake Making. Trends in Food Science and Technology, 2013, 30, 6–15.
- Sowmya, M.; Jeyarani, T.; Jyotsna, R.; Indrani, D. Food Hydrocolloids Effect of Replacement of Fat with Sesame Oil and Additives on Rheological, Microstructural, Quality Characteristics and Fatty Acid Profile of Cakes. Food Hydrocolloids 2009, 23, 1827–1836.
- Wagner, M.J.; Lucas, T.; Le Ray, D.; Trystram, G. Water Transport in Bread during Baking. Journal of Food Engineering 2007, 78, 1167–1173.
- Kirtil, E.; Oztop, M.H. 1H Nuclear Magnetic Resonance Relaxometry and Magnetic Resonance Imaging and Applications in Food Science and Processing. Food Engineering Reviews 2016, 8(1), 1–22
- Hashemi, R.H.; Bradley, W.G.; Lisanti, C.J. MRI: The Basics; Lippincott Williams & Wilkins: Philadelphia, PA, USA, 2010.
- Wagner, M.;Quellec, S.; Trystram, G.; Lucas, T. MRI Evaluation of Local Expansion in Bread Crumb During Baking. Journal of Cereal Science 2008, 48, 213–223.
- Wagner, M.J.; Loubat, M.; Sommier, A.; Le Ray, D.; Collewet, G.; Broyart, B.; Quintard, H.; Davenel, A.; Trystram, G.; Lucas, T. MRI Study of Bread Baking: Experimental Device and MRI Signal Analysis. International Journal of Food Science and Technology 2008, 43, 1129–1139.
- Ruan, R.; Chang, K.; Chen P.; Fulcher, R.; Bastian, E. A Magnetic Resonance Imaging Technique for Quantitative Mapping of Moisture and Fat in a Cheese Block. Journal of Dairy Science 1998, 81, 9–15.
- Ruiz-Cabrera, M.; Foucat, L.; Bonny, J.M.; Renou, JP.; Daudin, J.D. Assessment of Water Diffusivity in Gelatine Gel from Moisture Profiles. I: Non-destructive Measurement of 1D Moisture Profiles during Drying from 2D Nuclear Magnetic Resonance Images. Journal of Food Engineering 2005, 68, 209–219.
- Todt, H.; Guthausen, G.; Burk, W.; Schmalbein, D.; Kamlowski, A. Water/Moisture and Fat Analysis by Time-Domain NMR. Food Chemistry 2006, 3, 436–440.
- Horigane, AK.; Motoi, H.;Irie, K.; Yoshida, A.M. Observation of the Structure, Moisture Distribution, and Oil Distribution in the Coating of Tempura by NMR Micro Imaging. Journal of Food Science 2003, 68, 2034–2039.
- Cornillon, P.; Salim, L.C. Characterization of Water Mobility and distribution in Low- and Intermediate-Moisture Food Systems. Magnetic Resonance Imaging 2000, 18, 335–341.
- Cikrikci, S.; Oztop, M.H. Mathematical Modeling and Use of Magnetic Resonance Imaging (MRI) for Oil Migration in Chocolate Confectionery Systems. Food Engineering Reviews 2017, 9, 50–70.
- Oztop, M.H.; Bansal, H.; Takhar, P.; McCarthy, K.L.; McCarthy, M.J. Using Multi-Slice-Multi-Echo Images with NMR Relaxometry to Assess Water and Fat Distribution in Coated Chicken Nuggets. LWT - Food Science and Technology 2014, 55, 690–694.
- Barutcu, I.; McCarthy, M.J.; Seo Y.S.; Sahin. S. Magnetic Resonance Temperature Mapping of Microwave-Fried Chicken Fingers. Journal of Food Science 2009, 74, 234–240.
- Painter, K.A. Functions and Requirements of Fats and Emulsifiers in Prepared Cake Mixes. Journal of the American Oil Chemist’s Society 1981, 58, 92–95.
- Ghrairi, F.; Lahouar, L.; Amira, EA.; Brahmi, F.; Ferchichi, A.; Achour, L.; Said, S. Physicochemical Composition of Different Varieties of Raisins (Vitis vinifera L.) from Tunisia. Industrial Crops and Products 2013, 43, 73–77.
- Guy, R.C.E. Factors Affecting the Staling of Madeira Slab Cake. Journal of the Science of Food and Agriculture 1983, 34, 477–491.
- Matz, S.A. Bakery Technology and Engineering; Springer: New York, US, 1991; pp. 740.
- Turabi, E.; Sumnu, G.; Sahin, S. Optimization of Baking of Rice Cakes in Infrared – Microwave Combination Oven by Response Surface Methodology. Food and Bioprocess Technology 2008, 1, 64–73.
- Seyhun, N.; Sumnu, G.; Sahin, S. Effects of Different Starch Types on Retardation of Staling of Microwave-baked Cakes. Food and Bioproducts Processing 2005, 83, 1–5.
- Sakiyan, O.;Sumnu, G.;Sahin, S.;Bayram, G. Influence of Fat Content and Emulsifier Type on the Rheological Properties of Cake Batter. European Food Research and Technology 2004, 219, 635–638.
- Sumnu, G.; Sahin, S.; Sevimli, M. Microwave, Infrared and Infrared-Microwave Combination Baking of Cakes. Journal of Food Engineering 2005, 71, 150–155.
- Kilercioğlu, M.; Ozel, B.; Karaçam, Ç.H.; Poçan, P.; Öztop, M.H. Investigating the Effect of High Temperature and Humidity on Water and Fat Distribution in Hazelnuts by Magnetic Resonance Imaging (MRI) and NMR Relaxometry Techniques. GIDA 2015, 40, 141–148.
- Kilercioglu, M.; Ozel, B.; Oztop, M.H. Characterization and Comparison of Turkish Table Olive Varieties with NMR Relaxometry. GIDA 2016, 41, 1–7.
- Duval, F.P.; Van Duynhoven, J.P.M.; Bot, A. Practical Implications of the Phase-Compositional Assessment of Lipid-Based Food Products by Time-Domain NMR. Journal of the American Oil Chemists’ Society 2006, 83, 905–912.
- Belton, P.S.; Gil, A.M.; Webb, GA.; Rutledge, D. Magnetic Resonance in Food Science; The Royal Society of Chemistry: Cambridge, UK, 2003.
- Chary, K.V.R.;Govil, G. NMR in Biological Systems: From Molecules to Human; Springer: Dordrecht, The Netherlands, 2008.
- Ruan, R.R.; Chen P.L. Water in Foods and Biological Materials. CRC Press: USA, 1997.
- Zhang, J.S.; Peng, H.; Lin, X.Y.; Liu, YH.; Jin, Z.Q. Evaluation of Effects of Adding Different Resistant Starches on Firmness and Stickiness of Dough by NMR during Proofing. Applied Mechanics and Materials 2011, 140, 334–342.
- Kirtil, E.; Oztop, M.H.; Sirijariyawat, A.; Ngamchuachit, P.; Barrett, D.M.; McCarthy, M.J. Effect of Pectin Methyl Esterase (PME) and CaCl2 Infusion on the Cell Integrity of Fresh-cut and Frozen-thawed Mangoes: An NMR Relaxometry Study. Food Research International 2014, 66, 409–416.
- Hesso, N.;Garnier, C.;Loisel, C. Formulation Effect Study on Batter and Cake Microstructure : Correlation with Rheology and Texture. Food Structure, 2015, 5,31–41.
- Li, J.; Kang, J.; Wang, L.; Li, Z.; Wang, R.; Chen, ZX.; Hou, G.G. Effect of water Migration between Arabinoxylans and Gluten on Baking Quality of Whole Wheat Bread Detected by Magnetic Resonance Imaging (MRI). Journal of Agricultural and Food Chemistry 2012, 60, 6507–6514.
- Kirtil, E.; Oztop, M.H. Characterization of Emulsion Stabilization Properties of Quince Seed Extract as a New Source of Hydrocolloid. Food Research International 2016, 85, 84–94.
- Oztop, M.H.; Bansal, H.; Takhar, P.; McCarthy, K.L.; McCarthy, M.J. Using Multi-slice-Multi-echo Images with NMR Relaxometry to Assess Water and Fat Distribution in Coated Chicken Nuggets. LWT: Food Science and Technology 2014, 55, 690–694.
- Scheenen, T.W.; Vergeldt, F.J.; Heemskerk, A.M.; Van As, H. Intact Plant Magnetic Resonance Imaging to Study Dynamics in Long-distance Sap Flow and Flow-Conducting Surface Area. Plant Physiology 2007, 144, 1157–1165.
- Rudi, T.; Guthausen, G.; Burk, W.; Reh C.T.; Isengard, H.D. Simultaneous Determination of Fat and Water Content in Caramel Using Time Domain NMR. Food Chemistry 2008, 106, 1375–1378.