
ABSTRACT
The objective of this study was to develop FTIR spectroscopy combined with chemometrics for the authentication of extra virgin olive oil (EVOO) from grape seed oil (GSO), soybean oil (SO), and walnut oil (WO). FTIR spectra of EVOO and that mixed with GSO, SO, and WO were scanned at mid infrared region (4000–650 cm−1). The optimized wavenumbers region was used for the quantification of oil adulterants using multivariate calibration of partial least square (PLS) and principle component regression (PCR) as well as for classification using discriminant analysis (DA). PLS at optimized wavenumbers was used with R2 for the relationship between actual and predicted values of GSO, SO, and WO was >0.99. The values of root mean square error of calibration (RMSEC) were relatively low, i.e. 0.308%, 0.658%, and 0.101% for GSO, SO, and WO, respectively. DA at the optimized frequency region could successfully classify EVOO and EVOO adulterated with GSO, SO, and WO.
Introduction
Adulteration of fats and oils, which involves the substitution of high-price oils like extra virgin olive oil (EVOO) with lower-quality or cheaper oils such as palm oil and soybean oil (SO) can be a very lucrative activity. In the fats and oils industry, EVOO commands high price compared with other used plants-based oils. EVOO is attractive to be falsified or adulterated with lower priced oils in order to gain economical profits.[Citation1] The adulteration practices may take place not only by unintentional contamination during EVOO processing stages, but also by the deliberate mislabelling of low-grade olive oil categories or by the addition of lower-priced edible oils.[Citation2] Grape seed oil (GSO), SO, and walnut oil (WO) can be used as adulterant models in EVOO due to the different composition of the oils.[Citation3]
Currently, EVOO has received great attention because of its biological activities. Olive oil is reported to contain high levels of oleic acid and some micronutrients needed to human health, antioxidants like phenolic compounds, vitamin E, and carotenes.[Citation4] Among the olive oil classes, EVOO is the highest quality of olive oil and has become very important agricultural products for the Mediterranean countries.[Citation5] Widely known as a high-quality edible oils with acknowledged health benefits, EVOO is higher priced than other plant-based oils; therefore, EVOO is very lucrative to be adulterated.[Citation6] As a consequence, the authentication analysis remains a challenging task for food scientists by providing a simple, reliable, and fast analytical method capable of detecting the adulteration practice of EVOO.
Several research articles and reviews have been published with regard to the analytical methods used for the authentication of EVOO. However, most reported methods rely on chromatographic techniques, namely gas chromatography,[Citation7] high-performance liquid chromatography,[Citation8–Citation9] capillary electrophoresis,[Citation10] as well as polymerase chain reaction via the analysis of DNA fingerprinting.[Citation11] These methods are time-consuming and need skilled operators. For this reason, these methods are not suitable to be used as a screening method or for rapid quantitative analysis and, as a consequence, they are not recommended to be applied in most routine food laboratories. This challenged analytical chemists to develop rapid techniques, especially based on spectroscopic methods such as UV-Vis spectroscopy,[Citation3] fluorescence spectroscopy,[Citation12] infrared spectroscopy,[Citation13] and Raman spectroscopy.[Citation14]
Fourier transform infrared (FTIR) spectroscopy, one of the vibrational spectroscopies, is an ideal technique for authentication analysis. Combined with multivariate analysis, FTIR spectroscopy offers a fast and reliable method, does not involve excessive sample preparation, and does not require a large amount of solvents and reagents.[Citation15] FTIR spectroscopy combined with chemometrics of multivariate calibration and pattern recognition technique has been used for the authentication of EVOO from sunflower and corn oils,[Citation16] EVOO from palm oil and sesame oil, [Citation17, Citation18] EVOO from hazelnut oil,[Citation19] EVOO from a binary mixture of corn–sunflower oils, and EVOO from cottonseed and rapeseed oils.[Citation20] The objective of this study was to develop FTIR spectroscopy combined with the chemometrics of multivariate calibration (partial least square (PLS) and principle component regression (PCR)) and discriminant analysis (DA) for the analysis of EVOO’s adulterants (GSO, SO, and WO).
Materials and methods
EVOO with different brands, GSO, SO, and WO, were purchased from the local market in Serdang, Selangor, Malaysia. The oil samples were packaged in polyethylene terephthalate (PET) bottles and the dates of manufacturing were not known. The authenticity of the used oils was confirmed by determining fatty acid (FA) compositions using gas chromatography.
FA composition
FAs compositions of EVOO, GSO, SO, and WO were quantified using gas chromatography with flame ionization detector (GC-FID) according to Che Man et al. [Citation21]. Before being injected into GC-FID, the derivatization procedure in order to convert triacylglycerols (TAG) into the corresponding fatty acid methyl esters (FAMEs) was performed. Approximately 50 mg of oils was added with 0.8 mL hexane and 0.2 mL sodium methoxide 1 M. The mixture was subjected to vortex mixer for 1 min, added with five drops of saturated NaCl, and vortexed for 15 s. Then, 1 µL of the clear supernatant was taken and injected into a gas chromatograph (Shimadzu GC-2010, Shimadzu Corp., Tokyo, Japan), using a column RTX-5 capillary column (0.25 mm internal diameter, 30 m length, and 0.2 µm film thickness; Restex Corp., Bellefonte PA). The programmed temperature was: 50°C (held for 1 min), then increased to 240°C (8°C/min), and finally held at 240°C for 5 min. The temperatures of the detector and the injector were set at 240°C. The carrier gas of N2 was set at 6.8 mL/min. The reference standards of FAMEs (37 FAMEs, C4 to C24) (Sigma Chemicals, St. Louis, MO, USA) were used to identify the retention times of the corresponding FAMEs in the oil samples. Quantification analysis of FA was performed using the normalization internal technique.
Quantitative analysis using multivariate calibration
For making the calibration model during quantitative analysis using PLS and PCR models, a set of 30 samples containing EVOO mixed with GSO, SO, and WO in certain proportion spanning the concentration range of 1.0–50.0% (v/v) was prepared. For the validation model, 25 independent samples were made. Before being scanned using an FTIR spectrophotometer, the mixture of oils was mixed vigorously to make homogenous samples.
Classification of EVOO and EVOO adulterated with vegetable oils
Classification of EVOO and that adulterated with GSO, SO, and WO was carried out using a supervised pattern recognition technique of DA.[Citation22] To carry out DA, EVOO and oil adulterants were mixed to obtain a series of trained sets of 20 pure EVOO and 20 EVOO samples adulterated with 1–50%. The EVOO samples adulterated were assigned as adulterated, while pure EVOO was assigned as EVOO.
FTIR spectra acquisition
FTIR spectrophotometer (Nicolet 6700 from Thermo Nicolet Corp., Madison, WI) equipped with a deuterated triglycine sulphate (DTGS) as a detector and KBr/Germanium as beam splitter, interfaced to a computer operating under Windows, and connected to software of the OMNIC operating system (Version 7.0 Thermo Nicolet), was used during the FTIR spectra acquisition of oil samples. The sampling compartment was a Smart Attenuated Total Reflectance kit (Smart ARK, Thermo Electron Corp.) composed of ZnSe crystal. The FTIR spectra of the samples were scanned at the mid-infrared region (4000–650 cm−1), using 32 scans with 4 cm−1 resolution. These spectra were subtracted against the air spectrum as the background. These spectra were recorded as an absorbance mode at each data point in triplicate. To follow the Lambert–Beer law, the spectra were read as the absorbance mode.
Chemometrics and statistical analyses
Chemometrics of multivariate calibration (PLS and PCR) and classification (DA) was performed using the software TQ AnalystTM version 6 (Thermo electron Corporation, Madison, WI). The spectral regions where the variations were observed were chosen during analysis (PLS, PCR, and DA).
Results and discussion
FA composition
EVOO can be differentiated from other edible oils by FA composition, unsaturation degree of the chains, and the specific minor components present in it. The qualitative identification of FA was carried out by comparison of their retention times with those of standard FA mixtures, while the quantitative analysis of FA was taken by the internal normalization technique, giving the relative composition of FA by expressing the instrument response (peak area) for each FA as a fraction of the summed responses for all FAs. compiles the FA compositions of EVOO, GSO, SO, and WO. Almost all the used edible oils have the FA compositions in the range of those specified in Codex Allimentarius.[Citation23]
Table 1. Fatty acid composition of extra virgin olive oil (EVOO), grape seed oil (GSO), soybean oil (SO), and walnut oil (WO) using gas chromatography-flame ionization detector.
The FA composition of edible fats and oils is fingerprint in nature, in which no two oils having similar FA profiles in terms of types of compositions of FA composed of edible oils; therefore, FA can be used as tools for assuring the authenticity of edible oils.[Citation24] Some other components specific to certain oils were used as tools to authenticate the studied oils such as phytosterols,[Citation25] volatile compounds as determined using dynamic head space thermal desorption combined with gas chromatography-mass spectrometry,[Citation26] and some phenolic compounds that are characteristic to olive oils.[Citation27]
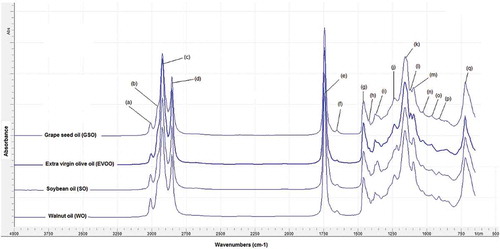
Authentication of EVOO from GSO, SO, and WO using FTIR spectroscopy combined with chemometrics technique was performed by the quantification of oil adulterants in EVOO using multivariate calibration of PLS and PCR, and by classification between EVOO and EVOO adulterated with GSO, SO, and WO. exhibits the FTIR spectra of EVOO as well as GSO, SO, and WO as adulterants at wavenumbers of 4,000–650 cm−1. Each peak and shoulder at specific wavenumbers, which appear in the FTIR spectra, was correlated with functional groups present in the oil samples. The functional groups and vibration modes of the peaks and shoulders of the FTIR spectra of EVOO and other vegetable oils are summarized in . The FTIR spectra of EVOO and other vegetable oils look very similar to the naked eyes. However, if one examines the FTIR spectra of the studied oils in detail, there were a few differences in terms of peak intensities, especially at the fingerprint region (1500–650 cm−1). This is not surprising due to the fact that the FTIR spectra are fingerprint in nature, which can be understood that there are no same FTIR spectra for two different oils.[Citation28] These FTIR spectral differences were subjected to optimization for selecting the optimum wavenumbers regions offering a reliable prediction model using PLS or PCR and an accurate classification model using DA.
Figure 1. FTIR spectra of extra virgin olive oil (EVOO), grape seed oil (GSO), soybean oil (SO), and walnut oil (WO) scanned at the mid-infrared region (4000–650 cm−1).
Classification of EVOO and adulterants
Classification of EVOO and that adulterated with GSO, SO, and WO was performed using DA. The wavenumbers regions used for DA are optimized in such a way so that both groups are classified successfully 100%. Pure EVOO and that in mixture with oil adulterants were classified into two groups, known as pure EVOO and EVOO adulterated with GSO, SO, and WO. Some of both group samples (pure EVOO and that adulterated with vegetable oils) were used as validation sets in order to evaluate the capability of the chosen FTIR spectra regions to classify both classes.
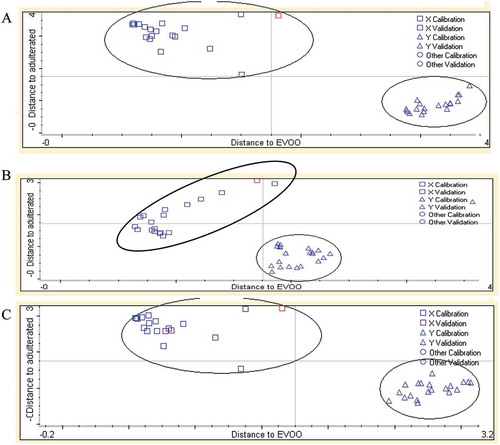
The optimized wavenumbers regions used for DA were the combined regions of 3018–3002 and 1200–1000 cm−1 (EVOO-GSO and EVOO-SO), and the combined regions of 3029–2954 and 1125–667 cm−1 (EVOO-WO). shows the Coomans plot for the classification of EVOO adulterated with the addition of 1–50% GSO, SO, and WO. The x-axis shows the Mahalanobis distance to EVOO, while the y-axis shows the distance to the EVOO adulterated with GSO, SO, and WO. DA can classify pure EVOO and that adulterated with vegetable oils (GSO, SO, and WO) with an accuracy level of 100%, meaning that no samples were mistakenly classified into the wrong group (). In some cases, misclassification was reported due to the inappropriate selection of wavenumbers region and very close similarity in chemical composition between authentic oil and adulterated oils.[Citation29]
Figure 2. The Cooman plot for the classification of extra virgin olive oil (EVOO) and adulterated EVOO with other vegetable oils. (□) EVOO; (Δ) EVOO containing adulterants of grape seed oil (A); soybean oil (B); and walnut oil (C).
Quantification of oil adulterants in EVOO
The quantitative analysis of adulterants (GSO, SO, and WO) in EVOO samples was determined using PLS and PCR models. Both calibrations were based on factor analysis and inverse calibration. The first step was the selection of wavenumbers regions capable of providing the best correlation of the actual values of adulterants and the FTIR-predicted values, expressed with coefficient of determination (R2) close to 1 with low errors in the calibration and validation models. Finally, the wavenumbers regions used for classification, i.e. the combined regions of 3018–3002 and 1200–1000 cm−1 (GSO and SO) and the combined regions of 3029–2954 and 1125–667 cm−1 (WO), were employed for quantification using PLS and PCR calibrations. compiles the performance characteristics of PLS and PCR using normal spectra and derivative spectra (the first and second derivatives). PLS was more preferred for the quantification of adulterants over the PCR model due to the higher R2 and lower root mean square error of calibration (RMSEC) offered. The equation describing the relationship between the actual value (x-axis) and the FTIR-predicted value (y-axis) using normal spectra and PLS was y = 0.999 × −0.003 with R2 and RMSEC of 0.999 and 0.308, respectively. PLS using normal spectra was also preferred for the quantification of SO and WO with R2 > 0.99 and RMSEC values of 0.658 (SO) and 0.101 (WO).
Table 2. Functional groups and vibration modes of peaks and shoulders of the FTIR spectra of extra virgin olive oil (EVOO) and other vegetable oils [Citation13].
Table 3. Multivariate calibration of partial least square (PLS) and principle component regression (PCR) for quantitative analysis of grape seed oil, soybean oil, and walnut oil as adulterants in extra virgin olive oil (EVOO)*.
The PLS calibration model was further used for predicting adulterant levels in validation sample sets. The equation obtained for the relationship between the actual value (x-axis) and the FTIR-predicted value (y-axis) of GSO, SO, and WO in EVOO along with the root mean square errors of prediction (RMSEP) was also compiled in 2. The optimum number of PLS and PCR factors was determined using cross-validation by plotting the number of factors against the root mean square error of cross-validation (RMSECV) and determining the minimum factors. The optimal number of factors for the determination of GSO, SO, and WO in EVOO using PLS with the normal FTIR spectra was 6, 4, and 8, respectively, which expressed that RMSECV obtained a stable value after these factor numbers. Based on these results, FTIR spectroscopy is a promising technique for the authentication of EVOO from GSO, SO, and WO. This study can be extended to look for the possibility of FTIR spectroscopy in combination with chemometrics for the authentication of EVOO from different geographical origins and from different varieties.
Conclusion
FTIR spectroscopy in combination with the chemometrics of multivariate calibration of PLS using selected wavenumbers regions (the combined regions of 3018–3002 and 1200–1000 cm−1 for the analysis of GSO and SO, and the combined regions of 3029–2954 and 1125–667 cm−1 for the analysis of WO) was suitable for predicting the oil adulterants of GSO, SO, and WO in EVOO. DA at these wavenumbers regions was also able to classify EVOO and EVOO adulterated with GSO, SO, and WO. The developed method is fast and simple; therefore, it is suitable for the routine monitoring of EVOO adulteration.
Funding
The first author expresses his thanks to the Directorate General for Higher Education (Dikti), the National Education Ministry, Republic of Indonesia, for financial supports during his PhD study in Halal Products Research Institute, Universiti Putra Malaysia, Malaysia.
Additional information
Funding
Related Research Data
References
- Buckland, G.; Gonzalez, C. A. The Role of Olive Oil in Disease Prevention: A Focus on the Recent Epidemiological Evidence from Cohort Studies and Dietary Intervention Trials. British Journal of Nutrition 2015, 113(S2), S94–S101.
- Aparicio, R.; Morales, M.T.; Aparicio-Ruiz, R.; Tena, N.; García-González, D.L. Authenticity of Olive Oil: Mapping and Comparing Official Methods and Promising Alternatives. Food Research International 2013, 54, 2025–2038.
- Ferreiro-González, M.; Barbero, G.F.; Álvarez, J.A.; Ruiz, A.; Palma, M.; Ayuso, J. Authentication of Virgin Olive Oil by a Novel Curve Resolution Approach Combined with Visible Spectroscopy. Food Chemistry 2017, 220, 331–336.
- Pérez-Jiménez, M.; Besnard, G.; Dorado, G.; Hernandez, P. Varietal Tracing of Virgin Olive Oils Based on Plastid DNA Variation Profiling. PLoS One 2013, 8, e70507.
- Gurdeniz, G.; Ozen, B. Detection of Adulteration of Extra-Virgin Olive Oil by Chemometric Analysis of Mid-infrared Spectral Data. Food Chemistry 2009, 116, 519–525.
- Garrido-Delgado, R.; Dobao-Prieto, M. D. M.; Arce, L.; Valcárcel, M. Determination of Volatile Compounds by GC-IMS to Assign the Quality of Virgin Olive Oil. Food Chemistry 2015, 187, 572–579.
- Jafari, M.; Kadivar, M.; Keramat, J. Detection of Adulteration in Iranian Olive Oils Using Instrumental (GC, NMR, DSC) Methods. Journal of the American Oil Chemists’ Society 2009, 86, 103–110.
- Flores, G.; Ruiz Del Castillo, M.L.; Herraiz, M.; Blanch, G.P. Study of the Adulteration of Olive Oil with Hazelnut Oil by On-line Coupled High Performance Liquid Chromatographic and Gas Chromatographic Analysis of Filbertone. Food Chemistry 2006, 97, 742–749.
- Bajoub, A.; Medina-Rodríguez, S.; Gómez-Romero, M.; Ajal, E.; Bagur-González, M.G.; Fernández-Gutiérrez, A.; Carrasco-Pancorbo, A. Assessing the Varietal Origin of Extra-Virgin Olive Oil Using Liquid Chromatography Fingerprints of Phenolic Compound, Data Fusion and Chemometrics. Food Chemistry 2017, 215, 245–255.
- Godoy-Caballeroa, M.d.P.; Culzoni, M.J.; Galeano-Díaz, T.; Acedo-Valenzuela, M.I. Novel Combination of Non-aqueous Capillary Electrophoresis and Multivariate Curve Resolution-Alternating Least Squares to Determine Phenolic Acids in Virgin Olive Oil. Analytica Chimica Acta 2013, 763, 11–19.
- Ramos-Gómez, S.; Busto, M.D.; Albillos, S.M.; Ortega, N. Novel qPCR Systems for Olive (Olea europaea L.) Authentication in Oils and Food. Food Chemistry 2016, 194, 447–454.
- Poulli, K.I.; Mousdis, G.A.; Georgiou, C.A. Rapid Synchronous Fluorescence Method for Virgin Olive Oil Adulteration Assessment. Food Chemistry 200, 105, 369–375.
- Lerma-García, M.J.; Ramis-Ramos, G.; Herrero-Martínez, J.M.; Simó-Alfonso, E.F. Authentication of Extra Virgin Olive Oils by Fourier-Transform Infrared Spectroscopy. Food Chemistry 2010, 118, 78–83.
- Heise, H.M.; Damm, U.; Lampen, P.; Davies, A.N.; Mcintyre, P.S. Spectral Variable Selection for Partial Least Squares Calibration Applied to Authentication and Quantification of Extra Virgin Olive Oils Using Fourier Transform Raman Spectroscopy. Applied Spectroscopy 2005, 59, 1286–1294.
- Rohman, A.; Che Man, Y. B. Application of Fourier Transform Infrared spectroscopy for Authentication of Functional Food Oils. Applied Spectroscopy Reviews 2012, 47, 1–13.
- Özdemir, D.; Öztürk, B. Near infrared Spectroscopic Determination of Olive Oil Adulteration with Sunflower and Corn Oil. Journal of Food and Drug Analysis 2007, 15, 40–47.
- Rohman, A.; Che Man, Y.B. Fourier Transform Infrared (FTIR) Spectroscopy for Analysis of Extra Virgin Olive Oil Adulterated with Palm Oil. Food Research International 2010, 43, 886–892.
- Rohman, A.; Che Man, Y.B. Authentication of Extra Virgin Olive Oil from Sesame Oil Using FTIR Spectroscopy and Gas Chromatography. International Journal Food Properties 2012, 15, 1309–1318.
- Georgouli, K.; Del Rincon, J.M.; Koidis, A.; Continuous Statistical Modelling for Rapid Detection of Adulteration of Extra Virgin Olive Oil Using Mid Infrared and Raman Spectroscopic Data. Food Chemistry 2017, 217, 735–742.
- Özdemir, D.; Öztürk, B. Near Infrared Spectroscopic Determination of Olive Oil Adulteration with Sunflower and Corn Oil. Journal of Food and Drug Analysis 2007, 15, 40–47.
- Che Man, Y.B.; Rohman, A.; Mansor, T. S. T. Differentiation of Lard From Other Edible Fats and Oils by Means of Fourier Transform Infrared Spectroscopy and Chemometrics. Journal of the American Oil Chemists’ Society 2011, 88, 187–192.
- Miller, J. N.; Miller, J. C. Statistics and Chemometrics for Analytical Chemistry, 5th edn.; Pearson Education Limited: Edinburgh Gate Harlow, 2005.
- Codex Alimentarius Commission. Amended. Codex Standard for Named Vegetable Oils; Codex Standard 210, 2003.
- Wiesman, Z.; Chapagain, B.P. Determination of Fatty Acid Profiles and TAGs in Vegetable Oils by MALDI-TOF/MS Fingerprinting. Lipidomics 2009, 579, 315–336.
- Azadmard-Damirchi, S. Review of the Use of Phytosterols as a Detection Tool for Adulteration of Olive Oil with Hazelnut Oil. Food Additives & Contaminants: Part A 2010, 27, 1–10.
- Reboredo-Rodríguez, P.; González-Barreiro, C.; Cancho-Grande, B.; Simal-Gándara, J. Dynamic Headspace/GCeMS to Control the Aroma Fingerprint of Extra-Virgin Olive Oil from the Same and Different Olive Varieties. Food Control 2012, 25, 684–695.
- Reboredo-Rodríguez, P.; Rey-Salgueiro, L.; Regueiro, J.; González-Barreiro, C.; Cancho-Grande, B.; Simal-Gándara, J. Ultrasound-Assisted Emulsification–Microextraction for the Determination of Phenolic Compounds in Olive Oils. Food Chemistry 2014, 150, 128–136.
- Rohman, A. Infrared Spectroscopy for Quantitative Analysis and Oil Parameters of Olive Oil and Virgin Coconut Oil: A Review. International Journal of Food Properties. Doi: 10.1080/10942912.2016.1213742
- Manaf, M.A.; Che Man, Y.B.; Hamid, N.S.A.; Ismail, A.; Syahariza, Z.A. Analysis of Adulteration of Virgin Coconut Oil by Palm Kernel Olein Using Fourier Transform Infrared Spectroscopy. Journal of Food Lipids 2007, 14, 111–121.