
ABSTRACT
Dielectric properties (DP: relative permittivity and loss factor) and electrical conductivity are important parameters for evaluating the microwave penetration depth and designing applicators for pasteurization processes. In this context, generalized equations that can predict the DP of a group of food products as a function of their characteristics are useful. The dielectric behaviours of eight citrus fruit juices (Pera, Lima, and Navel oranges, Ponkan tangerine, Murcott tangor, Mediterranean mandarin, Sicilian lemon, and Persian lime) and three Pera/Lima blends (25, 50, 75%) for temperatures between 0 and 90 °C and frequency between 500 and 3000 MHz were studied. The results were correlated with temperature at frequencies of 915 and 2450 MHz. It was possible to quantify the ionic and dipolar contributions. DPs were modelled based on the behaviour of pure water in a semiempirical approach using correction factors, which were correlated with temperature and juice physicochemical characteristics (pH, Brix, conductivity). Polynomial regressions can successfully predict relative permittivity with mean absolute errors of 0.49±0.35% and 0.58±0.48% and the loss factor with errors of 4.1±3.9% and 2.8±2.3% at 915 and 2450 MHz, respectively, for juices with Brix/acid ratio between 1.26 and 29.9.
Introduction
Ready-to-drink fruit juices are usually thermally processed for inactivating undesired or harmful enzymes and microorganisms. Although exposure to high temperature can ensure food safety and extend shelf life, it also causes loss of nutritional and sensory qualities. Alternative processing technologies such as microwave heating have been studied to reduce unnecessary exposure to high temperatures and improve product quality.[Citation1] When operated in a continuous flow mode, microwave heating can provide a fast and relatively more homogeneous heating. Focused microwave heaters have been studied for pasteurization applications. However, key information needed for the design and simulation of such devices is the dielectric behaviour of the food product.[Citation2–Citation4]
Microwaves are a form of electromagnetic radiation with frequency between 300 MHz and 300 GHz. Important microwave frequencies allocated by the Federal Communications Commission (FCC) for industrial, scientific, and medical applications are 869, 915, 2375, and 2450 MHz.[Citation5] Microwave interaction with food products can promote volumetric heating. The conversion of electromagnetic energy to thermal energy at microwave frequencies is achieved by dipole rotation (rapid oscillation of polar molecules, such as water) and ionic conduction (movement of ions subject to oscillating electric field). This interaction can be characterized by the relative complex permittivity of the material:
where is the relative electrical permittivity,
is the dielectric loss factor, and
.[Citation5] The relative permittivity represents the electric polarization of the material subject to an external electric field while the loss factor represents the energy dissipation as heat.[Citation6] The two mechanisms that contribute to dielectric heating in microwave frequencies can be expressed as follows:
where is the loss factor due to dipolar rotation and
is the loss factor due to ionic conduction, which can be calculated as
where is the DC electrical conductivity (S/m),
= 8.854 × 10⁻¹² F/m is the electrical permittivity of the free space, and
is the angular frequency of the field (rad/s).[Citation7]
The dielectric properties (DPs) of a material (,
) depend on its composition, temperature, structure, and frequency of the alternating electric field.[Citation8] These properties have been studied in different frequency and temperature ranges for various liquid foods of interest such as fruit juices[Citation9–Citation12], green coconut water[Citation13,Citation14], honey[Citation15,Citation16], milk[Citation17-Citation22], wine[Citation23], soy beverages,[Citation19] and liquid eggs[Citation24].
DPs of citrus fruits and juices
Orange juice is the main product of interest of this work due to its economic importance in Brazil, which is a leading country in the production and exportation of orange juice.[Citation18] The Pera variety was considered since it is an important mid-season orange cultivar in the State of São Paulo. The other seven citrus varieties commercialized in the same region and used for juices, blends, or nectars were included in this study to investigate the range of DPs of citrus fruit juices and if they can be correlated with juice characteristics, such as soluble solids content (SS).
There are some published studies about the DPs of tissues of citrus fruits and few about the DPs of citrus juices regarding microwave pasteurization. Seaman and Seals[Citation25], for instance, determined the DPs of the skin and pulp of some fruits, including tangelo and orange at room temperature. Nelson et al.[Citation26,Citation27] determined the DPs of the core of four citrus fruits (pink grapefruit, lemon, lime, and navel orange) at 23°C for frequencies between 200 MHz and 20 GHz. The relative permittivity of various fresh fruits and vegetables was plotted against moisture content (between 71% and 97%) for the limiting frequencies and a positive linear correlation was observed but with low coefficients of determination (R2 = 0.477 and 0.825, respectively) because of the differences in the tissue structure and nature of water binding. Kuang and Nelson[Citation28] adjusted the Debye model to the data and tried to correlate the static permittivity and the relaxation frequency with the moisture content and total soluble solids, respectively. The obtained coefficients of determination were also low (R2 = 0.637 and 0.696, respectively), but a trend was noticeable. According to the authors, better correlations might be expected for individual kinds of fruits and vegetables with wider ranges of moisture content.
Nelson[Citation29,Citation30] studied the DPs of nine fresh fruit and vegetables, including the navel orange. In this study, frequencies were between 10 MHz and 1.8 GHz and the temperature of the sample tissue varied between 5°C and 95°C. Since radio frequencies ( < 300 MHz) were also tested, very high values of loss factors were obtained (
near 103 at 95°C and 10 MHz), which masked interesting behaviours that occur at microwave frequencies. Moreover, high values of relative permittivity were also observed (
near 370 at 95°C and 10 MHz) that could be explained by the ionic polarization of the tissue cells (Maxwell–Wagner effect).
The DPs of fruit pulps were studied by Wang et al.[Citation31], which included navel orange and grapefruit. The frequency range was from 1 to 1800 MHz, including radio and microwave bands, using a coaxial probe and temperatures between 20°C and 60°C. Results of and
were reported at discrete temperatures and frequencies.
For providing DPs data of fruit juices for pasteurization applications, Zhu et al.[Citation11] determined these properties for juices of apple, pear, orange, grape, and pineapple from 20 to 4500 MHz and temperatures between 15°C and 95°C. Results were correlated with temperature at frequencies of 27.12, 40.68, 915, and 2450 MHz. Power penetration depths were calculated and it was verified that, at lower frequencies, it significantly decreases with temperature. At 2450 MHz, the penetration depth showed less variation and increased with temperature. It was generally verified that ionic conduction was the dominant loss mechanism in the juices at lower frequencies. Moreover, for frequencies below 1.0 GHz, increased with increasing temperature, whereas above 3.0 GHz, it decreased as the temperature decreased. Consequently, different behaviours were observed at commercial frequencies of 915 and 2450 MHz.
Prediction of DPs of groups of foods
Often the DPs of a food product are measured and then correlated with temperature for a given frequency and several examples are available in the literature[Citation32,Citation33]. Correlation with moisture content is also usual for microwave-assisted drying process, such as the study of the influence of moisture and salt content on the DPs or pistachio kernels by Ling et al.[Citation34]. There are studies where the DPs are correlated with a characteristic or property of a given food product, for instance the fat and protein content in cow milk[Citation22,Citation35]. However, predictive correlations in the literature are restricted to specific foods. The prediction of the dielectric behaviour of a group of food products with different characteristics is challenging.
In search of composition-based correlations, the contribution of individual components has been studied for some model systems such as simulated frozen lean tuna with tylose water paste and NaCl[Citation36], simulated coconut water[Citation13], gellan gel with sucrose and NaCl[Citation37], solution of NaCl, D-sorbitol, and sucrose,[Citation38] and solutions of different carbohydrates[Citation39–Citation42].
Sun et al.[Citation43] gathered DPs data from various foods and explored whether it was possible to correlate and
with the composition. They verified that the inclusion of all types of foods (meats, fruits, and vegetables) inhibited any useful correlation with composition, but better results were obtained for particular types of foods. For instance, the permittivity and loss factor of meats (2450 ± 50 MHz) were correlated with temperature, water content, and ash content. Protein, carbohydrate, and fat contents did not improve the correlation significantly. The ash content is a good indicator of the total salts in a food material; however, ashes include both free and bound mineral ions that have different effects on the DPs.
Funebo and Ohlsson[Citation44] linearly correlated the permittivity and loss factor (2800 MHz, temperatures between 20°C and 60°C) from a group of fruits and vegetables (mushroom, apple, chervil, parsley, and strawberry) with temperature, water content, and bulk density, but large prediction errors were obtained (20% and 30%, respectively). Sun et al.[Citation43] and Funebo and Ohlsson[Citation44] verified that is harder to correlate with food composition than
. In this work, it will be investigated whether it is possible to correlate the DPs of a group of juices from different citric fruits with their physicochemical characteristics in order to provide a generalized predictive model.
Objective
The objectives of this research were: (1) study the DPs and electrical conductivity of different citrus fruit juices that are relevant for microwave pasteurization at frequencies of 915 and 2450 MHz and temperatures between 0 and 90 °C, regarding properties ranges, temperature dependence, prevalent loss mechanism, and radiation penetration depth; (2) propose a generalized correlation for the prediction of the dielectric behaviour of citrus fruit juices at 915 and 2450 MHz for a wide range of temperature and physicochemical characteristics, such as the Brix/acid ratio. This model is based on the modification of the dielectric behaviour of water by the presence of soluble solids and ions.
Materials and methods
Sample preparation
The citrus fruits studied are shown in . Around 9 kg of each citrus fruit was purchased in a local market in the city of São Paulo (SP, Brazil) between July and September 2014. Fresh mature fruits were selected and washed and their juices were squeezed using a Fresh’N Squeeze Multi-Fruit juicer (FMC, Araraquara, Brazil) on the same day of purchase. This juicer can process 20 fruits per minute and each fruit is squeezed between two cups while the juice is collected and filtered from the inside avoiding contact with the peel and, consequently, the peel oil. Test tubes with 10 mL samples were stored at −30°C in a plasma freezer 349 FV (Fanem, São Paulo, Brazil) prior to the physicochemical characterization and determination of DPs and electrical conductivity.
Table 1. List of citrus fruits studied in this work and abbreviations used in text.
Blends between orange juices of different varieties can be made at the industry to reach the desired levels of acidity and sweetness. For instance, Lima orange juice can be used to reduce the acidity of Pera orange juice due to its higher .[Citation18,Citation45] Therefore, samples of these two juices were mixed in proportions of 25%, 50%, and 75% of Pera juice and their DPs and electrical conductivity were determined. The objective is to verify whether there are any interaction effects on the DPs or whether the blend behaves as an ideal mixture.
Physicochemical characterization
The juices were characterized by their (°Brix), total solids content (
, g/100g), potential of hydrogen (
, –), titratable acidity (
, %citric acid), and electrical conductivity at 20°C (
, mS/cm). All the measurements were conducted in triplicate. Soluble solids were determined with a portable refractometer 711849 (Carl Zeiss, Jena, Germany) at 20°C. Total solids were determined according to AOAC[Citation46] using a vacuum oven MA030 (Marconi, Piracicaba, Brazil) at 100 mmHg and 70°C for 6 h. The pH at 20°C was measured using a pH meter Tec-3MP (Tecnal, Piracicaba, Brazil). The TA was determined according to AOAC[Citation46] using a pH-Stat PHM-290 (Radiometer, Copenhagen, Denmark) and expressed as citric acid percentage. Electrical conductivity at 20°C was determined using a YSI3200 conductivity meter with a YSI3552 cell (YSI, Yellow Springs, USA).
Electrical conductivity measurements
The electrical conductivity (, mS/cm) of the juices were measured at temperatures between 0°C and 90°C with increments of 10°C. The temperature was maintained using a TC500 thermostatic oil bath (Brookfield, OH, USA) and verified with a digital thermometer (Mileto, São Paulo, Brazil). Conductivity measurements were made in triplicates as described in the previous section.
DPs measurements
The relative electrical permittivity and the dielectric loss factor (,
) of the juices were determined using the open-ended coaxial line probe method. An 85070E Dielectric Probe Kit (performance configuration) connected to an E5061B Network Analyzer (Agilent Technologies, Bayan Lepas, Malaysia) was employed. Based on the reflection coefficient of the sample, the software 85070E calculated the DPs. An 85093C Electronic Calibration Module was used to minimize interferences. After warming up, calibration of the equipment was performed with three standards: open circuit (air), short circuit, and deionized water at a known room temperature. After calibration, the probe and cable were not moved.
An Erlenmeyer flask with 240 mL of the juice was placed in a TC-550 thermostatic oil bath (Brookfield, OH, USA) to reach the desired temperature, which was verified with a digital thermometer (Mileto, São Paulo, Brazil). The flask with the sample was then taken to the probe stand and raised so that the probe tip was submerged with at least 1 cm of juice around the tip without the presence of attached air bubbles. The measurement lasted 35 s. After that, the flask was returned to the bath and the temperature was adjusted to the next level. This procedure was repeated in triplicate with different samples of the same batch. The frequency sweep was from 500 MHz (lower limit of the probe) to 3000 MHz (upper limit of the network analyzer) at 101 discrete frequencies on a logarithmic scale. After each measurement, the probe was cleaned with distilled water and dried.
Data analysis
Physicochemical determinations, electrical conductivity measurements, and DP measurements were made in triplicates (different samples from the same batch). Mean values and standard deviations were calculated. Tukey’s test was used to analyze statistical differences among means of the physicochemical parameters ( < 0.05). All statistical analyses were made with software Statgraphics Centurion XV (StatPoint, VA, USA).
The penetration depth (, m) of the incident microwaves over a semi-infinite body is defined as the depth in which its power is reduced to 36.8% (inverse of the Euler number) and it was calculated for each temperature and frequency as
where is the speed of light in free space (2.9979 × 10⁸ m/s) and
is the frequency of the electromagnetic wave (Hz).[Citation47] Relative permittivity and loss factor were plotted against frequency for all temperatures. DPs at the frequencies of 915 and 2450 MHz, which are commonly used for microwave heating, were calculated by linear interpolation for each run. The main results (
,
,
) at these two frequencies and the electrical conductivity (
) were correlated with temperature (0 ≤
≤ 90°C) using a polynomial regression tool. The polynomial order was selected based on the coefficient of determination (
), on the statistical significance of the parameters (
< 0.01), and on the residuals distribution.
The relative contributions of the ionic conduction and dipolar rotation mechanisms to the loss factor were calculated as follows:
where the loss due to ionic conduction () was calculated from Eq. (3) using the measured electrical conductivity and the loss due to dipolar rotation (
) was obtained by difference from Eq. (2).[Citation12] From Eqs. (2), (5a), and (5b), it can be seen that
+
= 100%. The results are plotted against temperature for the frequencies of 915 and 2450 MHz. Relative permittivity, loss factor, and electrical conductivity of the blends of Pera and Lima juices were measured to verify whether it is possible to estimate these properties from the linear combination of the values for the juices (at 915 and 2450 MHz):
where is the volumetric fraction of Pera juice in the blend.
Lastly, DPs (,
) of the various citrus juices were grouped and correlated with physicochemical parameters (
,
,
,
,
) and temperature (
) at the frequencies of 915 and 2450 MHz. Since the temperature range was broader than the range of the physicochemical parameters, it was necessary to isolate the temperature effect, at least partially, before correlating data with the physicochemical parameters. To perform this, the DPs of the juices were modelled based on the behaviour of pure water using a semiempirical approach.
The main contribution to the relative permittivity of the juice comes from the polarization of the free water molecules. The presence of dissolved substances can disrupt the alignment of these molecules and the permittivity of the juice should be lower than that of pure water at the same temperature and frequency.[Citation13] Moreover, the presence of soluble and insoluble material has a low volumetric contribution to polarization compared with pure water.[Citation43] Consequently, the relative permittivity of the juice was expressed as
where is the water permittivity correction factor (0 <
< 1) and
is the relative permittivity of pure water at the same temperature and frequency. In the case of the loss factor, the presence of dissolved substances shifts the relaxation frequency of water to lower frequencies, thus increasing its dipolar loss for frequencies below the relaxation peak.[Citation37] Consequently, the loss factor of the juice was expressed, based on Eqs. (2) and (3), as follows:
where is the water dipolar loss correction factor (
> 1) and
is the loss factor of pure water at the same temperature and frequency. In this work, the permittivity correction factor
was calculated from Eq. (7) using the experimental values of permittivity of the juices and the permittivity of water from Franco et al.[Citation13] (0 <
< 90°C):
This dipolar loss correction factor was calculated from Eq. (8) using the experimental values of loss factor and electrical conductivity of the juices at the same temperature (replicates were paired to propagate the uncertainty to
). The loss factor of water was estimated from Franco et al.[Citation13] (0 <
< 90 °C):
First, the values obtained for and
at 915 and 2450 MHz were correlated with temperature for each juice through polynomial regression to verify the model consistency and to see how the temperature dependency was like. Then, the correction factors from all juices were correlated with
,
,
, and
.
and TA were not used as factors because it was verified that they correlated with
and
, respectively. Squared factors
,
,
, and
were tested to check whether there was a significant improvement in the model fitting. The multiple regression tool of Statgraphics Centurion XV (StatPoint, VA, USA) was used and the correlations obtained were evaluated based on the statistical significance of the factors (
< 0.01), on the adjusted coefficient of determination (
, on the number of model parameters, and on the residuals distribution.
Results and discussion
Physicochemical properties
The physicochemical parameters determined for the juices are presented in . The pH ranged from 2.3 (Sicilian and Tahiti) to 5.9 (Lima) and the SS varied between 7 °Brix (Sicilian) and 15 °Brix (Ponkan). The Brix/acid ratio was calculated as and three main levels were observed: around 1.5 (Sicilian and Tahiti), between 17 and 30 (Pera, Navel, Ponkan, Murcott and Mediter), and 175 (Lima).
Table 2. Physicochemical characterization of the citrus fruit juices.1
Pera is one of the main varieties used for orange juice production in Brazil and the Ministry of Agriculture, Livestock and Food Supply regulates the limits of ≥ 10.5 °Brix and Ratio ≥ 7.0.[Citation18,Citation48] According to the United States Department of Agriculture, the requirements for Grade A unsweetened pasteurized orange juice are
≥ 11.0 °Brix and 11.5 ≤ Ratio ≤ 18.0.[Citation49] The lower acidity of the Lima variety makes it suitable to correct an orange juice with low ratio.[Citation45]
Electrical conductivity
The electrical conductivity of the juices is related to the mobility of solvated ions and it is an important parameter for processing foods using pulsed electric fields, ohmic heating, radio frequency heating, or microwave heating. For all the juices tested, a linear correlation with temperature was observed (), as is common with this type of food product.[Citation12,Citation13,Citation50–Citation52] The coefficients of the linear regression are presented in along with the coefficient of determination and the standard error of estimate (). The conductivity can be calculated as
Figure 1. Electrical conductivity of citrus juices as a function of temperature including linear regressions from Eq. (11) and .
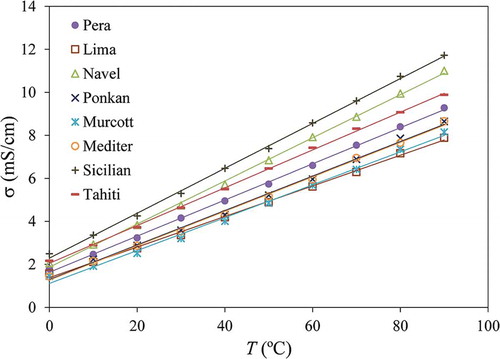
Table 3. Linear regression parameters determined for the temperature dependence on the electrical conductivity of the citrus fruit juices (between 0 and 90°C), along with standard errors of estimate and coefficients of determination.
Table 4. Polynomial regression parameters determined for the temperature dependence on the relative electric permittivity (ε’) of the citrus fruit juices (between 0 and 90°C) for the frequencies of 915 and 2450 MHz, along with standard errors of estimate and coefficients of determination.
DPs
shows the results (average of triplicate) of the DPs determination for the Pera orange juice for temperatures between 0°C and 90°C and in the frequency range of 500–3000 MHz. The top plot shows the relative electrical permittivity () and frequency and temperature increases can be seen to have negative effects on this parameter. As the temperature increases, the molecular motion intensifies and, consequently, the polarization of the media is less effective. As for the frequency effect, as it increases, the polarization of the water molecules also become less effective, thus promoting dipolar loss.[Citation8,Citation13]
Figure 2. Dielectric properties of Pera orange juice (average of triplicate) for temperatures between 0°C and 90°C and in the frequency range of 500–3000 MHz. Top: relative electrical permittivity (). Middle: dielectric loss factor (
). Bottom: Cole–Cole plot of the complex permittivity (
).
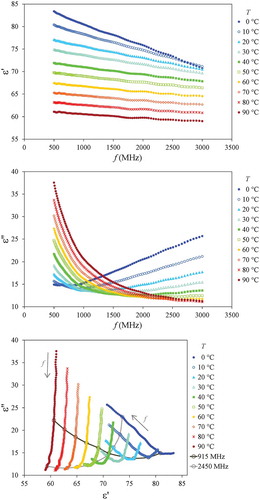
In comparison with the electrical permittivity of water reported by Franco et al.[Citation13] for the same frequency and temperature ranges, the permittivity of the juice is slightly smaller (between 0% and 7%). This can be explained by the reduction in water activity and by the volumetric contribution of soluble and insoluble solids that have a lower permittivity.[Citation12,Citation43]
The middle plot in shows the dielectric loss factor (). As shown in Eq. (2), two mechanisms contribute to the dipolar loss in this frequency range: ionic and dipolar. Ionic loss is favoured by higher temperatures (improvement of ionic motion) and lower frequencies (increase of the length of ionic motion). This behaviour can be better observed at the lowest frequency (500 MHz). On the other hand, dipolar loss is related to the dipolar relaxation of the water molecule. The relaxation peak of water can be found at frequencies higher than those studied in this work (17.0 GHz for pure water at 20°C[Citation53]), but the loss increase with frequency can be clearly seen for the lower temperatures (0°C, 10°C, and 20°C). As a temperature raise shifts the relaxation peak to higher frequencies[Citation37,Citation53], the dipolar dielectric loss decreases for a given frequency. This trend can be better seen at the highest frequency (3000 MHz) in . The behaviour observed in the loss factor plot from 500 MHz to 3000 MHz can be interpreted as the transition from an ionic-governed loss to a dipolar-governed loss.[Citation7,Citation53]
The results for the other juices are not shown here since the behaviour is quite similar to the one shown in for the Pera orange juice, as was observed by Siguemoto and Gut[Citation12] for the juices of different apple varieties. The main differences observed among varieties are related to ionic conduction. Juices with higher conductivity have higher loss factors at lower frequencies, for instance, Sicilian lemon juice can reach = 46 at 90°C and 500 MHz. At higher frequencies, the dipolar loss is mostly linked to water content, which is similar among juices (); thus, the variation was smaller. Differences among juices will be better discussed ahead for the commercial frequencies of 915 and 2450 MHz.
The bottom plot in is the Cole–Cole plot that represents the permittivity in the complex plane. For some temperatures, an inflection point can be clearly noted in the convex curve. This point indicates the shift of the dominant loss mechanism between ionic and dipolar as frequency changes. Taking the 20°C curve, for instance, as the frequency increases from 500 MHz to 3000 MHz, the dominant loss mechanism changes from ionic to dipolar with a minimum loss close to 1.4 GHz.
The DPs and electrical conductivity of the orange juices obtained in this study follow the same trends observed in other liquid foods for similar ranges of frequency and temperature, such as fruit juices[Citation9,Citation11,Citation51], fruit pulps[Citation25], apple juices[Citation12], green coconut water,[Citation13,Citation14] and milk[Citation21,Citation54].
Dielectric behaviour at commercial frequencies
Results for relative permittivity, loss factor, and penetration depth ( calculated with Eq. (4)) are presented in for the commercial frequencies of 915 and 2450 MHz and for temperatures between 0°C and 90°C. Permittivity of the juices showed a linear decrease with temperature at 915 MHz and a quadratic decrease at 2450 MHz. Polynomial regressions for
are presented in , along with the standard errors of the estimate, which were less than 0.5, and the coefficients of determination. The relative permittivity can be calculated as
Figure 3. Relative electrical permittivity (), dielectric loss factor (
), and microwave penetration depth (
, mm) of the citrus fruit juices for temperatures between 0°C and 90°C and at frequencies of 915 MHz and 2450 MHz including the polynomial regressions from Eqs. (12), (13), and (14) and , , and .
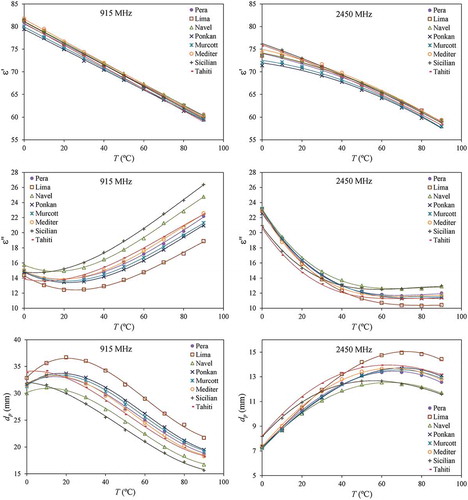
Relative permittivity did not show a strong variation among juices at these frequencies, as can be seen in , which could be explained by the similar water content () as the water molecule is responsible for media polarization. On the other hand, the loss factor presented more distinct results among juices at 915 MHz, but not at 2450 MHz. This can be related to the ionic loss, which is more relevant at lower frequencies and depends on the electrical conductivity of the juice. shows that Sicilian, Navel, and Tahiti are juices with high conductivities. This observation is consistent with the loss factor plot in at 915 MHz as these juices also show high values of . The polynomial regressions for the loss factor data in are presented in , including the standard errors of the estimate, which were under 0.6, and the coefficients of determination. The loss factor of the juices can thus be calculated as
Table 5. Polynomial regression parameters determined for the temperature dependence on the dielectric loss factor (ε”) of the citrus fruit juices (between 0 and 90°C) for the frequencies of 915 and 2450 MHz, along with standard errors of estimate and coefficients of determination.
Figure 4. Contribution of ionic conduction to the loss factor () of the citrus fruit juices at frequencies of 915 MHz and 2450 MHz as calculated from Eqs. (2) and (6a) using the correlations in Eq. (11) and for electrical conductivity and Eq. (13) and for loss factor. Dotted lines indicate the region of contribution between 45% and 55%.
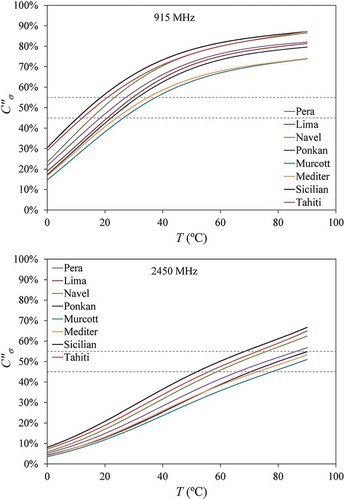
shows that, for the frequency of 915 MHz, temperatures above 30°C provide increasing losses; however, at 2450 MHz, the loss factor drops with temperature from 0°C to 60°C and reaches approximately stable values. The different effects of temperature at these two frequencies indicate differences in the dominant loss mechanism. To better evaluate the ionic and dipolar contributions to the loss factor of the juices, Eqs. (5a)–(5b) were used to calculate the relative contributions using the adjusted polynomials in . The results of are displayed in . The dotted lines delimit the region for
between 45% and 55%, where the ionic and dipolar contributions to the dielectric loss are closely balanced. This balance happens around 25°C at 915 MHz and around 75°C at 2450 MHz, depending on the juice.
When the loss mechanisms are balanced, temperature variations have a smaller effect on the loss factor and, consequently, the penetration depth of the microwaves remains constant, as can be noted in . When the main loss mechanism is ionic, has a positive effect on
; therefore, the penetration depth decreases as the hot surface starts to absorb more power. This phenomenon is commonly referred to as “thermal runaway”: the high-temperature parts of the product have a higher heating rate and, consequently, temperature distribution becomes increasingly nonuniform. On the other hand, when the main loss mechanism is dipolar,
has a negative effect on
, and provides a “temperature levelling effect”, in which the high-temperature parts of the product have a smaller heating rate, thus providing a more uniform temperature distribution.[Citation5]
Regarding temperature uniformity, heating citrus juices at 2450 MHz would prevent thermal runaway, but the penetration depth is smaller than at 915 MHz. Nevertheless, the heating pattern depends strongly on the shape and dimensions of the sample and the geometry of the microwave cavity. Computational simulation of the microwave heating of a food product, using correlations for the DPs, is important to analyze the heating pattern and optimize the process.[Citation3,Citation4,Citation55]
Zhu et al.[Citation11] determined the DPs of the juice of navel oranges (Gannan variety) purchased in Xi´an China for temperatures between 15°C and 95°C and presented regression polynomials for predicting and
at 915 and 2450 MHz. The juice had a TS of 10.7% ± 0.3%,
= 4.72 ± 0.13, and
= 3.05 ± 0.19 mS/cm at 25°C. In comparison, the Navel juice in this work had
= 12.2 ± 0.2 °Brix,
= 3.97 ± 0.10, and
= 4.38 ± 0.16 mS/cm at 25°C (from Eq. (11) and ). Comparing the experimental data in this work with the predictions from Zhu et al.[Citation11] for temperatures between 20°C and 90°C, there is a mean absolute difference of 2.0 ± 1.4 at 915 MHz and of 1.9 ± 1.2 at 2450 MHz. The
curves show different slopes and cross near 45°C. For the loss factor, the curves show the same trend, but the results from this work are higher, with a mean absolute difference of 4.5 ± 1.5 at 915 MHz and 2.9 ± 1.7 at 2450 MHz. This difference can be explained by the lower electrical conductivity of the Gannan navel orange juice.
Dielectric behaviour of juice blends
Since blending juices from different citrus varieties is practiced by the industry, the DPs and electrical conductivity of the blend can be predicted by the linear combination of the values of the unmixed juices at the frequencies of 915 and 2450 MHz. Samples of Pera and Lima juices were mixed in proportions of 25%, 50%, and 75% of Pera juice and the properties predicted by Eqs. (6a), (6b), and (8) were compared to the experimental values. Linear behaviour (ideal mixture) was confirmed, with no mixture or interactions effects. shows that the mean absolute errors for and
are quite similar and mostly under 1%. Thakur et al.[Citation56] observed interesting interaction effects in the DPs of a mixture of condensed milk and distilled water at room temperature and frequencies between 0.6 and 3.0 GHz. As water was added to the condensed milk, the electrical conductivity increased because of the release of bounded ions; consequently, the dielectric loss also increased. This trend continued until the addition of water started only to dilute the free ions, then the dielectric loss started to decrease. As for the relative permittivity, the value of
of the mixture was slightly higher than that expected by linear combination (non-interactive and distributive system). Since the major contribution to
comes from the presence of water in the mixture, the difference can be explained by changes in the form of water bonding to the soluble matter.[Citation39,Citation43]
Table 6. Absolute errors for the prediction of dielectric properties (,
) and electrical conductivity (
) of orange juice blends made with Pera and Lima fruits (means and standard deviation for temperatures between 0 and 90°C)
Strong interaction effects in mixtures were also observed by Smith Jr. et al.[Citation57] when studying the relative permittivity and relaxation frequency of mixtures of water and alcohols (methanol, ethanol, and propanol). The excess permittivity of the mixtures was negative as opposed to the results from Thakur et al.[Citation56] for condensed milk and water mixtures. The changes in the dielectric relaxation times of the water and alcohols mixtures are linked with the structures of the hydrogen bounding and clustering in the mixture. Álvarez et al.[Citation58] also detected nonideal mixing of grape pomace, ethanol, and water. In the case of the mixture of the two orange juices in this work, no interaction effects could be detected since they share the same solvent and similar composition. Therefore, the DPs of juice blends can be calculated by linear combination using the volumetric fraction.
Prediction of the dielectric behaviour based on physicochemical parameters
As observed in , there is a variation among the DPs of the various citrus fruit juices. The temperature dependence was empirically modelled through polynomial regression and the results for and
are presented in and , respectively. The objective of this part of the study was to correlate the DPs of the juices at the commercial frequencies with the physicochemical parameters in order to obtain a general correlation for citrus juices.
The proposed model in Eqs. (7) and (8) is based on the DPs of water, on the calculated ionic loss (Eq. (3)), and on two parameters: the permittivity correction factor () and the dipolar loss correction factor (
). First, these two parameters were calculated for the frequencies of 915 and 2450 MHz using Eqs. (7) and (8), the polynomial correlations for the DPs of pure water in Eqs. (9a), (9b), (10a), and (10b), the linear correlations for electrical conductivity of the juices in and Eq. (11), and the polynomial correlations for the DPs of the juices in and and Eqs. (12) and (13). The results are shown in .
Figure 5. Correction factors for the relative electrical permittivity of water () and for the dipolar loss factor of water (
) calculated for the citrus fruit juices at frequencies of 915 MHz and 2450 MHz using Eqs. (7)–(10b) and the correlations in Eqs. (12) and (13) , , and .
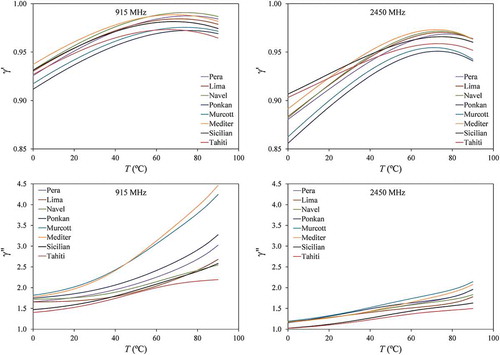
It was verified that < 1 and
> 1, implying that the presence of the soluble and insoluble substances of the juices reduces the permittivity of water and increases the dipolar loss. The permittivity reduction was more prominent at 2450 MHZ than at 915 MHz, whereas the dipolar loss increase was more intense at 915 MHz than at 2450 MHz. Even though these correction factors were defined based on the behaviour of pure water, noticeable temperature dependence (no-linear) was still observed. In order to better evaluate the significance of this temperature dependence, the experimental uncertainty was introduced. Factors
and
were once more calculated with Eqs. (7) and (8), but now using the experimental values of DPs and electrical conductivity (paired triplicates). Results were correlated with temperature for each juice and it was verified that
can be correlated with temperature by a second-order polynomial and that
correlates linearly with temperature (
< 0.01).
The next step was to correlate and
with the physicochemical parameters as well. The parameters available were:
,
,
,
and electrical conductivity at 20°C (
). Since it was verified that
and
were correlated, likely as
and
, the physicochemical factors selected were only
,
, and
. Significance of the squared factors
,
, and
was also tested to determine whether they bring any improvement to the model fitting.
The data of and
at 915 and 2450 MHz was correlated with the selected factors using a multiple regression tool. The uncertainties on
,
, and
were introduced by means of their standard deviations and paired with the DPs and conductivity data. The total number of observations were 8 juices × 10 temperatures × 3 measurements = 240. Regression results were analysed based on the statistical significance of the factors (
< 0.01), on the adjusted coefficient of determination (
), on the number of model parameters, and on the residuals distribution. brings the parameters of the best correlations obtained, which are valid for citrus juices with 2.26 ≤
≤ 5.85, 7.0 ≤
≤ 14.5, and 2.52 ≤
≤ 4.25 mS/cm at temperatures between 0°C and 90°C. Squared temperature and squared
showed important contribution as factors for some correlations. The correction factors
and
can thus be calculated as
Table 7. Multiple regression parameters determined for the correlation of the corrections factors ( and
at 915 and 2450 MHz) of the citrus fruit juices with temperature and physicochemical parameters, along with standard errors of estimate and adjusted coefficients of determination
Factor correlated with
and
, as was verified individually for each juice (). SS and pH were important factors to distinguish among juices. Since the permittivity of the juice comes majorly from the water molecules, the presence of soluble solids reduces this permittivity by bounding water molecules and by a poor volumetric contribution to polarization. Consequently, a negative contribution from
was determined (
in ). This was also observed by Kuang and Nelson[Citation28] when studying the permittivity of various fresh fruits and vegetables and by Zhang et al.[Citation37], who studied the DPs of a gellan gel as affected by the addition of sucrose and NaCl.
The linear and quadratic contributions from seem to indirectly introduce particular characteristics of the juices in the model, since there is no straight connection between permittivity and pH. The adjusted coefficient of determination and the standard errors of estimate were good () and the parity charts for the observed versus predicted values of
(not shown) presented a fairly good distribution of residuals with preferably positive or negative residuals for each juice.
In the case of factor , there was a significant and positive temperature effect (
in ). Linear and quadratic effects of the pH were also important to distinguish among juices; however, the electrical conductivity “replaced” the SS in the correlation. This was not expected because the ionic contribution was theoretically separated from the measured loss factor using Eq. (8) so that the correction factor
corresponds only to the dipolar loss from water molecules. Factor
can be considered as an indicator of the dissolved salts, as was the ash content in the work of Sun et al.[Citation43].
The adjusted coefficient of determination for and the standard errors of estimate were not so good as those obtained for
() and the residuals were not evenly distributed, showing a slightly curved and increasing pattern with increasing
(not shown). This means that the proposed factors (
,
,
,
,
,
,
, and
) and linear model were not sufficiently adequate to model the behaviour of
. Fortunately, higher residuals were obtained in conditions where the ionic contribution to the dielectric loss exceeds that of the dipolar contribution; consequently, when the contributions are added using Eq. (8), the influence of the residual in the prediction of
is minimal. Sun et al.[Citation43] and Funebo and Ohlsson[Citation44] also verified that
is harder to correlate with food composition than
.
In order to better evaluate the performance of the predictive model herein proposed, presents the parity charts for the predicted DPs (calculated from Eqs. (7), (8), (9a), (9b), (10a), (10b), and (14) with parameters from ) as a function of the observed properties. It is possible to note a very good prediction for the relative permittivity of the juices at 915 and 2450 MHz with = 0.9961 and
= 0.9898, respectively. The mean absolute error for
was only 0.49% ± 0.35% at 915 MHz and 0.58% ± 0.48% at 2450 MHz.
Figure 6. Parity charts for predicting the relative electrical permittivity () and the dielectric loss factor (
) of the citrus fruit juices using the proposed semiempirical model and the correlation in Eq. (15) and .
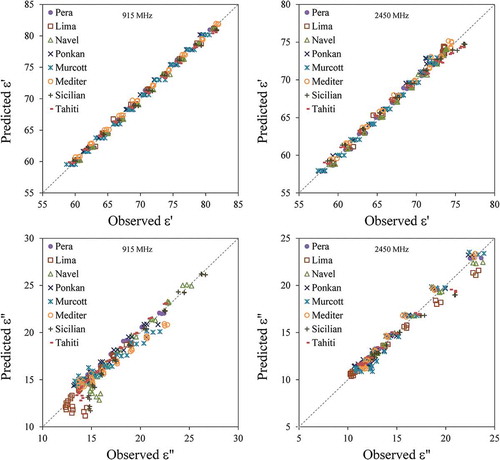
For predicting the loss factor of the juices at 915 and 2450 MHz, the mean absolute error was 4.1% ± 3.9% at 915 MHz and 2.8% ± 2.3% at 2450 MHz; furthermore, = 0.9273 at 915 MHz and
= 0.9722 at 2450 MHz. For
< 16 at 915 MHz, larger errors can be observed in for the Lima, Navel, Sicilian, and Tahiti varieties. These points correspond to temperatures of 0°C and 10 °C, which are not of importance for pasteurization processes. shows that, at lower temperatures, the loss is mainly dipolar; consequently, the error in the correction factor
weighs in the prediction of
. For higher temperatures, the dielectric loss is balanced or mainly ionic ().
Future works should explore temperatures above 90°C using a sealed measurement cell and also investigate factors that contribute to the dielectric response of juices from different types of fruits in order to develop prediction models valid for larger groups of food products.
Conclusions
The ranges of the main physicochemical properties of the eight juices were: pH between 2.26 and 5.85, soluble solids between 7.0 and 14.5 °Brix, and Brix/acid ratio between 1.26 and 29.9. Electrical conductivity of the juices showed a linear positive temperature dependence varying between 2.5 and 4.3 mS/cm at 20°C. At 915 and 2450 MHz, relative permittivity decreased with temperature and there was small variation among juices since polarization comes from free water molecules and the water content was similar. On the other hand, loss factor showed significant variation among juices, especially at 915 MHz, since the ionic contribution to loss is more important at this frequency and the electrical conductivity of the juices was quite variable. Consequently, salt content is a key component for the prediction of the dielectric behaviour at 915 MHz. At 2450 MHz, the dipolar contribution to the loss was more prominent in the studied temperature range. Generally, the loss factor increased with temperature at 915 MHz and decreased with temperature at 2450 MHz, which indicates the prevalence of different loss mechanisms at these frequencies. The calculated penetration depth indicates that heating at 2450 MHz should be more uniform (temperature levelling effect), but the penetration depth is considerably smaller than at 915 MHz. The study of the juice blends did not show interaction effects regarding the DPs and electrical conductivity, which could be linearly predicted from the volumetric fractions (ideal mixture). A model to predict the dielectric behaviour of the group of citrus juices at 915 and 2450 MHz was successfully adjusted using SS (°Brix), hydrogen potential (), electrical conductivity at 20°C, and temperature as parameters. The linear temperature dependence of the electrical conductivity must be known to evaluate the ionic loss. The model, which was based on the dielectric behaviour of pure water and the calculated ionic loss, was able to predict the relative permittivity with absolute errors around 0.5% and the loss factor with errors around 4%. Such a comprehensive model is useful to predict the dielectric behaviour of citrus fruit juices taking into account variations in physicochemical characteristics instead of relying on correlations that are specific for a given variety or cultivar.
Nomenclature
| = | polynomial coefficient of order i | |
| = | speed of light in free space (2.9979 × 10⁸ m/s) | |
| = | relative contribution of ionic conduction to the loss factor (%) | |
| = | relative contribution of dipole rotation to the loss factor (%) | |
| = | penetration depth (m) | |
| = | field frequency (Hz) | |
| = | imaginary unit | |
| = | statistical p-value (–) | |
| = | potential of hydrogen (–) | |
| = | coefficient of determination (–) | |
| = | adjusted coefficient of determination (–) | |
| = | soluble solids content (°Brix) | |
| = | temperature (°C) | |
| = | total solids content (g/100g) | |
| = | titratable acidity (%citric acid) | |
| = | volumetric fraction in a blend (–) |
Greek letters
| = | water permittivity correction factor (–) | |
| = | water dipolar loss correction factor (–) | |
| = | complex relative permittivity (–) | |
| = | relative electrical permittivity of free space (8.854×10⁻¹² F/m) | |
| = | relative electrical permittivity (–) | |
| = | relative electrical permittivity of water (–) | |
| = | dielectric loss factor (–) | |
| = | dielectric loss factor of water (–) | |
| = | dielectric loss factor due to dipole rotation (–) | |
| = | dielectric loss factor due to ionic conduction (–) | |
| = | pi number (3.1416) | |
| = | DC electrical conductivity (S/m) | |
| = | DC electrical conductivity at 20 °C (S/m) | |
| = | standard error of estimate | |
| = | angular frequency (rad/s) |
Funding
The authors acknowledge financial support from the São Paulo Research Foundation (FAPESP) under grants 2012/04073-0 and 2013/07914-8 and also the scholarships provided by the Coordination for the Improvement of Higher Education Personnel (CAPES) and by the National Council for Scientific and Technological Development (CNPq).
Additional information
Funding
References
- Sun, D.W. Emerging Technologies for Food Processing (2nd Ed). Academic Press of Amsterdam: Netherlands, 2014.
- Kumar, P.; Coronel, P.; Truong, V.D.; Simunovic, J.; Swartzel, K.R.; Sandeep, K.P.; Cartwright, G. Overcoming Issues Associated with the Scale-up of a Continuous Flow Microwave System for Aseptic Processing of Vegetable Purees. Food Research International 2008, 41(5), 454–461.
- Vrba, J.; Jansen, R.H.; Tamnjong, R. Tunable Single Mode Resonant Cavity Suitable for Continuous flow Microwave Processing of Liquids. Proceedings of the 39th European Microwave Con-ference, Roma, Italia, 2009; 177–180.
- Salvi, D.; Boldor, D.; Aita, G.M.; Sabliov, C.M. COMSOL Multiphysics Model for Continuous Flow Microwave Heating of Liquids. Journal of Food Engineering 2011, 104(3), 422–429.
- Tang, J.; Chan, T.V.C.T. Microwave and Radio Frequency in Sterilization And Pasteurization Applications. In: Heat Transfer in Food Processing; Yanniotis, S.; Sundén, B.; Eds.; WIT Press; Southampton, Boston: USA, 2007, 101–157.
- Datta, A.K.; Sumnu, G.; Raghavan, G. Dielectric properties of food. In: Engineering Properties of Foods; Rao, M.A.; Rizvi, S.; Datta, A.K.; Eds.; CRC Press, Boca Raton Publishing, 2005; 101-147.
- Ryynänen, S. The Electromagnetic Properties of Food Materials: A Review of the Basic Principles. Journal of Food Engineering 1995, 26(4), 409–429.
- Icier, F.; Baysal, T. Dielectric Properties of Food Materials 1: Factors Affecting and Industrial uses. Critical Reviews in Food Science and Nutrition 2004, 44(6), 465–471.
- Garcia, A.; Torres, J.L.; Prieto, L.; De Blas, M. Dielectric Properties of Grape Juice at 0.2 and 3 GHz. Journal of Food Engineering 2001, 48(3), 203–211.
- Guo, W.; Zhu, X.; Nelson, S.O. Permittivities of Watermelon Pulp and Juice and Correlation with Quality Indicators. International Journal of Food Properties 2013, 16(3), 475–484.
- Zhu, X.; Guo, W.; Wu, X. Frequency and Temperature Dependent Dielectric Properties of Fruit Juices Associated with Pasteurization by Dielectric Heating. Journal of Food Engineering 2012, 109, 258–266.
- Siguemoto, E.S.; Gut, J.A.W. Dielectric Properties of Cloudy Apple Juices Relevant to Microwave Pasteurization. Food and Bioprocess Technology 2016, 9(8), 1345–1357.
- Franco, A. P.; Yamamoto, L.Y; Tadini, C.C.; Gut, J.A.W. Dielectric Properties of Green Coconut Water Relevant to Microwave Processing: Effect of Temperature and Field Frequency. Journal of Food Engineering 2015, 155, 69–78.
- Shah, N.S.; Shah, P.S.; Rana, V.A. Dielectric and Electrical Properties of Coconut Water and Distilled Water in the Frequency Range 20 Hz to 2 MHz at Different Temperatures. Ionics 2015, 21(12), 3217–3222.
- Guo, W.; Zhu, X.; Liu, Y.; Zhuang, H. Sugar and Water Contents of Honey with Dielectric Property Sensing. Journal of Food Engineering 2010, 97(2), 275–281.
- Guo, W.; Liu, Y.; Zhu, X.; Wang, S. Temperature-dependent dielectric properties of honey associated with dielectric heating. Journal of Food Engineering 2011, 102(3), 209–216.
- Kudra, T.; Raghavan, G.; Akyel, C.; Bosisio, R.; Van De Voort, F. Electromagnetics Properties of Milk at its Constituents at 2.45 GHz. Journal of Microwave Power & Electromagnetic Energy 1992, 27(4), 199–204.
- Neves, M.F.; Trombin, V.G.; Milan, P.; Lopes, F.F.; Cressoni, F.; Kalaki, R. O retrato da citricultura brasileira; CitrusBR, São Paulo: Brasil, 2011.
- Coronel, P.; Simunovic, J.; Sandeep, K. P.; Kumar, P. Dielectric Properties of Pumpable Food Materials at 915 MHz. International Journal of Food Properties 2008, 11(3), 508–518.
- Guo, W.; Zhu, X.; Liu, H.; Yue, R.; Wang, S. Effects of Milk Concentration and Freshness on Microwave Dielectric Properties. Journal of Food Engineering 2010, 99, 344–350.
- Zhu, X.; Guo, W.; Jia, Y. Temperature-dependent Dielectric Properties of Raw Cow’s and Goat’s Milk from 10 to 4,500 MHz Relevant to Radio-frequency and Microwave Pasteurization Process. Food Bioprocess Technology 2014, 7(6), 1830–1839.
- Zhu, X.; Guo, W.; Jia, Y.; Kang, F. Dielectric Properties of Raw Milk as Functions of Protein Content and Temperature. Food Bioprocess Technology 2015a, 8(3), 670–680.
- Watanabe, K.; Taka, Y.; Fujiwara, O. Cole-Cole Measurement of Dispersion Properties for Quality Evaluation of Red Wine. Measurement Science Review 2009, 9(5), 113–116.
- Wang, J.; Tang, J.; Wang, Y.; Swanson, B. Dielectric Properties of Egg Whites and Whole Eggs as Influenced by Thermal Treatments. LWT - Food Science and Technology 2009, 42(7), 1204–1212.
- Seaman, R.; Seals, J. Fruit Pulp and Skin Dielectric Properties for 150 MHz to 6400 MHz. Journal of Microwave Power & Electromagnetic Energy 1991, 26(2), 72–81.
- Nelson, S.O.; Forbus, W. R; Lawrence, K.C. Microwave Permittivities of Fresh Fruits and Vegetables from 0.2 to 20 GHz. Transactions of ASAE 1994, 37(1), 183–189.
- Nelson, S.O.; Forbus, W. R; Lawrence, K. C. Permittivities of Fresh Fruits and Vegetables at 0.2 to 20 GHz. Journal of Microwave Power & Electromagnetic Energy 1994, 29(2), 81–93.
- Kuang, W.; Nelson, S.O. Dielectric Relaxation Characteristics of Fresh Fruits and Vegetables from 3 to 20 GHz. Journal of Microwave Power & Electromagnetic Energy 1997, 32(2), 114–122.
- Nelson, S. O. Frequency– and Temperature–dependent Permittivities of Fresh Fruits and Vegetables from 0.01 to 1.8 GHz. Transactions of the ASAE 2003, 46(2), 567–574.
- Nelson, S.O. Dielectric Spectroscopy of Fresh Fruit and Vegetable Tissues from 10 to 1800 MHz. Journal of Microwave Power & Electromagnetic Energy 2005, 40(1), 31–47.
- Wang, S.; Tang, J.; Johnson, J.; Mitchan, E.; Hansen, J.; Hallman, G.; Drake, S.R.; Wang, Y. Dielectric Properties of Fruits and Insect Pests as Related to Radio Frequency and Microwave Treatments. Biosystems Engineering 2003, 85(2), 4597–4605.
- Venkatesh, M.; Raghavan, G. An Overview of Microwave Processing and Dielectric Properties of Agri-Food Materials. Biosystem Engineering 2004, 88(1), 1–18.
- Sosa-Morales, M.E.; Valerio-Junco, L.; Lopez-Malo, A.; Garcia, H.S. Dielectric Properties of Food: Reported Data in the 21st Century and their Potential Applications. Food Science and Technology 2010, 43, 1169–1179.
- Ling, B.; Guo, W.; Hou, L.; Li, R.; Wang, S. Dielectric Properties of Pistachio Kernels as Influenced by Frequency, Temperature, Moisture and Salt Content. Food and Bioprocess Technology 2015, 8(2), 420–430.
- Zhu, X.; Guo, W.; Liang, Z. Determination of the Fat Content in Cow’s Milk Based on Dielectric Properties. Food and Bioprocess Technology 2015b, 8(7), 1485–1494.
- Llave, Y.; Mori, K.; Kambayashi, D.; Fukuoka, M.; Sakai, N. Dielectric Properties and Model Food Application of Tylose Water Pastes during Microwave Thawing and Heating. Journal of Food Engineering 2016, 178, 20–30.
- Zhang, W.; Luan, D.; Tang, J; Sablani, S.S.; Rasco, B.; Lin, H.; Liu, F. Dielectric Properties and Other Physical Properties of Low-Acyl Gellan Gel as Relevant to Microwave Assisted Pasteurization Process. Journal of Food Engineering 2015, 149, 195–203.
- Yaghmaee, P.; Durance, T.D. Predictive Equations for Dielectric Properties of NaCl, D-Sorbitol and Sucrose Solutions and Surimi at 2450 MHz. Journal of Food Science 2001, 67(6), 2207–2211.
- Roebuck, B.D.; Goldblith, S.A.; Westphal, W.B. Dielectric Properties of Carbohydrate-Water Mixtures at Microwave Frequencies. Journal of Food Science 1972, 37(2), 199–204.
- Delbos, G.; Bottreau, A.M.; Marzat, C.; Salefran, J.L. Microwave dielectric relaxation of aqueous solutions of dextran. Journal of Microwave Power 1978, 13(1), 69–75.
- Höchtl, P.; Boresch, S.; Steinhauser, O. Dielectric Properties of Glucose and Maltose Solutions. The Journal of Chemical Physics 2000, 112(22), 9810–9821.
- Liao, X.; Raghavan, V.G.S.; Meda, V.; Yaylayan, V.A. Dielectric properties of supersaturated α-D-glucose aqueous solutions at 2450 MHz. Journal of Microwave Power & Electromagnetic Energy 2001, 36(3), 131–138.
- Sun, E.; Datta A.; Lobo, S. Composition-based prediction of dielectric properties of foods. Journal of Microwave Power and Electromagnetic Energy 1995, 30(4), 205–212.
- Funebo T.; Ohlson, T. Dielectric Properties of Fruits and Vegetables as a Function of Temperature and Moisture Content. Journal of Microwave Power and Electromagnetic Energy 1999, 34(1), 42–54.
- Tribess, T.B.; Tadini, C.C. Inactivation Kinetics of Pectin Methylesterase in Orange Juice as a Function of pH and Temperature-Time Process Conditions. Journal of the Science of Food and Agriculture 2006, 86(9), 1328–1335.
- AOAC - Association of Official Analytical Chemists. Official methods of analysis of AOAC International., Washington, United States of America, 2010.
- Risman, P. Terminology and Notation of Microwave Power and Electromagnetic Energy. Journal of Microwave Power & Electromagnetic Energy 1991, 26(4), 243–250.
- MAPA - Ministry of Agriculture, Livestock and Food Supply. Instrução normativa n. 1, de 7 de janeiro de 2000: Aprova o regulamento técnico geral para fixação dos padrões de identidade e qualidade para polpa de fruta. In: Diário Oficial da União, 54-58, dated January 10, 2000.
- USDA - United States Department of Agriculture. United States Standards for Grades of Orange Juice. USDA: Washington, United States of America, 1983.
- Icier, F.; Ilicali, C. Temperature Dependent Electrical Conductivities of Fruit Purees during Ohmic Heating. Food Research International 2005, 38(10), 1135–1142.
- Zhang, H. Electrical Properties of Foods. In: Food Engineering at Encyclopedia of Life Support Systems; Barbosa-Canovas, G.; Ed.; EOLSS/UNESCO, FR: Paris, 2005.
- Amiali, M.; Ngadi, M.O.; Raghavan, V.G.S.; Nguyen, D.H. Electrical Conductivities of Liquid egg Products and Fruit Juices Exposed to High Pulsed Electric Fields. International Journal of Food Properties 2006, 9(3), 533–540.
- Kaatze, U. Complex Permittivity of Water as Function of Frequency and Temperature. Journal of Chemical Engineering Data 1989, 34(4), 371–374.
- Nunes, A.C.; Bohigas, X.; Tejada, J. Dielectric Study of Milk for Frequencies between 1 and 20 GHz. Journal of Food Engineering 2006, 76(2), 250–255.
- Tuta, S.; Palazoğlu, T.K. Finite element modeling of continuous-flow microwave heating of fluid foods and experimental validation. Journal of Food Engineering 2017, 192, 79–92.
- Thakur, K.P.; Cresswell, K.J.; Bogosanovich, M.; Holmes, W.S. Modeling the permittivity of liquid mixtures. Journal of Microwave Power and Electromagnetic Energy 1999, 34(3), 161–169.
- Smith Jr, R.; Lee, S.B.; Komori, H.; Arai, K. Relative Permittivity and Dielectric Relaxation in Aqueous Alcohol Solutions. Fluid Phase Equilibria 1998, 144 (1–2), 315–322.
- Álvarez, A.; Fayos-Fernández, J.; Monzó-Cabrera, J.; Cocero, M.J.; Mato, R.B. Measurement and Correlation of the Dielectric Properties of a Grape Pomace Extraction Media: Effect of Temperature and Composition. Journal of Food Engineering 2017, 197, 98–106.