
ABSTRACT
This work aimed to determinate eight beer properties using UV-Vis spectra in combination with principal component regression (PCR) or artificial neural network (ANN) models. A statistical experimental design was performed to generate the calibration data. First, principal component analysis (PCA) was applied to the original spectral data, and the scores in significant PCs were utilized to calibrate both models. PCR showed poor correlation for beer parameters (R2 < 0.61). The ANNs showed satisfactory correlations (R2 = 0.74–0.92) and low relative error considering a variable range (< 9%) for most of the beer-quality attributes, but vicinal diketones (R2 = 0.56,
= 16.69%). Once implemented, this method would be fast and low cost.
Introduction
Beer is one of the alcoholic beverages that has shown the most substantial expansion regarding historical production, consumption, and diffusion. In 2013, the global consumption of beer reached around 1,728 × 106 hl.[Citation1] Beer also has the largest share of alcoholic beverage market worldwide – USD 137,458 million in 2015.[Citation2] On the other hand, beer presents more versatile and flexible characteristics than other alcoholic beverages because of the availability and diversity of ingredients that can be used in the brewing processes according to the specific national regulations.[Citation1]
In some countries, like Germany, where legislation is rigorous, bottom-fermented beers can only be manufactured from malted barley, yeast, hops, and water.[Citation3] In other countries, like United States of America and Brazil, the beer definition by law is springier.[Citation4,Citation5] Specifically, Brazilian legislation establishes for a fermented alcoholic beverage to be classified as a beer, a minimum percentage of malted barley in the original extract equal to 50% (w/w). The remaining half of this mixture can be substituted by other cereals, malted or not (wheat, rye, maize, rice, oats, and sorghum – using whole grain, flakes, or their starchy part), and alternative sugar sources from plant origin.[Citation5,Citation6]
Beer production requires few raw materials and many elementary processing techniques.[Citation7] Despite several variations of the beer-manufacturing process, industrial production almost invariably follows a basic flow chart.[Citation8] The beer quality and type are ultimately influenced by the proportions, types, and quality of the ingredients in the original extract, water quality, as well as the yeast strain, and the chosen values of process variables over the course of the brewing process.[Citation9,Citation10]
Among the most frequent parameters of analysis to characterize beers are specific gravity, apparent extract, real extract, alcohol content, carbohydrates, original gravity, the real degree of fermentation, calories, pH, colour, bitterness, vicinal diketones, sodium, dimethyl sulphide, sulphur dioxide, haze, foam characteristics, and total acidity (TA).[Citation9,Citation11] Therefore, the detailed beer characterization is costly and time-consuming. Moreover, these quality attributes of beers are related to the occurrence of specific molecule families in the beverage.[Citation12]
In general, several spectroscopic techniques have been used to monitor the critical parameters during bioprocessing as well as the quality attributes of the final derived products.[Citation13] Among the spectroscopy types with successful applications in bioprocess monitoring are ultraviolet-visible (UV-Vis), near-infrared (NIR), mid-infrared (MIR), and fluorescence spectroscopy.[Citation13] However, specifically in the monitoring of the brewing process and beer characterization, the utilization of spectroscopic methods has been confined almost totally to vibrational spectroscopies, such as NIR, MIR, and Raman spectroscopy.[Citation14] Generally, applications of UV-Vis spectroscopy are not as widespread as vibrational techniques in the monitoring of bioprocesses and bio-products, because of the poor information of the corresponding spectra (absorption spectra with broader bands). Nevertheless, the use of chemometric techniques has revealed that these spectra comprise information that can be extracted and used for the quality monitoring of foods and bioprocesses, in general, as well as specifically, in beer classification.[Citation13,Citation15,Citation16]
Multivariate tools of data analysis for linear relationships (principal component analysis (PCA), principal component regression (PCR), partial least squares (PLS)) and artificial intelligence approaches (artificial neural networks (ANNs)) are the chemometric techniques that have been more extensively used to correlate spectral data with critical parameters in bioprocessing and quality attributes in the final bio-products, including beer.[Citation17,Citation18] ANNs for these purposes have shown an improved or similar prediction capacity with respect to multivariate methodologies. This fact is because of their flexibility to fit the often nonlinear relationships between the input and output variables in biological processes or systems.[Citation19] Thus, this work aimed to establish a methodology to determine simultaneously several beer-quality attributes based on UV-Vis spectral data from diluted beer samples in conjunction with PCRs or ANNs.
Materials and methods
Raw materials and yeast strain
All ingredients of the original extract and hops were food-grade reagents. The water utilized in the formulation of beer throughout the process was from a local artesian well (Universidade Estadual Paulista-UNESP/Assis-SP, Brazil). The strain of lyophilized Saccharomyces cerevisiae Safbrew WB-06 (Fermentis, Marcq-en-Baroeul, France) was utilized in the fermentation stage.
Brewing process at the bench scale
To brew beer at the bench scale, a basic receipt for an Ale-type beer was prepared. The original extract contained three ingredients: malted barley (Pilsen malt, Agrária, Brazil), malted wheat (light wheat malt, Weyermann, Germany), and high-maltose corn powder (Cargill, Brazil); their proportions were defined according to an experimental design (see Experimental Design section). The malted barley and wheat were previously ground in a roller mill with separation between the rollers of 1.5 mm. Then, the original extract was formulated, and its total mass was 160 g for all produced beers.
The original extract was mixed with 500 mL of water at 45°C for 5 min to begin the enzymatic activation ramp. Immediately, the temperature was raised to 52°C for a time specified in correspondence with the experimental design (see Experimental Design section). After that, the mixture was made to undergo two additional temperature rises to 68 and 78°C for 60 and 15 min, respectively. At the end of this temperature ramp, the wort was filtered. The filtration cake was washed with 600 mL of water at 78°C. Then, the filtrate was boiled for 60 min and simultaneously 1.5 g of Hallertauer Perle hops (Hopsteiner, Germany) were added. At the end of boiling and hop addition stage, sterilized water was used to complete 800 mL. The wort was cooled to 25°C for initiating the fermentation stage. A total of 40 mL of yeast previously rehydrated at 1.6 × 10⁸ cell/mL cell concentration was utilized as the inoculum for brewer’s wort. The fermentation was performed at 23°C for 120 h. Finally, the beer was conditioned at 3°C for 3 days before bottling. The beers were also stored at 3°C for 24 h until characterization.
Experimental design
To establish a comprehensive model to determinate simultaneously several beer’s quality attributes from the UV-Vis spectra, a set of 31 beers was produced and characterized according to a D-optimal crossed experimental design (experimental design including mixture and process variables) in Design-Expert software (Trial version 9.0.4.1, Stat-Ease, Minneapolis). The mixture variables were the mass percentages of malted barley (55–100% w/w), malted wheat (0–45% w/w), and high-maltose corn powder (0–45% w/w) in the original extract. The process variable under study was the reaction time (5–25 min) for proteases at 52°C. The number of experimental combinations (31 runs) was sufficient to fit a special cubic model for mixture variables and a quadratic model for the process variable (online supplementary information (SI)).
Beer characterization
Sample preparation
All beer samples (700 mL) were degassed before performing the following methods of analysis to characterize beers produced at the bench scale. The sample degassing was performed by vigorous stirring using a glass rod for 10 min at 20°C. The total protein concentration (mg/L) in beer samples was determined by Bradford’s technique.[Citation20] Foam stability was determined by Rudin’s method,[Citation21] just changing carbon dioxide, the bubbling gas, and by nitrogen (3 L/min). This parameter was defined as the time (seconds) after bubbling stops taken for the boundary between the liquid and the foam to displace from 5 cm to 7.5 cm at the bottom of Rudin’s cylinder. Haze was measured by the nephelometric method using a portable turbidimeter (Microprocessor Turbidimeter Plus II, Alfakit, Florianópolis, Brazil). Haze was expressed in nephelometric turbidity units (NTU).
Vicinal diketones
The official spectrophotometric method defined by European Brewing Convention (EBC) was used to quantify vicinal diketones (mg/L) in beer samples.[Citation22]
Colour
The filtered and degassed beer sample was initially diluted 4-fold in deionized water. The colour in EBC units was determined taking into account the diluted sample absorbance () at 430 nm and dilution factor (
), according to Eq. (1).[Citation11]
Total acidity
In a 250 mL Erlenmeyer flask, 50 mL of degassed beer sample was titrated with 0.1 N NaOH solution in the presence of indicator phenolphthalein. The TA was expressed in terms of mEq/L and calculated as detailed in Eq. (2).[Citation23]
where is the volume in mL of 0.1 N NaOH solution spent in titration of 50 mL of the sample (
).
is the normality (0.1) of the NaOH solution.
Alcohol content
A total of 100 mL of degassed beer was distilled. The condensed vapour was collected in a 100 mL volumetric flask with 10 mL of deionized water. Subsequently, the volumetric flask was completed with deionized water and homogenized. Finally, the density of the hydroalcoholic solution was determined at 20°C by pycnometry and correlated to its alcohol content (% v/v).[Citation23]
Bitterness
The determination of bitterness was carried out according to the accepted methodology by the European Brewery Convention (E.B.C.).[Citation11,Citation24] The values were expressed in E.B.C. units (EBU).
UV-Vis spectra acquisition
The beer samples were diluted 40-fold in deionized water (this dilution factor was previously set based on the potential of the primary spectral data for showing differences among the samples and the relatively low values of absorbance over the course of the spectrum, data not shown). The diluted sample was scanned once using the acquisition method of transmittance from 200 to 1000 nm (spectrophotometer UV-M51, Bel Photonics, Piracicaba, Brazil), at intervals of 1.0 nm, using quartz cuvettes of 1 cm path length. Deionized water was used as the blank. The collected absorbance data were exported to software Microsoft Office Excel 2016 (Microsoft Corporation, Redmond, USA) for graphing, and subsequent PCA and ANN modelling.
Principal component analysis
PCA was performed to reduce the descriptor variables of the input data set for ANN (number of neurons in the input layer, equal to sample absorbances at different wavelengths), using sample scores in each principal component as a new data set. The number of significant components in PCA was determined by Eastment and Krzanowski’s cross-validation approach[Citation25] in SIMCA 14 demonstration version software (Umetrics, Umeå, Sweden). The cumulative coefficient of determination (R2) was utilized as an index for defining how effectively the significant principal components explain the variance of the original data.
The PCA was applied to the original spectral data set to make compatible the size of the calibration data set to the number of parameters and weights to be adjusted in the PCR and ANN models, respectively. The PCA is a multivariate technique that aims mainly to detect collinearity and to define the number of principal causes of variability in the original two-dimensional data set; as a consequence, the number of descriptor variables could be reduced.[Citation26]
Calibration of the PCR models
The PCR models (Eq. 3) for predicting each beer-quality attribute () were calibrated using the scores of 31 samples collected experimentally in the significant components (
) and their corresponding experimental values for each beer-quality parameter.
where and
represent the independent and partial regression coefficients of n significant components, respectively. All samples were used for the calibration of the PCR models, and no validation stage was performed. The statistical significance of the partial regression coefficients of the PCR models was assessed by Student’s t-test with a significance level of 0.05.
Calibration of the ANN models
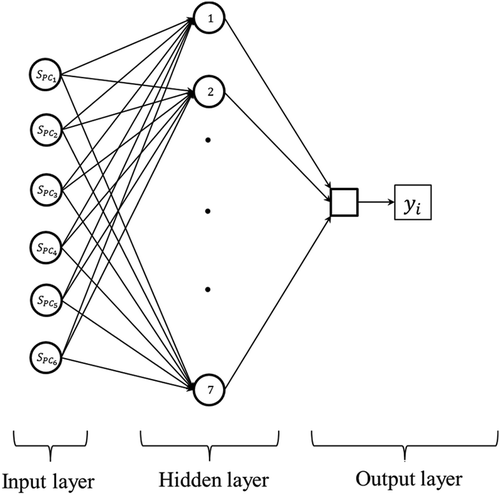
A two-layer feed-forward neural network with sigmoid hidden neurons and linear output neurons for modelling each beer-quality attributes was used. The input data for ANNs were the sample scores in significant principal components derived from PCA of the original UV-Vis spectral data (input data) and their associated beer-quality attributes determined by conventional methodologies (output data). The Levenberg–Marquardt back-propagation algorithm was employed for ANN training.[Citation27] The neural network modelling was performed in the Neural Network Fitting Tool (MATLAB R2012a, Mathworks, Natick, USA). The number of neurons in the hidden layer was studied from 1 to 7 for determining the ANN architecture with the best prediction capacity (). The maximum number of neurons in the hidden layer was defined according to Hecht–Nielsen’s rule (number of input neurons +1).[Citation28] The data for ANN calibration were divided randomly into training, validation, and testing sets, each set containing 70%, 15%, and 15% of the whole data, respectively. The ANNs were trained, and its architecture optimized using the mean squared error (MSE) as the performance index (Eq. 4).
Figure 1. ANN architecture and information pathway. ; 1,2,…,7 and
represent scores in the principal component (
) after PCA of spectral data; the number of neurons in the hidden layer and one of the monitored quality attributes of beer, respectively.
where n is the number of samples taking into account 21 or 31 for the training and architecture optimization stages, respectively. The and
are the predicted and corresponding observed value of beer-quality attribute for each considered sample (experimental run), respectively.
Statistical parameters
Means of absolute error () assessed the accuracy of the models for the simultaneous determination of beer-quality attributes in each sample and the relative error considering the parameter range (
). Both indexes are defined mathematically in Eqs. (5) and (6).
where is the value of quality attribute by the standard method,
is the value of quality attribute predicted by the ANN model,
is the maximum value of quality attribute by the standard method, and
is the minimum value of the quality attribute by the standard method. Average and standard deviations of
and
were calculated for each beer-quality attribute taking into account the 31 beer samples. Determination coefficient (R2) was also utilized for assessing the model accuracies.
The comparison of the prediction absolute errors between the PCR and ANN models for each beer-quality parameter was performed by means of one-tailed Student’s t-test, using the software Statgraphics Plus 5.0 (Statistical Graphics Corp., Fairfax, VA, USA) and the alternative hypothesis was absolute errors from the PCR models are higher than those from the ANN models.
Results and discussion
Beer characterization
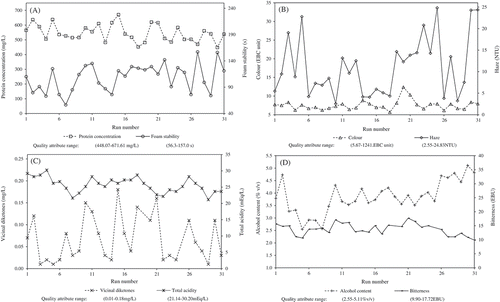
The ranges of quality attributes for the beer samples () were typical for Ale-type beers.[Citation9] Besides, the ranges for all beer-quality parameters were broad enough to ensure a calibration of the PCR and ANN models. The variability of quality attributes in the primary data set was a consequence of changes in the beer ingredients and protease reaction time (SI, ).
Figure 2. Beer-quality attributes associated with runs included in the crossed experimental design (SI). A: Values of protein concentration and foam stability. B: Values of colour and haze. C: Values of vicinal diketones and total acidity. D: Values of alcohol content and bitterness.
UV-Vis absorption spectra of beer samples
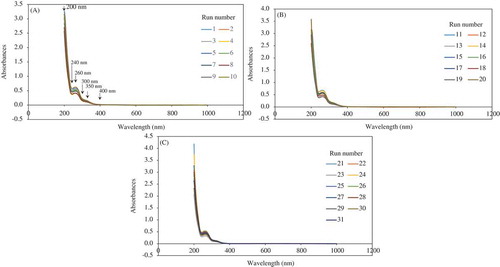
The UV-Vis spectra of all diluted samples showed a similar pattern of shape (). Six wavelengths in the UV range were significant to explain the spectral variability; they are 200 nm (maximum absorbance), 240 nm (valley), 260 nm (peak), 300 nm (inflection point), 350 nm (inflection point), and around 400 nm (beginning of a plateau region) ().
Figure 3. UV-Vis spectral data associated with diluted beer samples (40-fold) derived from crossed experimental design (SI). A: Samples 1–10 corresponding to run order in the crossed experimental design. B: Samples 11–20 corresponding to run order in the crossed experimental design. C: Samples 21–31 corresponding to run order in the crossed experimental design.
The present work was motivated by the efficient use of beer UV-Vis spectra to quantify simultaneously the quality attributes of this beverage. The chemical compounds such as proteins, polyphenols, ethanol, acetic acid, vicinal or α-diketones, and iso-α-acids, which are related to the quality parameters under consideration, have characteristic UV-Vis spectra.
In details, proteins or proteinaceous materials (beer contains ~ 500 mg/L,[Citation29] ) absorb light in the ‘far-UV’ range (180–230 nm) due to light absorption associated with the peptides groups of the protein main chain. Likewise, the aromatic side-chains of tyrosine, tryptophan, and phenylalanine absorb in this wavelength range. Moreover, aromatic amino acids also absorb in the ‘near-UV’ region (240–300 nm) as well as disulphide bonds that form between two cysteines.[Citation30] The extrinsic chromophores in proteins, such as saccharide–protein bonds, as well as protein aggregates, which have an influence on turbidity, have absorption bands above 300 nm until 400 nm.[Citation31] Proteins in beer are related mainly to colour, flavour, haze formation, and foam stability.[Citation12]
On the other hand, polyphenols (compounds with antioxidant activity), whose concentrations in beers range from 150 to 330 mg/L,[Citation32,Citation33] have an influence on colour (because of their oxidation in the presence of trace metals) and non-biological haze (interaction with proteins).[Citation9] These phenolic compounds have significant absorption spectra in the UV-Vis region of the electromagnetic spectrum.[Citation34]
Another important compound in beer chemical composition is ethanol; the concentrations in the samples derived from the experimental work () were 2.55–5.11% v/v (~32.32–64.77 × 10³ mg/L). This volatile compound shows a UV spectrum from 200 to 300 nm[Citation35] and it can cause displacement of the UV-Vis absorption spectra related to other solutes of the mixture due to change in solvent polarity,[Citation36] but this phenomenon should not influence the original spectral data because of the sample dilution factor (40-fold).
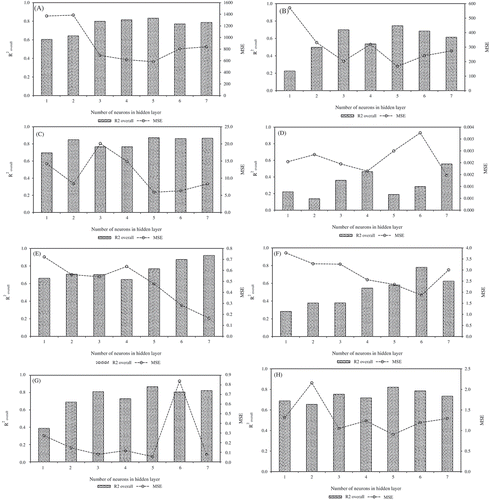
Figure 4. Effect of neuron number in the hidden layer of the calibrated ANNs on MSE and the overall determination coefficient calculated for the observed and predicted values of beer-quality attributes. A: Protein concentration. B: Foam stability. C: Haze. D: Vicinal diketones. E: Colour. F: Total acidity. G: Alcohol content. H: Bitterness.
Acetic acid has a typical concentration in beers (57–145 mg/L), and its aqueous solutions have a characteristic UV-spectrum from 180 to 260 nm.[Citation37] This is the major volatile acid in beer. Thus, this compound has an impact on beer TA. In addition, the vicinal diketones, diacetyl (2,3-butanedione) and 2,3-pentanedione, are responsible for the butterscotch-like flavour, their concentration in ale beers is in the 0.1–0.4 mg/L range,[Citation38] and they also show absorption in the UV-Vis region.[Citation39,Citation40] The concentrations in the present work for these compounds were within this typical range (0.01–0.18 mg/L) (). Finally, iso-α-acids are directly correlated with beer bitterness and also have significant UV spectra; they occur in beer in concentrations varying between 15 and 100 mg/L.[Citation41] Thus, the use of chemometric techniques like PCR and ANN was assessed to find suitable correlations between the beer UV-Vis spectrum and its corresponding quality attributes.
Principal component analysis
Six significant components explained the variability of the original spectral data in 99.4% (cumulative coefficient of determination, R2=0.994, the fraction of the variance in original data that is explained by the significant principal components), which comprised 801 descriptor variables (absorbance values related to 801 wavelengths, 200–1000 nm). The number of significant principal components (the Ri2 values associated with each principal component were R12 = 0.680; R22 = 0.197, R32 = 0.073; R42 = 0.040; R52 = 0.002; R62 = 0.002) matched with the number of UV wavelengths, which best characterized the spectra of the beer samples (). This means that the UV-Vis spectra could be expressed properly with six latent variables and a significant correlation among absorbances at different wavelengths was confirmed (the whole UV-Vis spectra can be described using the six wavelengths related to characteristic points because the remaining absorbance values could be estimated by linear combinations of the absorbance values at these points). As a consequence of PCA, a spectrum of diluted beer sample was reduced to six input parameters, the sample scores in significant principal components (SI). These six parameters were utilized as input data to define the PCR and ANN models.
PCR models
PCR models were used to predict the beer-quality attributes. The PCR models showed poor multiple linear correlations between the sample scores in principal components derived from the PCA of the original spectral data and the beer-quality attributes. The R2 values were lower than 0.61 for all quality parameters. Besides, the linear models were not significant statistically for foam stability, vicinal diketones, and TA (). The worst PCR model was associated with vicinal diketones (R2 = 0.20 and p-value = 0.501). The quality attributes with significant PCR models (p-value < 0.05) showed different statistical relations regarding the six scores of PCA analysis, even those with certain biochemical dependence like protein concentration and haze. This was confirmed based on the statistical significance of the partial regression coefficients of the PCR models ().
Table 1. PCR modelling of the beer-quality attributes.
Colour was the only quality parameter whose relative error associated with the PCR model was lower than 10%; the remaining parameter models showed relative errors higher than 13%. The poor quality of PCR models suggests strongly nonlinear correlations among the beer-quality attributes under consideration. Specifically, foam stability and vicinal diketones were not influenced by the scores in six principal components .
ANN models
The number of neurons in the hidden layer for optimal ANN architectures (minimum MSE) to predict each beer-quality attribute was not the same. However, five neurons in the hidden layer were the most frequent in the optimal ANN architectures; five quality parameters were modelled using this ANN configuration (protein concentration, foam stability, haze, alcohol content, and bitterness). The remaining ANN optimal architectures showed a higher number of neurons in the hidden layer (, ). The optimized ANN models for all quality attributes showed better correlation coefficients between the predicted and actual values than those equivalent from the PCR models (, , SI). The lowest ANN correlation coefficient was observed for vicinal diketones (r = 0.75) (, SI).
Table 2. ANN modelling of beer-quality attributes for the best ANN topologies.
The absolute errors from the ANN models were significantly lower than those from the PCR models. This was demonstrated statistically (). Besides, the relative errors, which consider the range of actual values for each variable, were lower than 10% for the seven quality attributes. The ANN model for vicinal diketones showed the highest relative error (16.69%) ().
Comparison between the PCR and ANN models
The relatively poor linearity of the PCR models was demonstrated through the overall correlation coefficients associated with these models; they were inferior to the corresponding one in the ANN models, even using all data sets for model calibrations. The existence of some nonlinearity in the spectral data–beer-quality attribute relationships was confirmed previously by NIR spectroscopy.[Citation17]
The highest errors associated with vicinal diketones in both modelling approaches could be explained by the relatively low concentrations of these compounds in beers. The optimization of sample dilution is recommended to overcome this limitation. Then, a potential solution for this drawback would be to optimize the beer sample dilution before acquiring the UV-Vis spectrum or use several sample dilutions to also catch the spectral signal from these minor compounds. Conversely, quality attributes, which depend on chemical compounds with a relatively high concentration (ethanol, protein, and polyphenols) in beer, such as alcohol content, colour, and foam stability, showed the lowest prediction errors (4.15–5.76% relative errors). The optimized ANN model for haze had slightly larger errors (8.21% relative error), in spite of depending mainly on protein–polyphenol interactions. This is likely caused by the occurrence of less-frequent haze sources such as retrograded starch (α-glucan), β-glucans, and pentosans,[Citation9] which have no significant UV-Vis absorption.
The ANN architectures for each beer-quality parameter were optimized because the architecture significantly influences the fit quality of this kind of model. As a rule, one hidden layer is sufficient for suitable correlation with the empirical data. Thus, the number of neurons in the only hidden layer was the single parameter of the architecture considered. The difference of the optimal number of neurons in the hidden layer, among the eight parameters under study, is caused by the difference in the data set structure for each variable.[Citation42]
Most of the ANN models based on UV-Vis spectra of diluted beers showed similar prediction capacity to those corresponding to previous works, which used mid- and near-spectroscopy (R2 = 0.62–0.98).[Citation17,Citation43] Besides, the present artificial intelligence methodology meets the tolerance levels for colour (1 EBC) and alcohol content (0.5% v/v), the two main parameters that are regulated for beer commercialization in Southern Common Market.[Citation44] Thus, the utilization of UV-Vis spectra from diluted beer samples is suggested in combination with ANNs for the simultaneous determination of beer-quality parameters considered in the present work, except for vicinal diketones. Thus, the proposed approach is suitable for developing a chemical sensor applied to beer monitoring. Even though implementing the chemosensor might be costly at first, the economy generated in the characterization process is likely to quickly recover the investment cost, especially considering the high number of analysis usually performed in industrial breweries daily. Besides, the labour expenses would decrease to around 1/7, because only one assay substitutes seven assays. The use of chemical reagents in some assays (TA, bitterness) and electric power will be almost totally abolished, thus making the present approach environmentally friendly.
Conclusion
A chemometric method based on ANN to determine protein concentration, foam stability, haze, colour, TA, alcohol content, and bitterness in Ale beers using UV-Vis spectra of diluted samples was established. The PCR models did not show acceptable correlations. The ANN approach had proper accuracy; once implemented, it would be fast, environmentally friendly, and low cost. The application of the proposed methodology for other beer types is possible, as long as the suitable data set is collected to calibrate the ANN models adequately. The vicinal diketones were not possible to quantify using the present artificial intelligence approach, and the optimization of sample dilution is recommended to overcome this limitation.
Declaration of interest
The authors declare no conflict of interest.
LJFP_A_1352602_Supplementary_file_3.docx
Download MS Word (69.3 KB)LJFP_A_1352602_Supplementary_file_2.docx
Download MS Word (27.8 KB)LJFP_A_1352602_Supplementary_file_1.docx
Download MS Word (26.2 KB)Supplemental data
Supplemental data for this article can be accessed on the publisher’s website.
Additional information
Funding
Related Research Data
References
- Cabras, I.; Higgins, D.; Preece, D. Introduction and Overview. In Brewing, Beer and Pubs: A Global Perspective; Cabras, I.; Higgins, D., Preece, D., Eds.; Palgrave Macmillan: New York, 2016; 1–14.
- Bong, Y.S.; Ryu, J.S.; Choi, S.H.; La, M.R.; Lee, K.S. Investigation of the Geographical Provenance of the Beer Available in South Korea Using Multielements and Isotopes. Food Control 2016, 60, 378–381.
- Boulton, C. Encyclopaedia of Brewing; Wiley-Blackwell: Hoboken, USA, 2013; 716 pp.
- Stinehour, Z. An American Beer Trail. Outskirts Press: Denver, USA, 2016; 148 pp.
- Mardegan, S.F.; Andrade, T.M.B; de Sousa Neto, E.R.; de Castro Vasconcellos, E.B; Borges Martin, L.F.; Martinelli, A. Stable Carbon Isotopic Composition of Brazilian Beers-A Comparison between Large- and Small-scale Breweries. Journal of Food Composition and Analysis 2013, 29, 52–57.
- Federative Republic of Brazil. Presidência da República. Casa Civil. Subchefia Para Assuntos Jurídicos. DECRETO No 2.314, 4 SETEMBRO 1997. 1997 [cited 2016 Jun 6]. Available from: https://www.planalto.gov.br/ccivil_03/decreto/D2314impressao.htm.
- Rodman, A.D.; Gerogiorgis, D.I. Multi-objective Process Optimisation of Beer Fermentation via Dynamic Simulation. Food and Bioproducts Processing 2016, 100, 255–274.
- O’Keefe, S.F. Beverage: Alcoholic, Beer Making. In Food Processing: Principles and Applications; Smith, J.S.; Hui, Y.H., Eds.; Blackwell Publishing: Ames, 2004; 225–238.
- Briggs, D.E.; Boulton, C.A.; Brookes, P.A.; Stevens, R. Brewing: Science and Practice; CRC Press: Boca Raton, USA, 2004; 900 pp.
- He, Y.; Dong, J.; Yin, H.; Zhao, Y.; Chen, R.; Wan, X.; Chen, P.; Hou, X.; Liu, J.; Chen, L. Wort Composition and Its Impact on the Flavour-active Higher Alcohol and Ester Formation of Beer: A Review. Journal of Institute of Brewing 2014, 120, 157–163.
- Popescu, V.; Soceanu, A.; Dobrinas, S.; Stanciu, G. A Study of Beer Bitterness Loss during the Various Stages of the Romanian Beer Production Process. Journal of Institute of Brewing 2013, 119, 111–115.
- Colgrave, M.L.; Goswami, H.; Howitt, C.A.; et al. Proteomics as a Tool to Understand the Complexity of Beer. Food Research International 2013, 54, 1001–1012.
- Lourenço, N.D.; Lopes, J.A.; Almeida, C.F.; Sarraguça, M.C.; Pinheiro, H.M. Bioreactor Monitoring with Spectroscopy and Chemometrics: A Review. Analytical and Bioanalytical Chemistry 2012, 404, 1211–1237.
- Garrigues, S.; de la Guardia, M. Methods for the Vibrational Spectroscopy Analysis of Beers. In Beer in Health and Disease Prevention; Preedy, V.R., Ed.; Academic Press: San Diego, 2009; 943–962.
- Biancolillo, A.; Bucci, R.; Magri, A.L.; Magri, A.D.; Marini, F. Data-fusion for Multiplatform Characterization of an Italian Craft Beer Aimed at Its Authentication. Analytica Chimica Acta 2014, 820, 23–31.
- Suhandy, D.; Yulia, M. Peaberry Coffee Discrimination Using UV-visible Spectroscopy Combined with SIMCA and PLS-DA. International Journal of Food Properties 2017, doi: 10.1080/10942912.2017.1296861.
- Iñón, F.A.; Garrigues, S.; de la Guardia, M. Combination of Mid- and Near-infrared Spectroscopy for the Determination of the Quality Properties of Beers. Analytica Chimica Acta 2006, 571, 167–174.
- Giovenzana, V.; Beghi, R.; Guidetti, R. Rapid Evaluation of Craft Beer Quality during Fermentation Process by Vis/NIR Spectroscopy. Journal of Food Engineering 2014, 142, 80–86.
- Luttmann, R.; Bracewell, D.G.; Cornelissen, G.; Gernaey, K.V.; Glassey, J.; Hass, V.C.; Kaiser, C; Preusse, C.; Striedner, G.; Mandenius, C.F. Soft Sensors in Bioprocessing: A Status Report and Recommendations. Biotechnology Journal 2012, 7, 1040–1048.
- Bradford, M.M. A Rapid and Sensitive Method for the Quantitation of Microgram Quantities of Protein Utilizing the Principle of Protein-dye Binding. Analytical Biochemistry 1976, 72, 248–254.
- Rudin, A. Measurement of the foam Stability of Beers. Journal of Institute of Brewing 1957, 63, 506–509.
- Rodrigues, J.A.; Barros, A.A.; Machado Cruz, J.M.; Ferreira, A.A. Determination of Diacetyl in Beer Using Differential-pulse Polarography. Journal of Institute of Brewing 1997, 103, 311–314.
- Zenebon, O.; Pascuet, N.S.; Tiglea, P. Métodos Físico-químicos Para Análise de Alimentos. São Paulo (online version): Instituto Adolfo Lutz; 2008. Available from: http://www.crq4.org.br/sms/files/file/analisedealimentosial_2008.pdf.
- Howard, G.A. Estimation of the Bitterness of Beer. Journal of Institute of Brewing 1968, 74, 249–251.
- Eastment, H.T.; Krzanowski, W.J. Cross-validatory Choice of the Number of Components From a Principal Component Analysis. Technometrics 1982, 24, 73–77.
- Abdi, H.; Williams, L.J. Principal Component Analysis. Wiley Interdisciplinary Reviews: Computational Statistics 2010, 2, 433–459.
- Yu, H.; Wilamowski, B.M. Levenberg–Marquardt Training. In Industrial Electronics Handbook, 2nd edn.; Wilamowski, B.M.; Irwin, J.D., Eds.; CRC Press: Boca Raton, 2011; 12-1–12-16.
- Basheer, I.A., Hajmeer, M. Artificial Neural Networks: Fundamentals, Computing, Design, and Application. Journal of Microbiological Methods 2000, 43, 3–31.
- Steiner, E.; Gastl, M.; Becker, T. Protein Changes during Malting and Brewing with Focus on Haze and Foam Formation: A Review. European Food Research and Technology 2011, 232, 191–204.
- Schmid, F. Biological Macromolecules : UV-visible Spectrophotometry. eLS. John Wiley & Sons, 2001; 4 pp. doi: 10.1038/npg.els.0003142
- Mach, H.; Middaugh, C.R. Ultraviolet Spectroscopy as a Tool in Therapeutic Protein Development. Journal of Pharmaceutical Sciences 2011, 100, 1214–1227.
- Li, H.J.; Deinzer, M.L. Beer in Health and Disease Prevention. In Beer in Health and Disease Prevention; Preedy, V.R., Ed.; Academic Press: San Diego, 2009; 333–348.
- Socha, R.; Pajᶏk, P.; Fortuna, T.; Buksa, K. Antioxidant Activity and the Most Abundant Phenolics in Commercial Dark Beers. International Journal of Food Properties 2017, doi: 10.1080/10942912.2017.1306550.
- Anouar, E.H.; Gierschner, J.; Duroux, J.L.; Trouillas, P. UV/Visible Spectra of Natural Polyphenols: A Time-dependent Density Functional Theory Study. Food Chemistry 2012, 131, 79–89.
- Martelo-Vidal, M.J.; Vázquez, M. Evaluation of Ultraviolet, Visible, and Near-infrared Spectroscopy for the Analysis of Wine Compounds 2014, 32, 37–47.
- Faust, B. Modern Chemical Techniques: An Essential Reference for Students and Teachers; The Royal Society of Chemistry: London, UK, 1997; 200 pp.
- Ruderman, G.; Caffarena, E.; Mogilner, I.; Tolosa, E.J. Hydrogen Bonding of Carboxylic Acids in Aqueous Solutions—UV Spectroscopy, Viscosity, and Molecular Simulation of Acetic Acid. Journal of Solution Chemistry 1998, 27, 935–948.
- Krogerus, K.; Gibson, B.R. 125th Anniversary Review: Diacetyl and Its Control during Brewery Fermentation. Journal of Institute of Brewing 2013, 119, 86–97.
- National Institute of Standards and Technology. 2,3-Butanedione. 2016 [cited 2016 Jun 26]. Available from: http://webbook.nist.gov/cgi/cbook.cgi?ID=C625343&Mask=400.
- National Institute of Standards and Technology. 2,3-Pentanedione. 2016 [cited 2016 Jun 26]. Available from: http://webbook.nist.gov/cgi/cbook.cgi?ID=C600146&Mask=400.
- Caballero, I.; Blanco, C.A.; Porras, M. Iso-α-acids, Bitterness and Loss of Beer Quality during Storage. Trends in Food Science & Technology 2012, 26, 21–30.
- Bose, B.K. Power Electronics And Motor Drives. Academic Press: San Diego, USA, 2006; 936 pp.
- Lachenmeier, D.W. Rapid Quality Control of Spirit Drinks and Beer Using Multivariate Data Analysis of Fourier Transform Infrared Spectra. Food Chemistry 2007, 101, 825–832.
- MERCOSUL; 2001 Regulamento técnico Mercosul de produtos de cervejaria. Available at:http://www.mercosur.int/msweb/portal%20intermediario/Normas/normas_web/Resoluciones/PT/Res_014_001_RTM%20Prod%20Cervejaria_Ata%202_01.PDF. Accessed 17.12.2016.