
ABSTRACT
In this work, phenolic composition, antioxidant and antibacterial activities of selected Tunisian barley varieties were studied. Swihli barley exhibited the highest total phenolic content and the strongest antioxidant and antibacterial activities. Liquid chromatography/mass spectrometry analysis revealed significant qualitative and quantitative differences in phenolic composition among the different varieties. Procyanidin B3 and catechin were the most abundant. Pearson’s correlation test revealed significant correlations between the antioxidant activities of barley extracts and both hydroferuloyl glucose and catechin-3-glucose.
Introduction
Scientific interest for natural, functional, and healthy foods is continuously rising. Several reports have reinforced the case for whole grains as health-promoting components in the diet.[Citation1–Citation3] Recently, barley (Hordeum vulgare L.) has gained renewed interest as an ingredient for the production of functional foods and beverages.[Citation4–Citation6] Barley is a widely consumed cereal over the world, mainly as animal feed and malt, which is a raw material for the beer and spirit industry.[Citation3,Citation4,Citation7] Both barley grain and malt contain high levels of antioxidative phenolic compounds.[Citation2–Citation4,Citation8] Gupta et al.[Citation9] reported that about 80% of phenolic compounds of beer are derived from barley malt and the remaining come from hop, indicating the importance of these compounds during mashing and brewing. Phenolics play an important role in controlling oxidative reactions and extending the shelf life of beer by acting as free radical scavengers, reducing agents, and metal ion chelators.[Citation4,Citation7,Citation10] Phenolic compounds in barley are differentially accumulated between the different seed tissues and can be found in both soluble free or insoluble bound forms.[Citation11–Citation13] These phenolics include benzoic and cinnamic acid derivatives, flavanones, flavonols, flavones, proanthocyanidins, phenolic amino compounds, and quinines.[Citation4] Benzoic and cinnamic derivatives, flavonols, chalcones, and flavones were found in both their free and bound forms.[Citation3,Citation14] The major free phenolic compounds include procyanidins and flavonoids, while the major bound ones encompass hydroxycinnamic acid derivatives such as caffeic, p-coumaric, and ferulic acids which link to cell wall by an ester bond.[Citation11] Insoluble bound phenolic acids can be released by acid or alkali hydrolysis.[Citation3] However, during brewing, water is used as the extract solvent so that only soluble-free phenolic compounds are present in malt extract.[Citation10,Citation13,Citation15] Therefore, it is meaningful to investigate the fate of free phenolic acids during malting and brewing.[Citation13] The most commonly found phenolics in beer originate from malt include catechin, epicatechin, ferulic acid, p-coumaric acid, and vanillic acid (VA).[Citation16] Antioxidants play an important role during malting and brewing due to their ability to delay or prevent oxidation reactions. Flavour stability is not only an important quality attribute of beer, but also the most important factor in determining the shelf life of packaged beer. Antioxidants like sulphites, formaldehyde, or ascorbate have been used into the brewing to maintain beer flavour stability.[Citation17] However, there is a doubt regarding the efficiency of some of these compounds.[Citation18] Also, because of consumer demand and stiffening regulations, there is an urgent need to reduce the use of synthetic additives in the brewing industry. Therefore, the presence of natural antioxidants in malting barley and screening for malting barley varieties with elevated levels of antioxidants is of great interest to produce beers with high levels of reactive oxygen scavengers.[Citation5,Citation6,Citation9,Citation13,Citation16] Several reports are available on the phenolic composition of barley varieties from different countries in the world,[Citation4,Citation11–Citation13] while there is not any scientific information on the phenolic composition of Tunisian barley varieties. Consequently, the purpose of this study is to determine genotypic differences among four Tunisian barely varieties (TBV) in in vitro antioxidant and antibacterial activities and phenolic composition based on high-performance liquid chromatography coupled to diode array detection and electrospray ionization tandem mass spectrometry (HPLC-DAD-ESI-MS) for the first time.
Materials and methods
Plant material
Seeds of four barley varieties from Tunisia (Swihli, Rihane, Faiz, and Manel) were sown under the same agronomic and environmental conditions in the field of the experimental farm at the Centre of Biotechnology of Sfax, an arid zone of southern Tunisia. The southern part of the country is known for its severe pedoclimatic conditions (shallow soils, high temperature, and low rainfall). The annual rainfall and temperature averages during the studied year 2015/2016 were 140 mm and 20−45°C, respectively. At maturity, barley grains were harvested and stored in a cool room at 4°C.
Extraction of phenolic compounds
Several methods of phenolic compounds extraction from barley seeds have been reported.[Citation6,Citation15,Citation18,Citation19] The alcoholic mixtures, such as ethanol/water and methanol/water, allowed higher extraction yields of free phenols, mainly in terms of total phenolic compounds.[Citation8,Citation11] Therefore, in this work, ethanol was used as solvent to extract free phenolics that will be largely present in the beer during the malting process.[Citation13] Barley seeds were rinsed with distilled water, freeze-dried, and ground in a Mettler AE 200 blender (Dangoumeautype). Thereafter, seed extracts were obtained by magnetic stirring of 2.5 g dry powder with 25 ml ethanol 50% (8) for 30 min and then kept for 24 h at 4°C, filtered through a Whatman no. 4 filter paper, and evaporated under vacuum to dryness. The obtained extracts were stored at 4°C until use in further experiments.
Determination of total phenolic content
Total phenolic content (TPC) in seed ethanolic extracts of various barley varieties was evaluated with the Folin–Ciocalteu reagent according to the procedure described by Dewanto et al.[Citation20] To 125 µl of each sample extract suitably diluted, 500 µl of Folin–Ciocalteu reagent and 125 µl of distilled water were added. The mixture was shaken, added with 1.25 ml of Na2CO3 (7%, w/v) and adjusted with distilled water to a final volume of 3 ml. After incubation for 90 min at 23°C in the dark, the absorbance versus prepared blank was recorded at 760 nm. TFC was expressed as milligram gallic acid equivalents per gram of dry weight (mg GAE g−1 DW) using a calibration curve with gallic acid (0–400 µg⋅ml−1).
Determination of antioxidant capacities
ABTS radical-scavenging activity (ABTS assay)
ABTS radical-scavenging activity was determined according to Re et al.[Citation21] The ABTS•+cation radical was produced by the reaction between 5 ml of 14 mM ABTS solution with 5 ml of 4.9 mM potassium persulfate (K2S2O8) solution and then shaken in the dark for 16 h. Before use, this solution was diluted with ethanol to obtain an absorbance of 0.7 ± 0.020 at 734 nm. The reaction mixture contains 950 μl of ABTS•+ solution and 50 μl of the seed extracts (or water for the control), which means a final volume of 1 ml. To determine the scavenging activity, the absorbance at 734 nm was measured 6 min after the initial mixing, using ethanol as the blank. The inhibition percentage of ABTS radical was calculated using the following Formula (1). The IC50 values were expressed as µg⋅ml−1.
where A0 is the absorbance of the control, and AS is the absorbance of the tested sample.
Ferric-reducing/antioxidant power (FRAP assay)
The iron-reducing power was determined based on the transformation of Fe3+ to Fe2+ induced by the different ethanolic extracts of barley seeds according to the method of Oyaizu.[Citation22] Sample solutions at different concentrations were mixed with 2.5 ml of 0.2 M phosphate buffer (pH 6.6) and 2.5 ml of potassium ferricyanide (1% w/v). The mixture was incubated at 50°C for 20 min. Afterwards, 2.5 ml of TCA (10%) were added and the mixture was centrifuged for 10 min at 1000×g. Supernatant (2.5 ml) was mixed with distilled water (2.5 ml) and 0.5 ml of ferric chloride (0.1% w/v), and the absorbance was measured at 700 nm. Higher absorbance values of the reaction mixture indicate a greater reducing power. IC50 value (µg⋅ml−1) is the effective concentration of the extract at which the absorbance was 0.5, and it was obtained from linear regression analysis.
β-Carotene bleaching test (β-carotene assay)
A slightly modified method previously described by Koleva et al.[Citation23] was employed to estimate the capacity of the seed ethanolic extracts to inhibit the β-carotene bleaching. Two milligrams of β-carotene were dissolved in 20 ml chloroform and to 4 ml of this solution, linoleic acid (40 mg) and Tween 40 (400 mg) were added. Chloroform was evaporated under vacuum at 40°C and 100 ml of oxygenated water was added, then the fresh emulsion was vigorously shaken. An aliquot (150 µl) of the β-carotene/linoleic acid emulsion was distributed in 96-well microtitre plates and methanolic solutions of the tested samples or authentic standards (10 µl) were added. The microtitre plates were incubated at 50°C for 120 min, and the absorbance was recorded using a model EAR 400 microtitre reader (Labsystems Multiskan MS) at 470 nm. Readings of all samples were performed immediately (t = 0 min) and after 120 min of incubation. The antioxidant activity of the extracts was evaluated in terms of bleaching inhibition of the β-carotene using Formula (2).
where C0 and C120 are the absorbance values of the control at 0 and 120 min, respectively, and S is the sample absorbance at 120 min. The results were expressed as IC50 values (μg⋅ml−1).
DPPH radical-scavenging activity (DPPH assay)
The DPPH assay, which has widespread use in free radical-scavenging assessment, is based on reaction between the free 1,1-diphenyl-2-picrylhydrazyl (DPPH) radical and molecules that can donate hydrogen atoms. The hydrogen atoms or electrons donation ability of the corresponding seed ethanolic extracts were measured from the bleaching of purple coloured methanol solution of DPPH according to the method described by Hanato et al.[Citation24] Also, 1 ml of various concentrations of the ethanolic extracts was added to 250 µl of 0.2 mM DPPH radical solution in methanol. The mixture was shaken vigorously and allowed standing for 30 min in the dark. The absorbance of the resulting solution was measured at 517 nm and butylatedhydroxytoluene was used as a positive control. Inhibition of DPPH radical was calculated using Formula (1). The antiradical activity was expressed as IC50 (µg⋅ml−1), the extract dose required to cause a decrease of the absorbance (517 nm) by 50%. A lower IC50 value corresponds to a higher antioxidant activity.
Superoxide anion radical-scavenging activity (superoxide assay)
Superoxide (O2) scavenging capacity was assessed according to Duh et al.[Citation25] The reaction mixture contained 0.2 ml of the ethanolic extracts of barley seeds at different concentrations, 0.2 ml of 60 mmol⋅l–1 PMS (Phenazine-Methosulphate), 0.2 ml of 677 mmol⋅l–1 NADH (Nicotinamide-Adenine-Dinucleotide), and 0.2 ml of 144 mmol⋅l–1 NBT (Nitroblue-Tetrazolium), all in phosphate buffer (0.1 mol l–1, pH 7.4). After 5 min of incubation at room temperature, the absorbance was recorded at 560 nm against blank. The inhibition percentage of O2 generation was determined using Formula (1). As for the antiradical activity, the antioxidant activity in the different ethanolic extracts of barley seeds was expressed on IC50. The IC50 values were expressed as µg⋅ml−1.
Evaluation of the antibacterial activity
Microorganisms
Antibacterial activities of the seed ethanolic extracts were screened against five human pathogenic microorganisms including, Micrococcus luteus (ATCC10240), Staphylococcus aureus subsp. aureus (ATCC 33862), Bacillus subtilis BCC, Escherichia coli (ATCC4157), and Salmonella enterica subsp. arizonae (ATCC13314). Strains were grown in liquid nutrient broth (Difco, Surrey, England) at 37°C for 24 h before being used.
Antimicrobial bioassay and quantitative evaluation of antimicrobial activities
A microplate-bioassay (microdilution) was used to study the antimicrobial activities of seed ethanolic extracts of different Tunisian barley varieties. An aliquot, corresponding to 100 µg plant dry matter, was dropped in sterile 96-well plates (NUNC microplate, Fisher Bioblock). After complete evaporation of the solvent, 100 µl microorganism suspensions (102 cells⋅ml−1) obtained by dilution from the culture tube (108 cells⋅ml−1) were added to each well. Microbial suspension was used alone as positive control or in the presence of antibiotic mixture (5 mg⋅ml−1 streptomycin and 10 mg⋅ml−1 penicillin G) as negative control. Thereafter, the microplate was aseptically sealed, agitated, and incubated at 30°C for 24 h. Finally, microorganism growth was estimated by reading the absorbance in microplate wells at 405 nm with a microplate spectrophotometer (Multiskan MCC/340.Titertek). Antimicrobial activity was expressed as growth inhibition percentage as previously described by Fabri et al.[Citation26] using the following formula:
where ASC is the absorbance of the sterility control (negative control), and AGC is the absorbance of the growth control (positive control).
HPLC-DAD-ESI-MS analysis of phenolic compounds
The phenolic composition of the seed ethanolic extracts of TBV was determined as previously described by Gomez-Caravaca et al.[Citation27] with some modification. A liquid chromatography apparatus HP 1100 series from Agilent Technologies, including a degasser, a binary pump delivery system, and an automatic liquid sampler, was used and coupled to diode array (DAD) and mass spectrometer (MS) detectors. Also, 5 μl of filtered sample was injected in a reverse phase column Poroshell 120 SB-C18 (3 × 100 mm, 2.7 μm) from Phenomenex, and the separation was carried out using as a mobile phase A acidified water (1% acetic acid) and as mobile phase B acetonitrile. The following multistep linear gradient was applied: 0 min, 5% B; 12.5 min, 30% B; 17.5 min, 60% B; 22 min, 5% B. The initial conditions were maintained for 5 min. The flow rate was set at 0.6 ml⋅min–1 throughout the gradient. UV spectra were recorded from 210 to 600 nm, while the chromatograms were registered at 280 and 330 nm. Separation was carried out at 25°C. The extracted compounds were identified by analysing MS spectra and quantified by UV chromatograms. The quantification was performed by comparison to calibration curves of catechin and ferulic acid at 280 nm and 330 for the different phenolic compounds: catechin: y = 5,3421x-7,1422, ferulic acid (280 nm): y = 26,287x–78,077, ferulic acid (330 nm): y = 37,286x + 521,96.
Statistical analysis
All extractions and assays were conducted in triplicate. The means were compared by using one-way analysis of variance followed by Duncan’s multiple-range tests performed by the ‘Statistica v 5.1’ software (Statsoft, 2008). The differences between individual means were deemed to be significant at p < 0.05. Pearson’s correlation analysis and principal component analysis (PCA) were performed using SPSS 16.0 for
Windows (SPSS Inc., Chicago, IL, USA; 2007).
Results and discussion
Total phenolic contents
In foodstuffs and in the beer brewing process, these compounds influence several stages of the brewing process and the overall beer stability including formation of haze, colour, taste, filtration, foam stability, and redo.[Citation28,Citation29] Generally, the spread of the results in terms of TPC in cereal is usually caused by the difference in species, areas and conditions of growth, storage, harvest, and treatment of the grains.[Citation8] In the present study, the TPCs of seed ethanolic extracts of four TBV were determined by Folin–Ciocalteu method, and the results are expressed as milligrams of gallic acid equivalents per gram of dry weight. The data () showed that all the barley varieties contain considerable levels of TPC. However, a significant variation in the amount of TPC among these varieties was noted. Swihli barley showed the highest TPC with 1.23 mg GAE⋅g−1 DW, followed by Rihane, Faiz, and Manel varieties with 1, 0.58, and 0.4 mg GAE⋅g−1 DW, respectively (). Contrarily to the previous findings reported by Lahouar et al.[Citation30] describing that Rihane barley had the highest TPC compared to other TBV (Manel, Roho, and Tej), we showed here that Swihli barley (which is studied for the first time) had significantly higher content of phenolic compounds than that of Rihane. This new information suggests that Swihli barley is more preferred than any other TBV for a healthy diet and further industrial applications mainly in the brewing industry regarding the great importance of the presence of higher amounts of antioxidants in preventing oxidation reactions and prolonging the shelf life of the beer.[Citation29]
Figure 1. Total phenolic content (TPC) in four Tunisian barley varieties. Means (expressed as mg GAE⋅g−1 DW) of three replicates followed by at least one same letter are not significantly different at p < 0.05.
Antioxidant capacities
Antioxidant capacities of barley extracts were determined as ABTS radical-scavenging, β-carotene bleaching, FRAP, DPPH, and superoxide anion (O.2) radical-scavenging activities. The results are presented in . A significant genotypic difference in the antioxidant capacity was observed among the four barley varieties.
Table 1. Antioxidant activities of seed extracts of Tunisian barley varieties.
ABTS assay
The ability of seed ethanolic extracts of TBV to neutralize ABTS radical was assessed and results are presented in . Results showed effective and variable antioxidant capacity depending on the barley variety. In fact, seed extracts of Swihli variety clearly showed the highest antiradical activity as indicated by the lowest IC50 value (96.62 ± 0.33 µg⋅ml–1). Rihane variety occupied the second place with considerable antioxidant activity (IC50 = 100.66 ± 0.47). However, Faiz and Manel varieties exhibited the lowest antiradical-scavenging activities among the studied varieties with IC50 values of 160.26 ± 0.68 and 170.29 ± 0.69 µg⋅ml−1, respectively. Similar to our findings, a significant influence of the barley variety on the antioxidant activity when measured by ABTS method was reported in other previous studies.[Citation7,Citation30]
FRAP assay
Chelating agents may inhibit radical generations by stabilizing transition metals, consequently reducing free radical damage. To better estimate the potential antioxidant activities of the different barley extracts, chelating activity of each extract was evaluated against Fe2+. As shown in , the results indicated that the IC50 values of the different barley extracts exhibited a wide variation ranging from 169.2 ± 1.22 to 440.63 ± 7.1 µg⋅ml−1. Swihli barley extract had the highest chelating activity (IC50 = 169.2 ± 1.22 µg⋅ml−1), followed by that of Rihane (IC50 = 184.6 ± 1.68 µg⋅ml−1). Extracts from Manel and Faiz varieties showed the lowest chelating activities with IC50 values of 342.33 ± 1.68 and 440.63 ± 7.1 µg⋅ml−1, respectively. The chelating effect of Swihli barley extract is approximately 2.6-fold that of Manel. However, Lahouar et al.[Citation30] reported no significant difference between the antioxidant activities among the Tunisian barley varieties in FRAP activity. According to these authors, this result was due to the delicacy of the FRAP method and more care should be taken when using free radicals as a basis for antioxidant activity tests because the measured antioxidant activity of a biological sample depends on the free radical or oxidant that is being used in assay.
β-Carotene assay
In this assay, oxidation of linoleic acid produces hydroperoxide-derived free radicals which attack the chromophore of β-carotene, resulting in a bleaching of the reaction emulsion. An extract capable of retarding/inhibiting the oxidation of β-carotene may be described as a free radical scavenger and primary antioxidant.[Citation31] As shown in , all the barley seed extracts were able to inhibit the bleaching of β-carotene by scavenging linoleate–derived free radicals, indicating the presence of active phenolic compounds in these extracts. Similar to the results showed above which are obtained by ABTS and FRAP assays, seed extracts of Swihli variety demonstrated the highest antioxidant potential. The order of decreasing efficacy was Swihli (IC50 = 52.59 ± 0.43 µg⋅ml−1) > Rihane (IC50 = 70.65 ± 0.15 µg⋅ml−1) > Faiz (IC50 = 91.20 ± 1.11 µg⋅ml−1) > Manel (IC50 = 91.20 ± 1.11 µg⋅ml−1).
DPPH assay
The DPPH is a stable radical with a maximum absorbance at 517 nm that can readily undergo reduction by an antioxidant. This activity was evaluated by the capacity to neutralize DPPH radical. The barley extracts showed a significant variability in their capacity to neutralize this radical (). Swihli barley exhibited the highest activity with IC50 values of 44.83 ± 0.35 µg⋅ml−1, followed by Rihane, Faiz, and Manel with 58.08 ± 3.5, 80.36 ± 0.05, and 85.71 ± 0.55 µg⋅ml−1, respectively. Zhao et al.[Citation18] also reported significant differences in DPPH radical-scavenging activity for different barley varieties, suggesting that variety might have significant influences on the antioxidant activity. This difference might be strongly related to the phenolic content and also to the type of the active compound present in each barley extract. Significant correlations were observed between TPC and DPPH-scavenging activity, indicating the role of phenolic compounds in inhibiting free radicals and radical cations under these systems.[Citation30] On the same trends, Yu et al.[Citation32] reported similar observations when studying the antioxidant properties of three wheat varieties from China.
Superoxide assay
The obtained results shown in indicated that the four barley extracts were able to quench superoxide anion although significant variations (p < 0.05) were recorded. In fact, extracts from Swihli are the most active with IC50 values of 62.62 ± 0.46 μg⋅ml−1, followed by those from Rihane, Faiz, and Manel with IC50 values of 80.42 ± 0.06, 110.15 ± 0.37, and 111.40 ± 1.56 μg⋅ml−1, respectively.
Collectively, based on the five antioxidant assays used to evaluate the antioxidant capacities of Tunisian barley varieties, the order of decreasing efficacy was Swihli > Rihane > Faiz > Manel. This data allowed the same conclusion mentioned above regarding the classification of the different barley varieties according to their TPC.
Antibacterial activities
Several studies have reported the inhibitory effect of phenolic compounds on the growth of pathogens and cancer cells.[Citation33,Citation34] Recent experiments proved that TBV had considerable protective effects against both cardiovascular disease and colon cancer.[Citation33,Citation35] In the present work, we investigated the antimicrobial capacities of seed ethanolic extracts against five human pathogenic bacteria to search for novel biological activities for the TBV. Our findings () provided for the first time that extracts from barley had considerable antibacterial activities. Our data clearly indicated that the antibacterial activities of TBV showed the same tendency as their antioxidant capacities. Indeed, Swihli barley, which was found to possess the highest antioxidant potential, also exhibited the highest antibacterial effect as it was the only variety that reduced the growth of all the tested microorganisms (). Swihli extracts inhibited the growth of S. aureus (), M. luteus, E. coli (), and S. enterica () by 67.26%, 44.78%, 42.95%, and 33.35%, respectively, compared to controls. Extracts of the other barley varieties were also able to reduce the growth of four of the five tested strains with variable efficiencies depending on the bacterial strain. Extracts from Rihane reduced mainly the growth of S. aureus (), E. coli (), and M. luteus () with 52.16%, 42.72%, and 38.57% compared to the controls. Faiz seed extracts reduced mainly the growth of S. aureus (), E. coli (), and M. luteus () by 44.83%, 32.46%, and 30.11%, respectively. Finally, Manel seed extracts reduced the growth of E. coli (), S aureus (), and M. luteus () by 44.78%, 36.06%, and 34.68%, respectively, compared to the controls. There are no available comparable results describing the antibacterial activities of extracts from barley species in the literature.
Figure 2. Antimicrobial properties of barley seed extracts. In vitro evaluation of the antibacterial activity of various barley extracts against five pathogenic microorganisms expressed as percentage of growth inhibition. Means of three replicates followed by at least one same letter are not significantly different at p < 0.05.
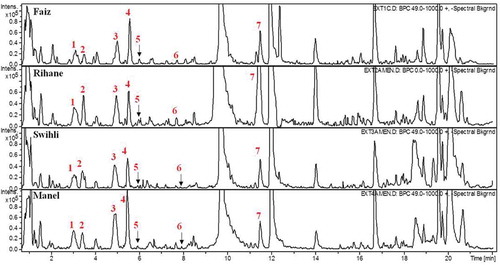
Identification and quantification of phenolic compounds by HPLC-DAD-ESI-MS
HPLC-DAD-ESI-MS system was used to identify and quantify phenolic compounds in the four TBV. The phenolic compounds in barley seed extracts were identified by analysing MS spectra, comparison with available standard compounds, retention time, and literature. Quantification was performed on the basis of UV chromatograms. The base peak chromatograms demonstrating the separation of phenolic compounds in the extracts of the four barley varieties are shown in . The identified phenolic compounds provided by LC-DAD-ESI-MS analysis are summarized in . The total concentrations of phenolic compounds varied as a function of the barely variety. In fact, Swihli barley showed the highest TPC with 827.62 µg⋅g−1 DW, followed by Rihane, Faiz, and Manel with 786.78, 603.20 and 376.63 µg⋅g−1 DW, respectively (). The LC-MS analysis confirmed the above results obtained by the Folin–Ciocalteu method as it gave the same classification of TBV according to their TPC. In total, seven phenolic compounds were identified and can be grouped in two different chemical families: flavanols including gallocatechin–gallocatechin–catechin (GC-GC-C), catechin-3-glucose (CGl), procyanidin B3 (PB3), and catechin and phenolic acids including VA, hydroferuloyl glucose (HFG), and synapoyl hexose (SH).
Table 2. LC-DAD-ESI-MS determination of phenolic compounds in four Tunisian barley varieties.
Table 3. Pearson’s correlation test between TPC and various antioxidant assays evaluation indices and among the different methods used to evaluate antioxidant activity.
Figure 3. HPLC-DAD-ESI-MS chromatograms of phenolic compounds in four Tunisian barley varieties. The chromatogram was obtained for the maximum wavelength at each time point. 1: GC-GC-C; 2: catechin-3-glucose; 3: procyanidin B3; 4: catechin; 5: vanillic acid; 6: hydroferuloyl glucose; 7: synapoyl hexose.
The results have shown significant quantitative and qualitative differences in the phenolic fraction according to the barley variety in almost of phenolic compounds (). Flavanols were by far the most abundant group of phenols (in terms of concentration) in all the analysed samples, regardless of the variety (,). Their content per variety decreased as follows: Swihli > Rihane > Faiz > Manel (). This tendency was in agreement with the results obtained by other authors for different Spanish and Italian barley genotypes.[Citation27] Also, Carvalho et al.[Citation6] reported that flavanols were the major phenolic fraction in barley and malt from Portugal. In this work, PB3 (a dimeric flavanol) was found to be the most abundant phenolic compound identified in the four barley varieties with 72.63%, 72.46%, 68.19%, and 61.63% of the TPC for Swihli, Faiz, Rihane, and Manel, respectively (). However, Gomez-Caravaca et al.[Citation27] reported that the trimeric proanthocyanidins (C-GC-C and C-C-C) were the most abundant free phenolic compounds in Italian and Spanish barely varieties. Procyanidins and catechin were reported to be the major phenolics in numerous barley genotypes native to Japan.[Citation3] Carvalho et al.[Citation6] described that catechin was the major free phenolic compound for both barley and malt from Portugal.
Figure 4. Contents in flavanols (a) and phenolic acids (b) as a function of barley variety.
Figure 5. Proportion (%) of procyanidin B3 compared to the rest of flavanols and phenolic acid family in Tunisian barley varieties.
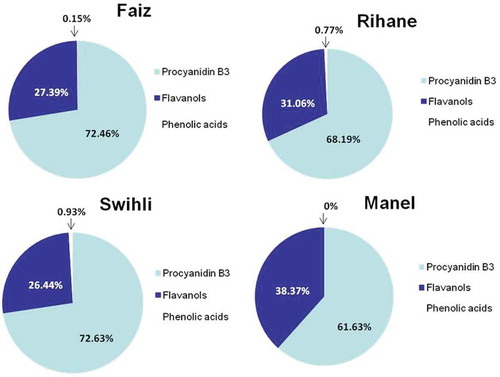
The other flavanols identified in the present study, GC-GC-C, CGl, and catechin, accounted for 38.37%, 31.06%, 27.39%, and 27.39% of the TPC for Manel, Rihane, Faiz, and Swihli, respectively (). Clearly, Swihli and Rihane varieties exhibited the highest values in CGl (48.81 and 48.2 µg⋅g−1 DW, respectively), differing significantly from the other barley genotypes (17.63 and 15.39 µg⋅g−1 DW for Faiz and Manel, respectively). The content in GC-GC-C decreased significantly as follows: Rihane > Swihli > Faiz > Manel. However, no significant difference was noted in the content of catechin in the four barley varieties ().
Concerning the amounts of phenolic acids, HFG was the most abundant quantified compound of this family (). The phenolic acids accounted only for 0.93%, 0.77%, 0.15%, and 0% of the total phenols for Swihli, Faiz, Rihane, and Manel, respectively (). As shown in , both Swihli and Rihane varieties displayed the highest values in VA (2.95 and 3.27 µg⋅g−1 DW, respectively) and HFG (4.75 and 2.8 µg⋅g−1 DW, respectively). VA and HFG were not present in Manel barley. SH, which is a phenolic acid derivative, was detected in all the barley varieties but with amounts under the limit of quantification (LOQ). Ferulic and coumaric acids were not detected in TBV as free phenolics in contrast to other barley varieties from Italy[Citation11] and Portugal.[Citation6]
Pearson’s correlation analysis
Correlations of the various antioxidant assays with TPCs and among each other
As the lowest IC50 values for the various antioxidant assays correspond to the strongest antioxidant activities, the correlation coefficients between TPC and the different antioxidant assays revealed by Pearson’s test were expressed as negative values (). According to Pearson’s correlation analysis, significant correlations between the TPC and the various antioxidant assays were observed (). DPPH assay and TPC showed the highest correlation at α = 0.05 (r = −0.9877). This is in accordance with previous findings reported by Zhao et al.[Citation7] describing that phenolic compounds in Chinese barley varieties were the major contributors of ABTS, DPPH, and FRAP antioxidant assays. Furthermore, Šimić et al.[Citation35] reported that among the hulless barley lines studied hulless barley varieties with the highest TPCs (GZ-191 and GZ-186) showed also the highest antioxidant activities. Zhou et al.[Citation36] reported good correlations for the wheat grain and fractions when DPPH radical-scavenging activity and ABTS radical cation-scavenging activity were compared with TPC. The findings of Lahour et al.[Citation29] showed also positive correlations of TPC with DPPH and ABTS antioxidant assays but not with the FRAP method. On the other hand, strong correlations were found between the different antioxidant methods used to evaluate the antioxidant potential of TBV (). In fact, DPPH and ABTS methods showed the highest positive correlation (r = 0.935). Our results are in accordance with those reported by Lahour et al.[Citation29] describing a strong positive correlation between DPPH and ABTS antioxidant assays. Contrarily, Zhao et al.[Citation7] reported some discrepancies between ABTS and DPPH methods when studying the potential antioxidant of different barley varieties from China. The different results from two methods might be due to different reaction kinetics between phenol and DPPH radical as well as ABTS radical cation over a similar range of concentrations.
Correlations between antioxidant activity (DPPH assay) and the contents of individual phenolic compounds
Phenolic compounds were reported to be responsible for the antioxidant activity of vegetables and cereals.[Citation1,Citation3,Citation4] To clarify the relationship between antioxidant activity and contents of phenolic compounds in TBV, the correlation between DPPH assay and contents of individual phenolic compounds was investigated. DPPH assay was used for this correlation analysis as it showed the highest correlation coefficient with TPC as described above. According to Pearson’s correlation analysis (), significant correlations were observed between the DPPH assay and both HFG (r = −0.9962, α = 0.05) and CGl (r = −0.9606, α = 0.05), suggesting that these compounds are the major contributors in the antioxidative capacity of TBV. It is important to mention that Swihli barley with the highest antioxidant capacity as described above exhibited the highest contents in both HFG and CGl.
Table 4. Pearson’s correlation test between the antioxidant activity (DPPH assay) and the individual phenolic compounds.
PCA of the various barley varieties based on their contents in individual phenolic compounds and antioxidant activities (DPPH assay)
A PCA was applied to gain an overview of the similarities and differences among the four barley varieties based on their phenolic composition and their DPPH-scavenging activities. The distance between the locations of any two barley samples on the score plot is directly proportional to the degree of differences or similarity between them. PCA () contributed to a further profiling of the four barley varieties. The first and second principal components (PC1 × PC2) described 96.39% of the analysis data variability for the TBV. The first principal component (PC1) explained most of the variance (78.05%).
Figure 6. Scores plot obtained by principal component analysis of different barley varieties based on their antioxidant activity and individual phenolic compounds contents.
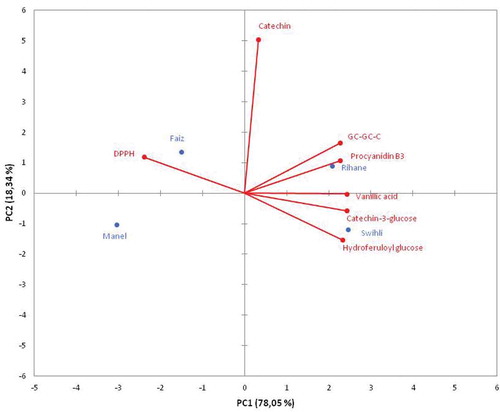
Regarding these principal components, the cultivars could be discriminated on the PCA diagrams. shows that Swihli barley, which has the highest antioxidant activity (DPPH-scavenging activity), could be discriminated from the other varieties by its highest content in HFG. However, Rihane barley could be discriminated mainly on the basis of its highest content in GC-GC-C. Manel barley, which showed the lowest antioxidant activity, could be discriminated by its lowest content in HFG. Our results are in accordance with those previously reported by Gomez-Caravaca et al.[Citation27] describing that PCA was able to discriminate between ‘waxy’ and ‘non-waxy’ barley samples based only in free phenolic compounds.
Conclusion
Our data indicated a significant genotypic variability among the selected TBV in TPCs, antioxidant and antimicrobial capacities. Swihli barley showed the highest TPC as well as the strongest antioxidant and antibacterial capacities. HPLC-DAD-ESI-MS analysis revealed significant qualitative and quantitative differences in phenolic composition among the four barley varieties. The detected phenolic compounds included GC-GC-C, CGl, PB3, catechin, VA, HFG, and SH. The dominant phenolics in the four barley varieties were PB3 and catechin. Pearson’s correlation test revealed strong correlations between TPCs and the various antioxidant assays. Also, significant correlations were found between the various antioxidant assays of each other. Interestingly, significant correlations were noted between the antioxidant activity and both HFG and CGl, suggesting their major role in the antioxidative effect of TBV. PCA contributed to a further profiling of the four barley varieties as each variety could be discriminated on the PCA diagrams based on its phenolic composition. This is the first time in which the phenolic composition of TBV was studied which is of utmost importance for the brewing industry at the point of selecting the raw material to improve the quality of beer and extend its shelf life. In addition, this work is the first describing antimicrobial properties of barley extracts which might open new perspective for their valuation as natural antimicrobials in food industry.
Acknowledgement
The authors thank the Tunisian Ministry of Higher Education and Scientific Research for financing this work.
Related Research Data
References
- Truswell, A. S.;. Cereal Grains and Coronary Heart Disease. European Journal of Clinical Nutrition 2001, 55, 137–143.
- Ross, A. B.; Kamal-Eldin, A.; Åman, P. Dietary Alkylresorcinols: Absorption, Bioactivities, and Possible Use as Biomarkers of Whole-Grain Wheat- and Rye-Rich Foods. Nutrition Revues 2004, 62, 81–95.
- Yoshida, A.; Sonoda, K.; Nogata, Y.; Ngamine, T.; Sato, M.; Oki, T.; Hashimoto, S.; Ohta, H. Determination of Free and Bound Phenolic Acids, and Evaluation of Antioxidant Activities and Total Poloyphenlic Acids Contents in Selected Pearled Barley. Food Science and Technology Research 2010, 16, 215–224.
- Gani, A.; Wani, S. M.; Masoodi, F. A.; Gousia, H. Whole-Grain Cereal Bioactive Compounds and Their Health Benefits: A Review. Food Processing and Technology 2012, 3, 3.
- Eksiri, M.; Nateghi, L.; Haghverdi, A. The Effects of Physicochemical Factors on Malting (Review). Advances in Environmental Biology 2014, 8, 1056–1063.
- Carvalho, D. O.; Curto, A. F.; Guido, L. F. Determination of Phenolic Content in Different Barley Varieties and Corresponding Malts by Liquid Chromatography-Diode Array Detection-Electrospray Ionization Tandem Mass Spectrometry. Antioxidants 2015, 4, 563–576.
- Zhao, H.; Fan, W.; Dong, J.; Lu, J.; Chen, J.; Shan, L. Evaluation of Antioxidant Activities and Total Phenolic Contents of Typical Malting Barleys Varieties. Food Chemistry 2008, 107, 296–304.
- Aleksenko, S. S.;. Antioxidant Activity and Phenolic Compounds of Buckwheat and Barley by the Data of Spectrophotometry and HPLC. Journal of Analytical Chemistry 2013, 68, 458–465.
- Gupta, M.; Abu-Ghannam, N.; Gallaghar, E. Barley for Brewing: Characteristic Changes during Malting, Brewing and Applications of Its By-Products. Comprehensive Reviews in Food Science and Food Safety 2010, 9, 318–332.
- Leitao, C.; Marchioni, E.; Bergaentzle, M.; Zhao, M.; Didierjean, L.; Taidi, B.; Ennahar, S. Effects of Processing Steps on the Phenolic Content and Antioxidant Activity of Beer. Journal of Agriculture and Food Chemistry 2011, 59, 1249–1255.
- Bonoli, M.; Marconi, E.; Caboni, M. F. Free and Bound Phenolic Compounds in Barley (Hordeum Vulgare L.) Flours: Evaluation of the Extraction Capability of Different Solvent Mixtures and Pressurized Liquid Methods by Micellar Electrokinetic Chromatography and Spectrophotometry. Journal of Chromatography A 2004, 1057, 1–12.
- Iyuke, S. E.; Madigoe, E. M.; Maponya, R. The Effect of Hydroxycinnamic Acids and Volatile Phenols on Beer Quality. Journal of the Institute of Brewing 2008, 114, 300–305.
- Cai, S.; Han, Z.; Huang, Y.; Chen, Z. H.; Zhang, G.; Dai, F. Genetic Diversity of Individual Phenolic Acids in Barley and Their Correlation with Barley Malt Quality. Journal of Agriculture and Food Chemistry 2015, 63, 7051–7057.
- Hernanz, D.; Nunez, V.; Sancho, A. I.; Faulds, C. B.; Williamson, G.; Bartolome, B.; Gomez-Cordoves, C. Hydroxycinnamic Acids and Ferulic Acid Dehydrodimers in Barley and Processed Barley. Journal of Agriculture and Food Chemistry 2001, 49, 4884–4888.
- Dvořáková, M.; Douanier, M.; Jurková, M.; Kellner, V.; Dostálek, P. Comparison of Antioxidant Activity of Barley (Hordeum Vulgare L.) And Malt Extracts with the Content of Free Phenolic Compounds Measured by High Performance Liquid Chromatography Coupled with CoulArray Detector. Journal of the Institute of Brewing 2008, 114, 150–159.
- Bvochora, J. M.; Danner, H.; Miyafuji, H.; Braun, R.; Zvauya, R. Variation of Phenolic Compounds during the Preparation of Opaque Beer. Processing Biochemistry 2005, 40, 1207–1213.
- Van Gheluwe, J. E. A.; Valyi, Z.; Dadic, M. Oxidation in Brewing. Brewers Digest 1970, 45, 70–79.
- Zhao, H.; Dong, J.; Lu, J.; Chen, J.; Li, Y.; Shan, L.; Lin, Y.; Fan, W.; Gu, G. Effects of Extraction Solvent Mixtures on Antioxidant Activity Evaluation and Their Extraction Capacity and Selectivity for Free Phenolic Compounds in Barley (Hordeum vulgare L.). Journal of Agriculture and Food Chemistry 2006, 54, 7277–7286.
- Gamel, T. H.; Abdel-Aal, E. M. Phenolic Acids and Antioxidant Properties of Barley Wholegrain and Pearling Fractions. Agricultural Food Sciences 2012, 21, 8–13.
- Dewanto, V.; Wu, X.; Adom, K. K.; Liu, R. H. Thermal Processing Enhances the Nutritional Value of Tomatoes by Increasing Total Antioxidant Activity. Journal of Agriculture and Food Chemistry 2002, 50, 3010–3014.
- Re, R.; Pellegrini, N.; Proteggente, A.; Pannala, A.; Yang, M.; Rice-Evans, C. Antioxidant Activity Applying an Improved ABTS Radical Decolorization Assay. Free Radical Biology and Medicine 1999, 26, 1231–1237.
- Oyaizu, M.;. Studies on Products of the Browning Reaction Prepared from Glucose Amine. Japan Journal of Nutrition 1986, 44, 307–315.
- Koleva, I. I.; Van Beek, T. A.; Linssen, J. P. H.; De Groot, A.; Evstatieva, L. N. Screening of Plant Extracts for Antioxidant Activity: A Comparative Study on Three Testing Methods. Phytochemical Analysis 2002, 13, 8–17.
- Hatano, T.; Kagawa, H.; Yasuhara, T.; Okuda, T. Two New Flavonoids and Other Constituents in Licore Root: Their Relative Astringency and Radical Scavenging Affects. Chemical and Pharmaceutical Bulletin 1988, 36, 1090–2097.
- Duh, P. D.; Tu, Y. Y.; Yen, G. C. Antioxidant Activity Ofwater Extract of Harngjyur (Chrysanthemum morifolium Ramat). Lebensmittel-Wissenschaft and Technologie 1999, 32, 269–277.
- Fabri, R. L.; Nogueira, M. S.; Braga, F. G.; Coimbra, E. S.; Scio, E. Mitracarpus frigidus Aerial Parts Exhibited Potent Antimicrobial, Antileishmanial, and Antioxidant Effects. Bioresource Technology 2008, 100, 428–433.
- Gomez-Caravaca, A. M.; Verardo, V.; Berardinelli, A.; Marconi, E.; Caboni, M. F. A Chemometric Approach to Determine the Phenolic Compounds Indifferent Barley Samples by Two Different Stationary Phases: A Comparison between C18 and Pentafluorophenyl Core Shell Columns. Journal of Chromatography A 2014, 1355, 134–142.
- Uchida, M.; Ono, M. Improvement of Oxidative Flavor Stability of Beer-Role of OH-radical in Beer Oxidation. Journal of the American Society of Brewing Chemists 1996, 54, 198–204.
- Bamforth, C. W.;. Beer Quality: Oxidation. Brewer’s Guardian 2000, 4, 31–34.
- Lahouar, L.; El-Arem, A.; Ghrairi, F.; Chahdoura, H.; Ben Salem, H.; El-Felah, M.; Achour, L. Phytochemical Content and Antioxidant Properties of Diverse Varieties of Whole Barley (Hordeum Vulgare L.) Grown in Tunisia. Food Chemistry 2014, 145, 578–583.
- Liyana-Pathirana, C. M.; Shahidi, F. Antioxydant Propreties of Commercial Soft and Hard Winter Wheats (Triticum aestivium L.) And Their Milling Fractions. Journal of the Science of Food and Agriculture 2006, 86, 477–485.
- Yu, L.; Haley, S.; Perret, J.; Harris, M.; Wilson, J.; Qian, M. Free Radical Scavenging Properties of Wheat Extracts. Journal of Agriculture and Food Chemistry 2002, 6, 1619–1624.
- Lahouar, L.; Ghrairi, F.; El-Felah, M.; Ben Salem, H.; Miled, A. H.; Hammami, M. Effect of Dietary Fiber of “Rihane” Barley Grains and Azoxymethane on Serum and Liver Lipid Variables in Wistars Rats. Journal of Physiology and Biochemistry 2011, 67, 27–34.
- Cai, Y.; Luo, Q.; Sun, M.; Corke, H. Antioxidant Activity and Phenolic Compounds of 112 Traditional Chinese Medicinal Plants Associated with Anticancer. Life Sciences 2004, 74, 2157–2184.
- Lahouar, L.; Pochart, P.; Ben Salem, H.; El-Felah, M.; Mokni, M.; Magne, F. Effect of Dietary Fibre of Barley Variety ‘Rihane’ on Azoxymethane Induced Aberrant Crypt Foci Development and on Colonic Microbiota Diversity in Rats. British Journal of Nutrition 2012, 14, 1–9.
- Šimić, G.; Horvat, D.; Dvojković, K.; Abičić, I.; Viljevac-Vuletić, M.; Tucak, M.; Lalić, A. Evaluation of Total Phenolic Content and Antioxidant Activity of Malting and Hulless Barley Grain and Malt Extracts. Czech Journal of Food Sciences 2017, 35, 73–78.