
ABSTRACT
Native glucomannan (Lot A; pH = 5.3) and weakly deacetylated glucomannan (Lot L; pH = 9.1) gels were subjected to high hydrostatic pressure (HHP): 100, 200, 400, and 600 MPa and studied the influence of HHP on the structural and rheological properties of glucomannan gels. HHP improved the conformational stability, reticular deformability and the energy stability of hydrogen bonds in junction zones of the glucomannan matrix for lot A gels. For lot L gels, 600 MPa was needed to increase the energy content of physical bonds enhancing the solid-like character of the glucomannan matrix. Thermal profiles of pressurized lot A gels exhibited thermophobic behaviour and increased the gel-like character up to 90°C as compared with its unpressurized control. For Lot L gels, the rubber-like response was also shown at T > 70°C for the unpressurized sample, and was maintained at 100, 200, and 600 MPa.
Introduction
Restructured seafood products are an alternative way of using muscle by-products to make new products with a novel appearance and texture. Several different gelation processes can be used for seafood restructuring, the most common being the thermostable gelation of their own protein. However, in situations in which protein gelation is reduced, i.e. heated or fatty muscles, new alternatives are needed to achieve gelling. A neutral hydrocolloid, konjac glucomannan (KGM), is able to form a thermostable gel when deacetylated which can be used as a gelling agent for restructured seafood products in which minced muscle proteins are coupled with glucomannan (GM).[Citation1] In fact, hydrogels of deacetylated GM at 3–5 g/100 mL form three-dimensional networks at locally ordered regions (junction zones) stabilized by physical interactions such as hydrogen bonds and hydrophobic interactions.[Citation2] Previous studies have determined the most adequate GM gelation conditions to produce gels in combination with minced fish to make restructured seafood products with the appropriate texture thorough rheological study of GM network stability.[Citation3] Moreover, these same authors[Citation4] concluded that the most elastic and time-stable 5 g/100 mL GM gel network was obtained by using 0.6 mol/L KOH as the gelling agent at pH~10.7. [Citation3]
In recent years, high hydrostatic pressure (HHP) has been increasingly used in the food industry as an emerging technological alternative to thermal processing to produce foods with novel textures.[Citation5] HHP could also offer new ways, by new bonding inducing and so inferring different molecular arrangements, of making GM gels with different textures. In this regard, the effect of HHP on the structural, physicochemical and thermo-rheological properties of 5 g/100 mL gels have been studied at pH~10.7 before applying HHP.[Citation6] These authors showed that several pressures (100, 200, 400, and 600 MPa) produced different responses in the GM network and that 600 MPa reinforced the degree of crystallinity when GM was completely deacetylated producing more rigid and brittle networks while 200 MPa produced softer and more flexible networks.[Citation6] However, the high pH (~10.7) of GM gels at 5 g/100 mL is not very suitable from a sensory point of view so it would be better to make GM gels at neutral and the lowest possible pH (9.1) to design in a next step restructured seafood products with high sensorial and textural quality. But at neutral and low alkaline pH, the GM molecules contain acetyl groups which origin repulsive excluded-volume forces due to steric hindrance,[Citation7] consequently the acetyls alter the structural function of HHP over GM network comparing with that on deacetylated GM gels. For that reason, the aim of this study is to analyse the effect of the HHP on native and weakly deacetylated GM gels at 5 g/100 mL concentration in terms of their structural and thermo-rheological properties in order to produce gels which could be used in a further step, to make restructured seafood analogues.
Materials and methods
Sample preparation
Two lots of GM gels were made: “Lot A” (native GM gels, the control) and “Lot L” (weakly deacetylated GM gels) at 5 g/100 mL of GM concentration from KGM (average molecular mass approximately 11 × 105 Da, Guinama, Valencia, Spain) were prepared according to the methodology described in previous works.[Citation3,Citation4] Then, half of the 5 g/100 mL GM gels were slightly deacetylated by adding 1.5 mL/100 mL of 0.6 mol/L KOH (Panreac Química, S.A., Barcelona, Spain) raising pH to 9.1 (lot L). No coagulant agent was added to the other half of 5 g/100 mL of GM gels (lot A, pH = 5.3). Petri dishes were then filled with both lots (A and L) and set by heating, first at 30°C for 1 h and then at 5°C for 4 h as setting conditions. Lot L gels were then placed in a citrate-phosphate buffer at pH 5 (1:10 gel:buffer proportion) for 20 h at 5°C to lower pH to neutral values. Then both gels (A and L) were immediately vacuum packed in double plastic bags to prevent contact with pressurization fluid and subjected to different degrees of HHP: 0, 100, 200, 400, and 600 MPa for 10 min at 10°C (Stansted Fluid Power CTD, FPG 7100:-2C. Harlow, Essex, UK). The different gels were named A0, A100, A200, A400, and A600 for native GM gels (lot A) subjected to: 0, 100, 200, 400 and 600 MPa, and, L0, L100, L200, L400 and L600 for weakly deacetylated GM gels (lot L). All gels were warmed to 25°C before analysis. Analyses were conducted after 1 d of chilled storage at 5°C.
PH measurement and moisture content (%)
A model 9165BNWP pH probe (Analítica Instrumental, S.A., Barcelona, Spain) was inserted in the gel to measure pH. The pH meter was an Orion model 720A (Analítica Instrumental, S.A., Barcelona, Spain). Analyses were performed in triplicate. Water content was determined by drying samples to constant weight at 110°C, results expressed as a percentage.[Citation8] Measurements were carried out in triplicate.
FT-IR spectroscopy analysis
FT-IR analysis was performed by transmission measurement using a Perkin–Elmer Spectrum 400 Infrared Spectrometer (Perkin–Elmer Inc., Waltham, MA, USA). Samples were freeze-dried and dispersion was then achieved using a Fluorolube reagent as its absorption bands do not interfere with observation of the sample bands. At a subsequent step during spectra processing, Fluorolube bands are subjected from the samples spectra.[Citation3] A small quantity of the paste produced by homogenization with Fluorolube was placed between two CaF2 crystals. IR spectra were recorded for all samples by accumulating 32 scans with a resolution of 2/cm and the frequency range 4,000–100/cm. Measurements were done in triplicate and processed using Spectrum 400 software (Perkin–Elmer Inc., Waltham, MA, USA). To facilitate a quantitative discussion of the spectra from each spectrum, absorption intensity was assumed to be proportional to the concentration of the adsorbing species.[Citation9]
Dynamic rheometry measurements
Small-amplitude oscillatory strain (SAOS) tests were performed using a Bohlin CVO-controlled stress rheometer (Bohlin Instruments, Inc. Cranbury, NJ). Rheological measurements were performed at least in quintuplicate according to the methodology described in previous works.[Citation3,Citation4] The measurements were obtained using parallel-plate geometry (20-mm diameter and 1-mm gap). Before measurement, the gels were tempered at ambient temperature and cut from Petri dishes into disk-shaped slices 20-mm diameter and 1-mm thick with a 570 S.T.E slicing machine (Germany). Samples were covered with a thin film of Vaseline oil (Codex purissimum) to avoid evaporation. The temperature was controlled to within 0.1°C by a Peltier element in the lower plate which was kept at 25.0 °C.
Stress sweep tests
To determine the linear viscoelastic (LVE) region, stress sweeps were run at 1 Hz at 25°C with shear stress (σ) of the input signal varying from 1 to 1000 Pa. 300 points on the continuous mode were recorded in all instances. Changes in complex modulus (G*), and loss factor (tanδ) were recorded. Critical (maximum) values of shear strain (γmax) and shear stress (σmax) at the LVE range limit were evaluated.[Citation2]
Temperature sweep tests
Temperature sweep tests were performed for dynamic thermo-mechanical analysis (DTMA) from 20 to 90°C at a linear heating rate (1 K/min). Frequency (0.1 Hz) and strain γ = 1% within the LVE range were fixed.
Statistical analyses
Statistical analyses were performed using Microsoft Excel software. Data are presented as mean values of at least five independent batches and were tested for each experiment with expanded uncertainty limit (EUL) data as the maximum and minimum deviation from the respective mean value. Trends were considered significant when means of compared sets differed by p < 0.05 (Student’s t-test).
Results and discussion
Fourier transform infrared spectroscopy analysis (FT-IR)
FT-IR spectroscopy was performed for qualitative analysis of HHP of the molecular impact of pressurized GM gels made with native GM (, Lot A) and slightly deacetylated GM gels (, Lot L). Regarding the effect of HHP on the native GM network, a broad band was observed between 3,600 and 3,200/cm attributed to the stretching vibration of O–H due to the hydroxyl group of polysaccharides and/or water.[Citation10] This band broadened as pressure increased (), indicating an increase in the inter and intra-molecular hydrogen bonds in the GM matrix,[Citation11] which is a natural consequence of free volume reduction caused by pressure. The band appearing at ~2,900/cm was attributed to stretching vibration of C–H in polysaccharides [Citation12] and no change was observed as a consequence of different HHP processing (100–600 MPa).
Figure 1. FT-IR spectra of native glucomannan (lot A) (A) and weakly deacetylated (lot L) (B) glucomannan gels at 5g/100 mL of concentration at different high hydrostatic pressures 0MPa (A0 and L0); 100 MPa (A100 and L100); 200 MPa (A200 and L200); 400 MPa (A400 and L400), and 600 MPa (A600 and L600).
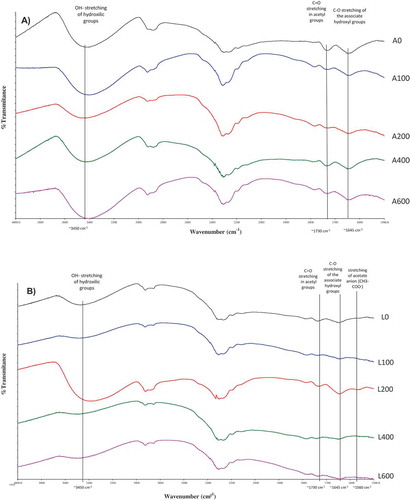
C = O stretching vibration of the acetyl group is commonly located at ~1,730/cm [Citation10] and occurred in all pressurized samples with no relevant differences among A100–A600 samples relative to A0. In this connection, a band at ~1,645/cm was observed in all samples corresponding to C–O stretching of the hydroxyl groups bonded to water molecules[Citation6] which was also similar for all samples (A0–A600). Concerning the effect of pH = 9.1 in control sample, the band between 3,600 and 3,200/cm corresponding to hydroxyl groups tends to broaden at L0 () relative to A0 (). Band broadening is a sign of the statistical distribution of different bonding arrangements at each O–H site,[Citation13] indicating that a loss of some acetyl groups in GM chains at L0 is associated with a rearrangement in the inter- and intra-chain hydrogen bonds increasing the number of frequencies with different wave numbers around 3,400/cm.[Citation14] Naturally, pressure increased the number of hydrogen bonds and reinforced the broadening of O–H bands, specifically at L100, L400 and L600 (). However, at L200 this O–H band had a more distinguishable absorption peak at approximately 3,400/cm (), suggesting a less coupled vibration (low hydrogen bonded) GM matrix at L200, which also coincides with the more intense absorption peak at ~1,645/cm at L200 (). This indicates more tightly-bounded water in the GM matrix at L200 [Citation15] indicating that an open matrix could be able to link a greater number of water molecules to the gel network. Moreover, in all samples (lot L) deacetylation of GM chains was observed, resulting from the lower intensity peak at ~1,730/cm compared with samples made with native GM (). Due to the small amount of KOH used, there is a low deacetylation ratio (6.3%) thus resulting in a weak band at ~1,560/cm associated with vibration of the acetate anion in the deacetylated GM.[Citation3]
Linear viscoelastic range
Stress sweep data showed that for native pressurized GM gels (A100–A600), stress (σmax) and strain (γmax) amplitudes increased significantly relative to the control (A0), with a significant rise in γmax in the case of sample A400. Meanwhile, A100 and A600 gels also had a higher σmax and γmax than A0, being statistically undistinguishable between A100 and A600 (). This shows that lower (100 MPa) and higher (400–600 MPa) pressure had a similar enhancement effect on the conformational flexibility of the native GM matrix, improving the structural stability and deformability of the gel network compared with gel A0.[Citation16]
Table 1. Effect of high pressure on the linear viscoelastic (LVE) parameters for native (A0–A600), and slightly deacetylated (L0–L600) glucomannan (GM) gels, at 5 g/100 mL concentration, frequency: 1 Hz T = 25°C.
also shows the influence of HHP on the loss factor (tanδ < 1) indicating that all samples were solid-like materials [Citation17] irrespective of pressure. Particularly in samples A100, A400, and A600, tanδ significantly decreased (p < 0.05) relative to A0 indicating that 100, 400 and 600 MPa structurally enhanced the GM matrix producing new inter-chain hydrogen bonds with greater energy content and mechanically reducing excluded-volume force, [Citation7] arising from acetyl groups in native GM, therefore enhancing the solid-like character (low tanδ) of the GM network but maintaining practically the same rigidity in gel networks as evidenced in the similar complex moduli (G*) which were statistically undistinguished in A100–A600 vs A0 (). Simultaneously considering the two trends observed in these samples (A100, A400 and A600), i.e. the significant increase in elastic character (low tanδ) and the significant increase in strain/stress amplitudes, it could be that in native GM, 100, 400, and 600 MPa increased the “real cooperativity” involved in the formation of effective junction zones [Citation18] between GM chains, producing a polymeric matrix with greater conformational flexibility and more energy content in junctions, thus, with longer lifetime, i.e. more solid-like character,[Citation19] involving similar sized junction zones, hence, with similar gel rigidity.
However, when GM was slightly deacetylated the structural benefits induced by pressure at σmax and γmax were not observed. In general, no relevant differences in σmax, γmax, and G* relative to L0 were observed for L100–L600 samples. Pressure was noted in the lowest tanδ for the L600 sample (), showing that in weakly deacetylated GM chains, the highest HHP value is needed to partially improve the GM matrix by increasing the energy content of junctions.[Citation20]
Moreover, a comparison of samples at fixed pressure (L100–L600 and A100–A600) showed that L100–L600 had significantly lower σmax, γmax values than their corresponding samples A100–A600 (). Also, L0–L400 samples had higher tanδ values than the corresponding A0–A400 ones, indicating that when GM chains were slightly deacetylated the solid-like behaviour of the polymeric matrix was reduced. This fact could be related with the alkalinisation at pH = 9.1, produced a weak ionization so fixed electrostatic charges at specific sites in GM matrix could increase the repulsive forces between GM chains reducing partially the degree of cross-linking as evidenced in the lower G* values of L100, L200, L600 vs A100, A200, and A600. respectively (). So, the increase in the electrostatic repulsions could produce more transient crosslinks and consequently the greater viscous component (high tanδ) and some less energy-stable GM matrix at hydrogels L0–L400. This effect was more noticeable in the L200 sample as evidenced by the highest tanδ and the lowest G* values although not significant (). This result is consistent with its more marked absorption band of O–H stretching (~3,400/cm) in the FT-IR spectrum, together with the more intense absorption peak at ~1,645/cm, indicating a higher number of water molecules binding to the GM matrix resulting in a more open matrix (low G*) with less energy content in junctions (high tanδ) at L200. The exception was L600 which exhibited the greatest solid-like character because greater energy content in chain associations in line with the broadening of O–H bands from FT-IR spectra (section 3.1).
Dynamic thermo-mechanical analysis
Both lots of GM gels were analysed by temperature sweeps at a constant heating rate to examine the influence of pressure on thermo-rheological changes in native (A100–A600) and slightly deacetylated (L100–L600) GM gels relative to controls, A0 and L0, respectively. To clarify this discussion the thermal profiles at the two principal temperature stages will be analysed depending on the thermal trends of G’ moduli ().
Figure 2. Thermal profiles of native (A, B) and weakly deacetylated (C, D) glucomannan gels at 5 g/100 mL at several high hydrostatic pressures: 0M Pa (A0 and L0), 100 MPa (A100 and L100), 200 MPa (A200 and L200), 400 MPa (A400 and L400), and 600 MPa (A600 and L600). Changes in storage modulus (G?) (A, C) and phase angle (?) (B, D).
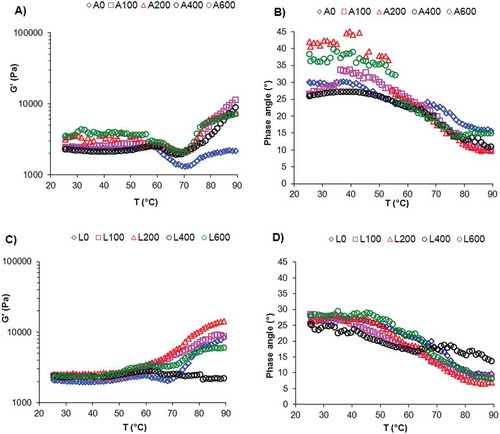
At stage one, from 25 to 55°C, all samples of lots A and L exhibited a similar thermal response, G’ moduli exhibited a plateau zone up to ~55°C () and phase angle (δ < 45°) remained practically constant up to 55°C () maintaining the gel-like behaviour in both A and L lots up to 55°C. This plateau zone shows the specific thermostability of GM at 5 g/100 mL, (up to 55°C) because the thermal–neutral balance of ionic and van der Waals interactions and hydrogen bonding resulting in constant G’ values up to 55°C ().
At stage two, however, from 55°C to 90°C, notable differences were found in thermal profiles in the control samples (A0 and L0). In both A0 and L0, G’ moduli were at a minimum at ~70°C but for the A0 sample, G’ moduli were less temperature-dependent reaching similar values at ~90°C than at ~25°C (). However, in the L0 sample at T > 70°C, G’ moduli increased up to 90°C indicating that when GM chains were weakly deacetylated a hardening process by hydrophobic interactions was induced by heating (). As hydrophobic interactions are an entropic effect induced mainly by water molecules,[Citation21] the greater viscous component in L0 compared with A0 could explain the role of water to reinforce the hydrophobic aggregation to reduce the amount of interfacial area exposed.[Citation21] Then, this effect could account for the gelation process observed between 70 and 90°C with a continuous increase of G’ for L0 () and simultaneously a greater decrease of the phase angle (δ) in L0 up to 90°C () compared with the A0 sample (). Hence, in temperature range 70–90°C at L0 was a thermo-responsive hydrogel showing more negative volume–phase transition [Citation21] because greater GM–GM associations than those of A0, resulting in a hydrogel (L0) with more versatile properties. [Citation22]
Concerning the pressurized samples at T > 55°C, the thermal profiles of A100–A600 were similar showing a weak minimum at T ~ 70°C, and from T > 70°C some structural reinforcement was observed as temperature increased resulting in an increase of G’ moduli up to 90°C (A100–A600) relative to A0 () and a corresponding decrease of δ () indicating an improvement in the junction structure [Citation20] and an increase in the degree of crosslinking at high temperature. [Citation23] Thus, native pressurized GM samples (A100–A600) became thermophobic hydrogels at 75–90°C range, exhibiting negative volume–phase transition.[Citation21] This could be the result of pressure reducing free volume in the GM matrix and offsetting the steric hindrance of acetyl groups (lot A) promoting new molecular attractions, mainly by hydrophobic interactions, increasing the elastic nature and the rigidity of the GM matrix [Citation24] up to 90°C. Samples of lot L, specifically L100, L200, and L600 followed a similar thermal pattern to the control (L0), except L400 sample whose G’ values remained practically constant up to 90°C (), resulting in greater δ values at the end of heating (). This result indicates that 400 MPa of pressure eliminated practically the thermo-responsive nature of slightly deacetylated GM hydrogel (L400).
Conclusion
Lower (100 MPa) and higher (400–600 MPa) HHP levels had similar positive effects on the conformational stability and flexibility of native GM gels at 5 g/100 mL and also the structure of the GM matrix was improved as was evidenced in the greater energy content of the intermolecular hydrogen bonds resulting in a higher solid-like character without change the number and size of the junction zones. However, when GM was slightly deacetylated using 0.6 mol/L KOH at 1.5 mL/100 mL, only a partial improvement was observed in the network at the highest pressure (600 MPa), particularly in the greater energy stability of physical junctions (inter- and intra-molecular hydrogen bonds in the GM matrix) as was detected in the FT-IR spectra, maintaining a similar consistency and deformability than in unpressurized gel network. Native pressurized GM samples became thermophobic hydrogels at temperatures over 70°C comparing with the control sample which behaved as no thermo-responsive hydrogel. However, when GM was only slightly deacetylated, the pressurized samples maintained a similar thermophobic pattern than in control sample.
Additional information
Funding
References
- Solo-de-Zaldívar, B.; Tovar, C. A.; Borderías, A. J.; Pasteurization, H. B. Chilled Storage of Restructured Fish Muscle Products Based on Glucomannan Gelation. Food Hydrocolloids 2015, 43, 418–426.
- Herranz, B.; Borderias, A. J.; Solas, M. T.; Tovar, C. A. Influence of Measurement Temperature on the Rheological and Microstructural Properties of Glucomannan Gels with Different Thermal Histories. Food Research International 2012, 48, 885–892.
- Solo-de-Zaldívar, B.; Tovar, C. A.; Borderías, A. J.; Herranz, B. Effect of Deacetylation on the Glucomannan Gelation Process for Making Restructured Seafood Products. Food Hydrocolloids 2014, 35, 59–68.
- Herranz, B.; Tovar, C. A.; Solo-de-Zaldívar, B.; Borderias, A. J. Influence of Alkali and Temperature on Glucomannan Gels at High Concentration. LWT- Food Science and Technology 2013, 51, 500–506.
- Stolt, M.; Oinonnen, S.; Autio, K. Effect of High Pressure on the Physical Properties of Barley Starch. International Journal of Food Science and Technology 2001, 1, 167–175.
- Moreno, H. M.; Herranz, B.; Borderías, A. J.; Tovar, C. A. Effect of High Pressure Treatment on the Structural, Mechanical and Rheological Properties of Glucomannan Gels. Food Hydrocolloids 2016, 60, 437–444.
- Larson, R. G.;. The Structure and Rheology of Complex Fluids; Oxford University Press: New York, USA, 1999; 61.
- Official, A. O. A. C.;. Method of Analysis, 17th; Association of Official Analytical Chemists: Maryland, USA, 2000.
- Wilkson, R. H.; Slack, P. T.; Appleton, G. P.; Sun, L.; Belton, P. S. Determination of the Fruit Content of Jam Using Fourier Transform Infrared Spectroscopy. Food Chemistry 1993, 47, 303–308.
- Li, X.; Jiang, F.; Ni, X.; Yan, W.; Fang, Y.; Corke, H.; Xiao, M. Preparation and Characterization of Konjac Glucomannan and Ethyl Cellulose Blend Films. Food Hydrocolloids 2015, 44, 229–236.
- Wang, S.; Zhou, B.; Wang, Y.; Li, B. Preparation and Characterization of Konjac Glucomannan Microcrystals through Acid Hydrolysis. Food Research International 2015, 67, 111–116.
- Jin, W.; Song, R.; Xu, W.; Wang, Y.; Li, J.; Shah, B. R.; Li, Y.; Li, B. Analysis of Deacetylated Konjac Glucomannan and Xanthan Gum Phase Separation by Film Forming. Food Hydrocolloids 2015, 48, 320–326.
- Pai, P. G.; Chao, S. S.; Takagi, Y.; Lucovsky, G. Infrared Spectroscopic Study of SiOx Films Produced by Plasma Enhanced Chemical Vapour Deposition. Journal of Vacuum Science and Technology A 1986, 4, 689–694.
- Hydrogen, K. T.;. Bonds in Cellulose and Cellulose Derivatives. In Polysaccharides Structural Diversity and Functional Versatility; Dumitriu, S.; Ed.; Marcel Dekker Inc.: New York, 2005; 69–98.
- Sun, Q.; Li, G.; Dai, L.; Ji, N.; Xiong, L. Green Preparation and Characterisation of Waxy Maize Starch Nanoparticles through Enzymolysis and Recrystallisation. Food Chemistry 2014, 162, 223–228.
- Mezger, T. G.;. The Rheology Handbook; Vicentz Network: Hannover, Germany, 2006; 114.
- Steffe, J. F. Rheological Methods in Food Process Engineering; Freeman Press: East Lansing, USA, 1996; 294.
- Durand, D.; Bertrand, C.; Busnel, J. P.; Emery, J. R.; Axelos, M. A. V.; Thibault, J. F.; Lefebvre, J.; Doublier, J. L.; Clark, A.; Lips, A. Physical Gelation Induced by Ionic Complexation: Pectin-Calcium Systems. In Physical Networks-Polymers and Gels;; Burchard, W., Ross-Murphy, S. B.; Eds.; Elsevier Science Publishing Inc.: London, 1990; 283–300.
- Lefebvre, J.; Doublier, J. L. Rheological Behavior of Polysaccharides Aqueous Systems. In Polysaccharides Structural Diversity and Functional Versatility; Dumitriu, S.; Ed.; Marcel Dekker: New York, 2005; 357–394.
- Moreno, H. M.; Bargiela, V.; Tovar, C. A.; Cando, D.; Borderías, A. J.; Herranz, B. High Pressure Applied to Frozen Flying Fish (Parexocoetus Brachyterus) Surimi: Effect on Physicochemical and Rheological Properties of Gels. Food Hydrocolloids 2015, 48, 127–134.
- Mah, E.; Ghosh, R. Thermo-Responsive Hydrogels for Stimuli-Responsive Membranes. Processes 2013, doi:10.3390/pr1030238.
- Qiu, Y.; Park, K. Environment-Sensitive Hydrogels for Drug Delivery. Advanced Drug Delivery Reviews 2001, 53, 321–339.
- Clark, A. H.; Ross-Murphy, S. B.; Nishinari, K.; Watase, M. Shear Modulus-Concentration Relationships for Biopolymer Gels. Comparison of Independent and Cooperative Crosslink Descriptions. In Physical Networks Polymers and Gels; Burchard, W., Ross-Murphy, S. B.; Eds.; Elsevier Science Publishing Inc.: London, 1990; 209–229.
- Sperling, L. H.;. Introduction to Physical Polymer Science; John Wiley: New York, USA, 2001; 63.