
ABSTRACT
Proteins from defatted flour winged bean seed (Psophocarpus tetragonolobus) were sequentially fractionated with reference to soybean seed (Glycine max) using distilled water, 25 g/kg sodium chloride solution, 0.1 M NaOH, and 70% alcohol and subjected to physicochemical, functional, and structural analysis. Winged bean seed had globulin (31.94%) and albumin (26.46%), with denaturation temperatures (Td) of 92.82 and 82.76°C, and surface hydrophobicities (SHs) of 214.51 and 189.32, respectively, whereas soybean seed had 34.95% globulin and 32.82% albumin, with respective Td of 81.68 and 90.63°C, and SH of 210.80 and 204.66. This indicates that winged bean albumin could perform better at water/oil interface in an oil-in-water emulsion system because of it higher hydrophobicity, although soybean albumin had higher extraction rate. Both legumes’ proteins showed comparable gelation when employed for their gelling ability to form three-dimensional network in food systems. Soybean proteins had significantly (P < 0.05) higher foaming capacities, but winged bean proteins foams were more stable and soluble over broad pH, good for manufacture of ice cream and protein beverages, respectively. Though β-sheets and β-turns were the major secondary structures of both protein fractions, soybean albumin had significantly (P < 0.05) higher β-sheets than winged bean albumin, whereas winged bean globulin and glutelin had higher content of β-sheets than corresponding soybean fractions. The low amounts of β-sheets in the winged bean albumin and soybean globulin could render them more digestible than the corresponding soybean and winged bean protein fractions.
Abbreviations: WB: Winged bean; SB: soybean; Td: denaturation temperature; SH: surface hydrophobicity; SH: surface hydrophobicity; W-ALB: winged bean albumin; W-GLO: winged bean globulin; W-GLU: winged bean glutelin; W-PRO: winged bean prolamin; W-ISO: winged bean isolate; S-ALB: soy albumin; S-GLO: soy globulin; S-GLU: glutelin; S-ISO: soy glutelin and S-PRO: soy prolamin.
Introduction
Winged bean (Psophocarpus tetragonolobus L.) is a nonconventional legume crop that is similar to soybean in lipids and proteins content, but with added advantage of nutritious young leaves, flowers, young pods, and edible tubers.[Citation1,Citation2] It is characterized by tuberous roots and winged pods that offer additional proteins apart from its rich nutritive similarity with soybean. In Indonesia and some East Asian countries, the dry seeds are made into a fermented food product “tampeh,” whereas the tubers are roasted and marketed as snacks in Papua and Myanmar. The immature pods are popular as specialty vegetables in most South East Asian countries, including Malaysia, Sri Lanka, and parts of India and China. The proteins of winged bean seeds are good providers of leusine, tyrosine, arginine, glutamic acids, isoleucine, and lysine,[Citation3,Citation4] and rich sources of bioactive peptides and functional proteolysates.[Citation3–Citation5] However, despite the nutritive value of the winged bean seeds, little information is available for effective utilization as food and/or functional ingredient.
Recently, the use of plant proteins in food is gaining the interest of many researchers probably due to their dual roles as providers of essential nutrients and as functional ingredients that can interact with other food components to impart some textural properties. Thus, several protein fractions, albumin, globulin, and the protein isolates of many legumes such as kidney bean,[Citation6] buckwheat (Fagopyrum esculentum Moench) seeds,[Citation7] Bitter melon seed,[Citation8] Lupin,[Citation9] bambaranut,[Citation10] and chickpea[Citation11] have been investigated and reported for promising functional roles in food systems. Soy proteins, for example, has gained immense use in foods due to their unparalleled functional properties in foods[Citation12,Citation13] and has become a reference material for evaluating new protein ingredients.[Citation13] Physicochemical properties of a protein contemplated for use as food ingredient are essential in food processing and plant design as they later translate into functional properties in real food system that define the food’s textural characteristics.[Citation14] Previous studies on winged bean proteins dwelt on the flour and/or isolates[Citation15,Citation16] and the concentrates.[Citation17,Citation18] Information on the functional and structural properties of winged bean protein fractions such as albumins and globulins are scanty for their possible use as functional ingredients despite the growing consumption of winged bean in many countries around the world.[Citation1] Previous studies on the proteins fractions of some nonconventional legumes showed potential use as food ingredients.[Citation6,Citation19–Citation21] In the present study, albumin, globulin, glutelin, and prolamin protein fractions of winged bean were obtained following Osborne[Citation22] sequential fractionation along with those of soybean and compared for their physicochemical, structural, and functional properties to provide insight for possible food application.
Materials and methods
Materials
Winged bean seeds of 2013 harvest were obtained from Malaysia Agricultural Research and Development Institute (MARDI). The winged bean seeds (AKIN-0199 dark-brown in colour) and (ACC-183 milk in colour) were accessions from Indonesia and developed as breeder seed at University of Southampton, UK. Field multiplication was carried out at MARDI in 1984/1985, and the AKIN-0199 was selected based on its agronomic properties and potential for commercial production in Malaysia (Mohammed Selamat B. Madom PhD, former Director, Malaysian Agricultural and Research Development Institute, MARDI, pers. Comm., May 7, 2014). Soybean seeds were purchased from Giant hypermarket, Serdang, Malaysia. HPLC grade solvents were purchased from Fisher (Fisher Scientific, Pittsburgh, PA, USA); 1-anilino-8-naphthalene sulphonate (ANS) was purchased from Sigma (Sigma Chemical Co. St. Louis, MO, USA). All other reagents were of analytical grade purchased from Fisher Scientific or Sigma Aldrich.
Methods
Physicochemical properties
Extraction of water, NaCl, NaOH, and ethanol soluble proteins
Winged bean and soybean seeds were manually cleaned, dehulled, ground using variable speed rotor (Pulveristte-14, Fritsch, GmbH, Kitzingen, Germany) and passed through 500 µm test sieve (ASTM Grade) to yield 0.5 mm particle size flour. Flours were defatted with n-hexane and the meal dried under hood and stored in sealed plastic bags at ≤4°C until used. Following Osborne[Citation22] sequential extraction, 100 g defatted flour was suspended in 600 mL distilled water and extracted at room temperature (~25°C) for 2 h on a magnetic stirrer (Cimarec™ Digital Stirring Hotplates, Thermo Scientific), rested for 30 min, and then centrifuged (Multifuge-3L, Thermo Electric Corp. Germany) at 3500×g for 10 min. The supernatant was decanted and the residue extracted with 600 mL of 25 g/kg NaCl for 2 h to yield globulin extract. Resulting residue was further extracted with 600 mL of 0.1 M/L1 NaOH (adjusted to pH 9.0), then followed with 70% ethanol extraction for 2 h each to obtain glutelin and prolamin fractions, respectively. Corresponding supernatants were pooled and precipitated at their isoelectric points (pH) of 4.0, 3.5, and 5.2 (determined earlier: Isoelectric-points precipitation of the seeds proteins) and centrifuged to yield albumin, globulin, and glutelin fractions, respectively. Prolamin was precipitated by adding threefold acetone. Precipitated proteins were washed twice with distilled water, neutralized, lyophilized at −40°C, then stored below 4°C until analysis.
Isoelectric-points precipitation of the seeds proteins
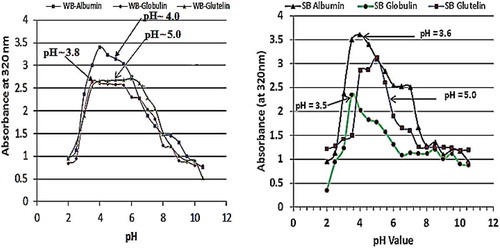
To determine the isoelectric points, 5 mL of each supernatant was diluted and the pH adjusted to values between 2.0 and 11.0 using 0.5 N NaOH or HCl. The turbidity of each supernatant was then read with a spectrophotometer (Perkin Elmer, Lambda-25, Shelton, USA) at 320 nm. The pH value (dilution) that gave the maximum turbidity (i.e., maximum absorbance) was taken as the isoelectric point of that fraction and was used for subsequent extraction and analyses ().
Figure 1. Isoelectric points values of albumin, globulin, glutelin, and prolamin of winged bean and soybean seeds proteins obtained by determination of their turbidity at 320 nm. The UV-Vis absorption of winged bean albumin, globulin, glutelin and prolamin showing their isoelectric point (pI) pH. The turbidity of the protein solution at pH values between 1 and 11 was scanned at 320 nm with UV spectrophotometer and the solution concentration that absorbed the highest wavelength was taken as the pI of that proteins.
Bulk density
Bulk density of the proteins was determined according to Wani et al.[Citation23] by filling a previously weighted (W1) graduated glass tube with finely ground protein samples (0.5 mm particle size) and tapped gently to 10 mL mark until no further diminution of the particles. The tube (with the flour) was weighed again (W2) and from the difference in weight (W2 − W1), the bulk density of the proteins was calculated and expressed as grams per centimetre cube (g/cm3) assuming 1 cm3 = 1 mL.
Colour
Uniformly sized (0.5 mm) protein sample contained in a transparent glass cuvette was placed in a colorimeter (UltraScan Pro 1092, USA) previously standardized with black and white tiles and equipped with a tri-stimulus software (EasyMatch QC) (Wani, Sogi and Gill).[Citation23] Determinations were carried out three times and results reported as means and standard deviations. Total colour was calculated as shown in the equation below:
L* (0–100) scale denotes from dark (0–24) to bright (24–100); a* denotes redness (+) to greenness (−); and b* denotes yellowness (+) to blueness (−); ΔE denotes colour difference.
Sodium dodecyl sulphate–polyacrylamide gel electrophoresis of protein fractions
Molecular size was determined by sodium dodecyl sulphate–polyacrylamide gel electrophoresis (SDS–PAGE) according to Laemmli.[Citation25] The SDS–PAGE was carried out on a Mini Precast Gel slab 10 wells (4% stacking gel, 12% separating gel) in an SDS–Tris–glycine discontinuous buffer system. Freeze-dried proteins (earlier extracted in the section: Extraction of water, NaCl, NaOH and ethanol soluble proteins) were prepared (2 μg protein/μL) in nonreducing buffer solution (62.5 mM Tris–HCl pH 6.8, 10% SDS, 10% glycerol, 0.05% bromophenol blue) and heated at 95°C for 50 s. After centrifugation, approximately 15 μL of the supernatant was loaded onto the gel and run at 180 V and 45 mA per gel for approximately 50 min. Gels were stained with BioSafe-250 Coomassie (BioRad Laboratories, Hercules, USA) and destained several times in deionized water contained in a water bath shaking at 100 rpm for 1 h. Approximate molecular sizes of the proteins were determined reference to a broad range molecular weight (MW) marker consisting of 12 proteins in the range of 10–260 kDa (Fermentas, Thermo Scientific).
Protein contents of the fractions
Protein content was determined by an automatic Kjeldahl unit (Foss Tecator, Hoganas, Sweden) according to manufacturer’s instruction following method 976.05 of the AOAC.[Citation26] Based on the amount and protein content (using a factor of 6.25) of the fractions obtained, yield of each was calculated as follows: yield (g/100 g) = weight of fraction × % protein of fraction × 100/weight of seed flour × Х % protein of seed flour.[Citation8]
Thermal properties of the protein fractions by differential scanning calorimetry
The thermal properties of the proteins were determined using a differential scanning calorimetry (Mettler-Toledo, Model 823e, GmbH, Germany) equipped with a thermal data station software (Star Software Version 9.0 Mettler Toledo). Known weights (23–25 mg) of protein samples suspended in 0.01 M phosphate buffer (pH 7.0) were placed in 40 µL aluminium pans (ME-26763) previously equilibrated to 24°C and scanned from 25 to 180°C at 10°C/min. Onset and denaturation temperatures and enthalpy of denaturation were computed automatically from each thermogram. Determinations were conducted in triplicates and results reported as means and standard deviation.
Functional properties
Solubility was determined as a function of pH using the method of Were et al.[Citation27] by centrifuging a 0.5% protein solution (pH 1–11) at 12,000 × g (HERMLE, Z 200A, Labortechnik, GmBH, Germany) for 20 min, filtered, and the supernatant analysed for protein content using Bradford[Citation28] method with bovine serum albumin as standard. Foaming properties were obtained according to Coffmann and Garcia.[Citation29] Protein dispersions (1%) were homogenized at 10,000 rpm (Silent Crusher, M-Heidolph, Schwabach, Germany) for 2 min, measured the foam heights and observed for stability (60 min). Minimum gelation concentration was found following O’Kane et al.[Citation30] method wherein protein suspensions (6–18%) in test tubes were heated in water bath at 95°C, chilled (4°C) for 24 h, and inverted to observe flow. To determine emulsifying capacity (EC), 5 mL protein (1%) was homogenized together with 5 mL soy oil (Daisy, Lam Soon, Malaysia) at 10,000 rpm for 30 s, allowed 30 min rest, centrifuged at 1000 for 5 min and the height of the emulsified layer (mL) was measured relative to the total height. The emulsions were then heated at 80°C for 30 min, observed for stability, and reported results as emulsion stability (ES).[Citation31] Water absorption and oil absorption capacities were determined following Beuchat[Citation32] method in which 1 g of lyophilized protein was suspended in 10 mL distilled water or vegetable oil (Daisy, Lam Soon, Malaysia) and stirred using magnetic stirrer for 30 min, rested for 1 h, and centrifuged (Hermle, Z 200 A, Labortechnik, GmBH, Germany) at 10,000 × g for 5 min. The volume of the supernatant was noted and result expressed as water absorption capacity (WAC) or oil absorption capacity (OAC).
Surface hydrophobic properties of the protein fractions
The surface hydrophobicity (SH) of the proteins was determined as described by Ref. [Citation33] with minor modification.[Citation8] Protein solutions (1%) in 0.01 M phosphate buffer (pH 7.0) were serially diluted to 0.02%, 0.01%, 0.005%, 0.0025%, and 0.00125% concentrations. An aliquot (10 µL) of 8 mM ANS was added to 4 mL of the protein solutions and the fluorescence intensity of the protein–ANS complex measured with a spectrophotometer (Lambda-25, Perkin Elmer, Shelton, USA) after incubation in the dark for about 5 min at excitation and emission wavelengths of 300 and 470 nm. The index of protein hydrophobicity was taken as the slope of the protein–ANS conjugate fluorescence intensity versus protein concentration (%) calculated by linear regression.
FT-IR spectroscopic analysis
Molecular spectroscopy of protein secondary structure
Spectral data of the proteins were collected using FT-IR spectrophotometer (SPECTRUM-100, Perkin Elmer) fitted with universal attenuated total reflectance sampling accessory at the Department of Chemistry, Universiti Putra Malaysia. Bands spectra were acquired within the mid-IR range (4000–800 cm−1) at a resolution of 2 cm−1 with 32 scans and corrected for background absorbance by subtraction of the empty ATR crystal spectrum. Water vapour absorption was avoided by using deuterated water. The Germanium crystal was lined with parafilm and cleaned between runs using deionized water and 50% ethanol solution in sequence for 5 min and dried spectra acquired three times.
Spectral manipulation and analysis
The spectral data were processed by baseline correction and the peak label normalized within the amide I region using GRAMS AI Suite software (Thermo Scientific). Analysis covered the wavenumber 800–4000 cm−1 where significant absorption lies with focus mainly on the representative amide I region, . Water vapour subtraction was carried out purposively in the region 1800–1400 cm−1 and straight baseline obtained.
Figure 2. SDS–polyacrylamide gel electrophoresis of winged bean protein fractions. W-ALB (B), W-GLO (C), W-GLU (D), W-PRO (E) and soybean protein fractions: S-ALB (F), S-GLO (G), S-GLU (H) and S-PRO (I). A is molecular weight marker (standard). The proteins were heated at 95 oC for 50 sec and run under non-reducing conditions for 50 min.
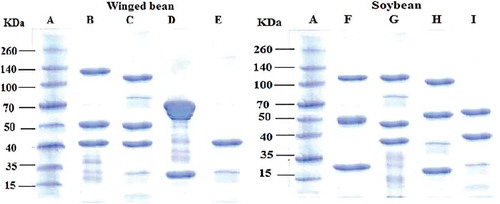
Figure 3. Showing protein solubility profiles of (a) winged bean and (b) soybean protein fractions as function of pH. Protein solubility profiles of (a) winged bean and (b) soybean protein fractions as function of pH obtained by centrifugation (12,000 x g/20 min) of the protein dispersions and determining the protein content of the supernatant using BSA as standard.
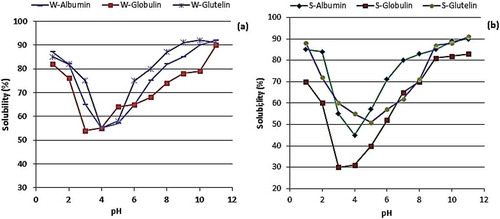
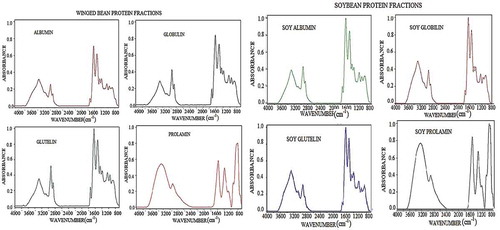
Figure 4. The Fourier transform infra-red (FT-IR) spectroscopy spectral data of winged bean and soybean proteins fractions acquired using FT-IR spectrometer. The spectral data covered the wavenumber range from 800 to 4000 cm−1 where significant absorption lies with focus mainly on the representative amide I region and the fingerprint areas.
Second derivative spectral deconvolution and curve-fitting
The amide I region was truncated at 1700 and 1600 cm−1 and the linear baseline subtracted to zero the ends of the spectrum. Second derivative function was obtained with Savitzky–Golay derivative function at 17 smoothing points of the original spectra. Fourier self deconvolution was carried out on the second derivative function of the amide I region (1600–1700 cm−1) followed by curve-fitting to yield detailed information on the secondary structures of the protein fractions ( and ). The secondary structure of the protein fractions was similarly estimated from the relative proportion of curve-fitted peaks of each secondary structure and expressed as percentages.
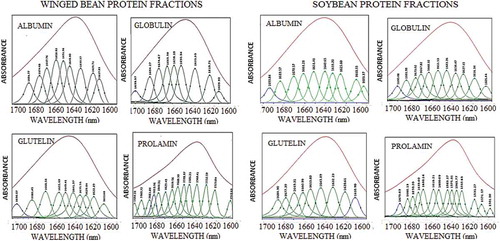
Figure 5. The second derivative function of the amide I absorption region (1600–1700 cm−1) of the winged bean and soybean albumin, globulin, glutelin, and prolamin protein fractions. Spectral region from 4000 to 800 cm−1 was considered for the analysis (this figure) and the amide I region was isolated by truncating the spectrum at 1700 and 1600 cm−1 () followed by subtraction of the linear baseline to zero the ends of the spectrum.
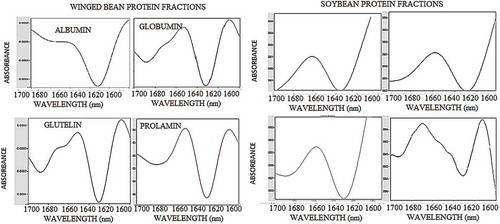
Figure 6. Fourier self-deconvoluted (FSD) curve-fitted spectra (Gaussian–Lorentzian) of the second derivative functions of the spectra of winged bean and soybean albumin, globulin, glutelin, and prolamin protein fractions acquired using FT-IR processed by Fourier self deconvolution and band narrowing techniques within the region 1600–1700 cm−1. The amide I absorption region (1600–1700 cm−1) was first truncated and the second derivative function of the region obtained using GRAM/A1 software (Thermos). The wavelength region was then Fourier self-deconvoluted and curve-fitted to disband and expose overlapped band features.
Statistical analysis
Data were analysed by one-way ANOVA function of Minitab software (V.16 USA). Multiple comparison of means (were applicable) was carried out using Tukey’s HSD procedure at 5% level of significance and results presented as mean and standard deviation.
Results and discussion
Protein extractions
Extraction and isoelectric precipitation of protein fractions
The average protein content (N × 6.25) of the raw winged bean seeds was 38.31% and increased to 51.80% after hexane extraction of the lipids. The winged bean albumin, globulin, and glutelin fractions had their pI at pH 4.0, 3.5, and 5.0, whereas the corresponding soybean fractions had 3.6, 3.5, and 5.0, respectively, . At these respective isoelectric points, the proteins were precipitated and recovered by centrifugation from the supernatants to yield the respective fractions.
Extraction rate, yield, and protein contents of fractions
As shown in , winged bean seed contains 26.46% albumin (W-ALB), 31.94% globulin (W-GLO), 12.59% glutelin (W-GLU), and 4.05% prolamin (W-PRO), making a total 75.04% extractable and 24.96% non-extractable proteins from the defatted flour. SB had 84.22% extraction comprising 32.82% albumin (S-ALB), 34.95% globulin (S-GLO), 12.45% glutelin (S-GLU), and 4% prolamin (S-PRO). The yield of extraction of S-ALB and S-GLO was significantly (P < 0.05) higher than the corresponding winged bean fractions. With the exception of the glutelin and prolamin fractions, the extraction rates were significantly (P < 0.05) different. The respective protein contents of the W-ALB, W-GLO, W-GLU, and W-PRO were 76.28%, 80.42%, 77.45%, and 77.89%, respectively, whereas S-ALB, S-GLO, S-GLU, and S-PRO had 82.84%, 77.96%, 83.79%, and 84.90% protein content, respectively. The differences in the extraction rates of protein fraction of the two legumes could be attributed to differences in the isoelectric points (pI) of the various proteins, as shown in . Earlier, Okezie and Bello[Citation16] reported extraction rate of 90% and 80% for winged bean isolate extracted at pH 10 and pH 12, respectively. Protein isolated consisted of many fractions and it is expected that the extraction will be higher than any of the fractions alone; however, the functional properties of protein extracted at higher pH may be impaired. Withana-Gamage, Wanasundara, Pietrasik, and Shand[Citation11] reported protein contents between 72.8% and 85.3% for chickpea (Cicer arietinum L.) seeds isolate. Extraction rates of 49.3%, 29.3%, and 3.1% have been reported for bitter melon seed albumin, globulin, and glutelin, respectively.[Citation8] This indicates that the albumins and globulins are the major proteins in both winged bean and soybean seeds, while glutelin and, to a lesser extent, prolamins represent minor fractions as reported for kidney bean proteins.[Citation6] Similarly, da Silva et al.[Citation34] reported extraction rates of 41.79% globulin, 16.18% albumin, 9.99% glutelin, and 0.48% prolamin proteins from chickpea.
Table 1. Physicochemical properties of winged bean and soybean seeds proteins.
Bulk density
As shown in , bulk density of WB proteins ranged from 0.41 to 0.78 g/mL. W-GLU showed significantly (P < 0.05) highest bulk density among the winged bean proteins, whereas W-ALB had the lowest. Bulk density of soybean proteins ranged from 0.49 to 0.79 g/cm3 for S-GLO and S-ALB, respectively. Except for W-GLU and S-ALB, all other fractions recorded significant (P < 0.05) differences. These values were much higher than values (0.27 g/mL) reported for safflower protein isolate.[Citation35] Proteins with higher bulk density are usually associated with a slower water uptake resulting in longer cooking time undesirable and uneconomical in food processing operations;[Citation36,Citation37] however, in merchandise, product with high bulk density commands premium price . Thus, W-ALB and W-GLO with their low bulk densities will find better application than S-ALB and S-GLO in food processing operations that usually involves high energy expenditure.
Colour
Colour is a quality factor that is usually employed in finished product acceptability. The colour characteristics of the winged bean and soybean proteins are presented in . The brightness (L*) values varied significantly (P < 0.05) between W-ALB (72.24), W-GLO (67.63), and W-GLU (66.45). Similarly, the respective L* values of 66.26, 77.24, and 56.94 for S-ALB, S-GLO, and S-GLU varied significantly (P < 0.05). Colour values of a* [redness (+)/greenness (−)] and b* [blueness (−) and yellowness (+) colour] of WB and SB proteins varied from 3.00 to 3.29 and 15.32 to 16.58, and from 1.69 to 3.32 and 11.14 to 15.89, respectively. Among WB proteins, W-ALB had the highest L* and ΔE* value of 72.24 and 79.81, respectively, indicating lighter, yellowish colour, whereas W-GLU had least L* and ΔE* values of 66.45 and 75.21, an indication of darker, yellowish colour. For SB proteins, S-GLO had higher L* (77.24) and ΔE* (83.21) but lowest a* (1.69) and consequently the highest ΔE* value making it the lighter yellowish of all the proteins. These L*, a*, and b* values are in consonant with values of 54.96–76.60, 1.31–4.08, and 11.06–14.68, respectively, reported by Wani, Sogi, and Gill.[Citation23] These observed differences in the colour characteristics of both legume protein fractions could be attributed to differences in coloured pigments in their seed coats. The winged bean seed is dark-brown in colour distinct from the cream colour exhibited by the soybean seeds. During seed preparation to remove the seed coats, it is possible some water soluble pigments in the winged bean seed coats had move into the cotyledons because of the tightly bound nature of the seed coats to the cotyledons, as observed in this study. Colour characteristic of foods is an important sensory attribute that confers the initial product appeal and convinces the prospective buyer.
Molecular size of the protein fractions
The molecular sizes of W-ALB, W-GLO, W-GLU, and W-PRO analysed using SDS–PAGE under nonreducing condition showed that W-ALB and W-GLO had MW between 140 and 40 kDa (). In W-ALB, approximately three major bands (40 to ~140 kDa) were observed, three bands (15 to ~135 kDa) in W-GLO, two (20 to ~70 kDa) in W-GLU, and one peptide band of MW ~40 kDa in W-PRO, indicating the presence of 7S β-conglycinin chain in the latter.[Citation38] In addition, minor bands representing low MW polypeptides were also observed in W-ALB, and in W-GLO minor bands both in the low and high MWs regions, indicating presence of 7S vicilin-type polypeptide (43 and 45 kDa) in both proteins.[Citation39] In the S-ALB, estimated MW of ~120, 50, and ~27 kDa formed the major peptides. In S-GLO, however, high (~120 kDa) and low (~48 and 38 kDa) MW peptides along with multiple minor bands appearing as smear bands made up the protein. S-GLU consisted of closely related MW peptides as S-GLO with major bands at ~25, ~60, and ~115 kDa, indicating the presence of 7S vicilin polypeptide.[Citation39] These molecular sizes have fewer bands within wide range in comparison to the molecular size profiles of wheat or rice protein fractions. For example, the albumin, globulin, and glutelin fractions of wheat protein have 19 (14–84 kDa), more than 7 (14–55 kDa), and 5 (range from 14–39 kDa) bands, respectively,[Citation40] while rice protein fractions contain 6 (15–56 kDa), 6 (14–55 kDa), and 4 (16–39 kDa) polypeptide bands, respectively, for albumin, globulin, and glutelin.[Citation41] Mundi and Aluko[Citation6] studied the MW of albumin and globulin fractions and reported MW of 27 kDa and two major polypeptides (7S vicilin) of MW of ~43 and 45 kDa and three minor low MW (<25 kDa), for the albumin and the globulin, respectively.
Thermal properties
Thermal properties of the protein fractions provide information about their conformational changes with temperature of denaturation. As shown in , W-ALB, W-GLO, W-GLU, and W-PRO had their thermal denaturation (Td) at 82.76, 92.82, 91.67, and 92.43°C, respectively, varying significantly (P < 0.05) between all the fractions. Similarly, S-ALB, S-GLO, S-GLU, and S-PRO proteins had Td of 90.62, 81.68, 83.05, and 80.75°C, respectively. The Td of S-ALB (90.62°C), S-GLO (81.68°C), and S-GLU (83.05°C) showed significant (P < 0.05) variation. These Td were comparably lower than values observed for bitter melon seed albumin, globulin, and glutelin, 111.9, 117.3, and 133.6°C,[Citation8] but higher than albumin (73.3°C), globulin (78.9°C), and glutelin (82.2°C) of rice kernel.[Citation42] The enthalpy (ΔH) values of 1.29, 3.82, 4.19, and 4.18 J/g protein, respectively, for W-ALB, W-GLO, W-GLU, and W-PRO also varied significantly (P < 0.05), indicating varied amount of energy required to unfold (or denature) the proteins. These enthalpies were much lower than that reported for bitter melon seed albumin (9.2 J/g) and globulin (27.6 J/g) but comparable to that of the glutelin (1.9 J/g) proteins at P value <0.01.[Citation8] The ΔH values for W-GLU and S-GLU, 4.19 and 5.66 J/g, respectively, were higher than other fractions, due probably to changes in their conformations consequence of the extraction conditions employed, compared to ΔH values of 1.29 J/g and 2.36, respectively, for the water extracted W-ALB and S-ALB. Proteins in foods lose their native structural integrity due to processing and handling conditions such as storage, heat treatment, chemical modification including succinylation, microbial hydrolysis, acidification, dehydration, and/or mechanical processing including shearing.[Citation43,Citation44] Some of the problems in the use of protein as food ingredients are the loss of functionality and difficulties in re-solubilizing powdered proteins after the extraction and drying steps and possible caking of powdered proteins during handling and storage. Thus, information on conformation and denaturation properties of prepared food proteins could provide readily available data for predicting and monitoring the thermal behaviour in food systems.
Functional properties
pH-dependent solubility. The protein solubility (PS) properties as shown in indicate solubilization up to 95% at the high pH values. For all the proteins, generally, solubility was minimal at or around their isoelectric points. W-GLU showed highest solubility of 92% at pH 10, and minimum solubility of 58% observed at pH 4. W-GLO and W-ALB similarly had maximum solubilities of 90% and 92% both at pH 11, and minimum solubilities of 54% and 55% at pH 3 and pH 4, respectively. For all the protein fractions, solubility increased with rise in pH assuming a V-shaped curve with the lowest points around the isoelectric pHs, as reported by Horax et al.[Citation45] S-GLO had least solubility (30%) at pH 3 whereas S-ALB and S-GLU had their minimum (45% and 52%) and maximum (91% and 90%) solubilities at pH 4 and 5, and at pH 11, respectively. The lower PS of the globulin could be attributed to the low content of glycoprotein (3.9%) when compared to albumin (45% carbohydrate content) as reported for kidney bean protein fractions.[Citation6] Thus, the high solubility of albumin could be the result of interaction between the carbohydrate components with water. Additionally, the low solubility of the globulin fractions at the acidic pH range could also be due to its high isoelectric point as reported for buckwheat albumins.[Citation7] These values agree with reported solubility of soy isolate (90%) but higher than that of bitter melon protein isolate (65%) at pH 9.[Citation46] This shows that W-GLO and W-ALB are soluble over a wide pH range than any of the soybean fractions due probably to low hydrophobic amino acids. Minimum solubility of winged bean flour at pH 4.5[Citation15] and a winged bean isolate with high nitrogen dispersibilities (100%) have been reported.[Citation47] Narayana and Narasinga Rao,[Citation15] Horax, Hettiarachchy, Kannan, and Chen[Citation46] reported solubility of 62.0–67.5% and 86.7–90.1% for bitter melons seed and soybean isolates, respectively, at pH 7. Lawal et al.[Citation48] reported minimum solubility (56.7%) of African locust bean albumin and globulin at pH 5 and 4, respectively, whereas Mundi and Aluko[Citation6] reported solubility of 60% at pH 5 for Kidney bean albumin. The ability of protein to remain in solution over a broad pH range is a desirable property in the manufacture of protein beverages (as supplemental nutrition), yoghurt, and salad dressings.[Citation49,Citation50]
Foaming properties
As shown in , W-GLO showed significantly (P < 0.05) higher foaming capacity than the other winged bean fractions with a rise of 7.75% of the initial suspension, followed by W-ALB with 7.56% and W-GLU with 4.73%. Upon storage, W-GLO and W-ALB foams remained sparingly stable through the 60 min storage time, losing only 4.83 mL (37.68%) and 5.77 mL (23.77%), respectively, of the original foams. Within the SB proteins, S-GLU and S-GLO had the highest foaming capacity of 21.83% and 20.51%, respectively, dropping to 7.18% and 5.04% of the initial foams, least stable than WB protein fractions. Compared with the SB fractions that had better foaming capacity, WB proteins foams were more stable on storage. Foam instability results from the propensity of the foam to collapse due to disproportionate bubbles formed, water drainage, coalescence of bubbles due to weak interfacial surface films between bubbles, pH, and protein concentration.[Citation36] Proteins with good foaming capacity and stability could be valuable in the manufacture of cakes, whipped desserts, and ice cream.[Citation49] The high stability of winged bean proteins foams may be due to partial disassociation and denaturation of the protein structures that allowed greater electrostatic repulsions thus stabilizing the foams.[Citation24] Thus W-ALB and W-GLO could be better foaming agents in foods because of their ability to form stable dispersions that are essential in ice creams and whipped foods, a property that has been shown to improve in the presence of carbohydrates.[Citation18]
Table 2. Functional properties of the albumin, globulin, and glutelin of winged bean and soybean seeds.
Gelation properties
The minimum gelation capacity (MGC) of the winged bean proteins indicated good gel forming capacity (MGC of 14%) for each of W-ALB and W-GLO, and a better gelation capacity (MGC 12%) for S-GLO. None of the winged bean protein fractions forms gel at 12%, but at 14%, all the proteins formed weak gels that flow when the container is tilted gently. This shows that S-GLO has better gelation property, and at 14%, except W-GLU, all fractions formed gel, an indication of ability to network in food system. The MGC of the W-ALB, W-GLO, S-ALB, and S-GLU (14%) obtained in the present study were higher than the range of 8–10% reported for mucuna protein concentrates,[Citation51] 12% reported for lupine protein concentrate,[Citation9] and 6% reported for kidney bean globulin.[Citation6] Earlier, Okezie and Bello[Citation16] compared the gelation properties of winged bean and soybean isolates and reported MGC of 18% and 14%, respectively. The reduced gelling capacity (i.e., high MGC) of W-GLU, for example, could be due to low exposed hydrophobic residues and increased inter-electrostatic repulsion between protein molecules over the electrostatic attraction forces that bond molecular network as observed in buckwheat albumin[Citation7] and mucuna bean protein.[Citation52] In their study, Okezie and Bello[Citation16] showed that winged bean and soy isolates had least gelation concentration of 18% and 14%, respectively, an indication that the fractions have better gelation properties (i.e., form gels at low concentration) than the isolate form. The comparable gelling properties of both winged bean and soybean proteins could impart desirable gelating ability in food systems.
Water absorption (WAC) and oil absorption (OAC) capacities
The ability to imbibe water is a desirable property in many foods such as sausages, comminuted and pumped meats, and confectioneries as it increases product yields.[Citation49,Citation50] As presented in , W-ALB, W-GLO, and W-GLU had WAC of 2.10, 1.77, and 1.80 mL/g, respectively, with significant (P < 0.05) variation. S-ALB, S-GLO, and S-GLU, respectively, absorbed 2.10, 2.80, and 2.72 mL/g of water, with significant (P < 0.05) variation. Apart from the W-ALB and S-ALB each absorbing 2.10 mL/g, the other SB proteins had significantly (P < 0.05) higher WAC than the WB counterparts. The ranges (1.77–2.8 mL/g) of WAC were within ranges (2.34 and 4.31 g/g) reported for chickpea isolate.[Citation11] They were however lower than the range (5.5–6.7 mL/g) reported for Bambara nut isolate[Citation10] or 5.08 mL/g and 5.05 g/g for D lablab and Panotima angularis protein isolates, respectively, reported by Chau and Cheung.[Citation53] The high WAC of SB proteins could also be attributed to high hydrophilicity in the soy proteins than the WB proteins though the former showed higher hydrophobicity. This shows that high hydrophobicity of a protein may not necessarily mean low hydrophilic amino acids, and vice versa. The WAC of both legumes proteins, however, falls within range recommended for viscous foods.[Citation54] For oil absorption, the W-ALB showed significantly (P < 0.05) higher (2.8 mL/g) OAC than W-GLO (1.86 mL/g) and W-GLU (2.11 mL/g). Comparing the two, the OAC of S-ALB, S-GLO, and S-GLU did not differ significantly (P > 0.05) with those of corresponding winged bean fractions. Kaur and Singh[Citation55] reported OAC values of 2.08–3.96 g/g for kabuli chickpea isolate. Similarly, Mundi and Aluko[Citation6] had reported WAC and OAC of 3.4 and 2.37 mL/g and 2.56 and 1.87 mL/g, respectively, for Kidney bean globulin and albumin. W-ALB, because of its higher fat absorption (2.10 mL/g), can be employed as ingredients in meat, doughnuts, sausages, pumped meats, and dairy products where fat retention is desirable for textural properties.[Citation55]
Emulsifying properties
The EC of the WB proteins ranged from 5.00 mL for W-GLU to 5.30 mL for W-ALB, while their stability (ES) varied from 5.36 mL for W-ALB to 5.40 mL for W-GLU, . For SB proteins, S-ALB, S-GLO, and S-GLU had EC of 3.34, 3.57, and 4.52 mL, and corresponding ES of 3.50, 4.17, and 5.37 mL. Comparatively, the EC of winged bean proteins varied significantly (P > 0.05) from soybean fractions. Similarly, the ES of both fractions differed significantly (P > 0.05) in favour of winged bean fractions. Winged bean flour has shown higher emulsification capacity soy flour by about 30–60% under similar pH conditions.[Citation15] The relatively high EC and ES of the winged bean proteins could be linked to differences in the surface denaturation of the proteins on adsorption at interface. PS and SH properties are known to govern proteins adsorption and their overall emulsifying properties.[Citation56] Although both legumes showed relative SH and PS (range 185.57–252.64 and 83–95%) than the winged bean protein fractions (range 189.32–234.79 and 79–92%) as shown in , the higher EC of winged bean proteins could be due to changes in their conformation as they adsorb and diffuse at the water–oil interface due to surface denaturation and structural rearrangement with consequent increased hydrophobicity.[Citation57]
Table 3. Estimated secondary structures and emulsifying properties of winged bean and soybean proteins.
Surface hydrophobicity (SH)
The SHs of the WB and SB proteins as presented in showed significant (P < 0.05) differences between the fractions. W-ALB, W-GLO, and W-GLU have SH of 189.32, 214.51, and 197.43, respectively, different from corresponding SB fractions where S-ALB, S-GLO, and S-GLU had SH of 205.63, 209.56, and 185.89. Much higher hydrophobicity values of 390–570 and 640–643 have been reported for cowpea and soybeans isolates, respectively.[Citation58] The variation in the hydrophobicity of both legumes could be due to varietal and physiological differences. The level of hydrophobicity of a protein ingredient determines its droplets interfacial activity during emulsification and the stability of the emulsion system thus formed.[Citation57,Citation59,Citation60]
Proteins’ structural properties
Peak assignments of deconvolved amide I band and estimates of secondary structures
The proteins’ spectral data obtained using FT-IR and the second derivative of the amide I region (1600–1700 cm−1) are shown in and , respectively. This was followed by band deconvolution that revealed the proportion of each secondary structure making up each protein (). Thus, the relative proportion of the α-helix, β-sheets, β-turns, and unordered configurations of the protein fractions varied significantly (P < 0.05) in both legumes. The α-helix, β-sheet, β-turn, and unordered contents of W-ALB and S-GLU, W-ALB, W-GLO, and W-GLU consisted of α-helix, β-sheets, turns, and unordered secondary structures in varying amounts of 10.27%, 40.34%, 30.71%, and 20.55%; 14.52%, 36.35%, 36.65%, and 15.59%; and 18.27%, 45.23%, 18.80%, and 18.53%, respectively, as shown in . S-ALB, S-GLO, and S-GLU, on the other hand, composed of 11.42%, 55.63%, 22.49%, and 11.50%; 11.32%, 33.65%, 33.23%, and 22.74%; and 10.61%, 40.45%, 30.49%, and 20.29%, respectively. S-ALB and W-GLU had higher content of β-sheets 55.63% and 45.23%, whereas W-GLU and W-GLO had the highest contents of α-helix with 18.27% and 14.52%, respectively. Both legumes consisted of low (10.27–18.27%) α-helix but high β-sheets (33.35–55.63%) and β-turns (18.80–36.65%) components. High contents of β-sheets structures in globular proteins than the content of α-helix could confer more rigidity, making the α-type proteins more surface active than β-type,[Citation61] but could be useful in gelation.[Citation62] Similar values of 16.5% α-helix, 47.6% β-sheet, and 35.9% turn, and 17.0% α-helix, 47.3% β-sheet, and 35.8% turns, respectively, have been reported for 7S and 11S proteins of soy globulins.[Citation63] Chen, Ru, Chen, Wang, Zhao, and Ao[Citation12] also reported values of 11.6%, 32.8%, 44.3%, and 11.3%, respectively, for α-helix, β-sheet, β-turn, and unordered secondary structures of soy proteins, and values of 25.6–32.7% α-helices, 32.5–40.4% β-sheets, 13.8–18.9% turns, and 16.3–19.2% disordered structures reported for chickpea (C. arietinum L.) protein.[Citation11]
Conclusion
The potential use of plant proteins in food is premised on their physicochemical, thermal, and functional properties that compare favourably with those reported for important protein such as soy protein. The results obtained for the winged albumin and globulin, including the PS, WHC, foaming capacity and stability, emulsion capacity and stability compared favourably with those reported for most legume seeds, though the glutelin did not compared favourably to the albumin and globulin fractions in most functional properties, as well as gelation capacity. The significantly low content of β-sheets in soybean proteins could make them comparably more digestible than the corresponding winged bean fractions. Thus, the present study explored the potentials of winged bean seed as new source of protein ingredients for the food industry that can compete suitably with soybean proteins even as it surpassed the latter in some functional properties.
Conflict of interest
The authors declared no conflict of interest in any form.
LJFP_A_1369101_Supplementary_file_2.docx
Download MS Word (35.7 KB)LJFP_A_1369101_Supplementary_file_1.docx
Download MS Word (34.5 KB)Additional information
Funding
Related Research Data
References
- Ng, N. Q.;. Conserving Tropical Leguminous Food Crops. In Conservation of Tropical Plant Species; Normah, M. N., Chin, H. F., Reed, B. M.; Eds; Springer: New York, 2013; 213–247.
- Ningombam, R. D.; Singh, P. K.; Salam, J. S. Proximate Composition and Nutritional Evaluation of Underutilized Legume Psophocarpus Tetragonolobus (L.) DC. Grown in Manipur, Northeast India. Amerian Journal of Food Technology 2012, 7, 487–493.
- Morris, B.;. Bio-Functional Legumes with Nutraceutical, Pharmaceutical, and Industrial Uses. Economic Botany 2003, 57, 254–261.
- Wan Mohtar, W.-Q.; Hamid, A.; Abd-Aziz, S.; Muhamad, S.; Saari, N. Preparation of Bioactive Peptides with High Angiotensin Converting Enzyme Inhibitory Activity from Winged Bean [Psophocarpus Tetragonolobus (L.) DC.] Seed. Journal of Food Science and Technology 2014, 51, 3658–3668.
- Chay, S. Y.; Tan, W. K.; Saari, N. Preparation and Characterisation of Nanoliposomes Containing Winged Bean Seeds Bioactive Peptides. Journal of Microencapsulation 2015, 32, 1–8.
- Mundi, S.; Aluko, R. E. Physicochemical and Functional Properties of Kidney Bean Albumin and Globulin Protein Fractions. Food Research International 2012, 48, 299–306.
- Tang, C.-H.; Wang, X.-Y. Physicochemical and Structural Characterisation of Globulin and Albumin from Common Buckwheat (Fagopyrum Esculentum Moench) Seeds. Food Chemistry 2010, 121, 119–126.
- Horax, R.; Hettiarachchy, N.; Over, K.; Chen, P.; Gbur, E. Extraction, Fractionation and Characterization of Bitter Melon Seed Proteins. Journal of Agricultural and Food Chemistry 2010, 58, 1892–1897.
- Lqari, H.; Vioque, J.; Pedroche, J.; Millán, F. Lupinus Angustifolius Protein Isolates: Chemical Composition, Functional Properties and Protein Characterization. Food Chemistry 2002, 76, 349–356.
- Adebowale,; Schwarzenbolz, U.; Henle, T. Protein Isolates from Bambara Groundnut (Voandzeia Subterranean L.): Chemical Characterization and Functional Properties. International Journal of Food Properties 2011, 14, 758–775.
- Withana-Gamage, T. S.; Wanasundara, J. P. D.; Pietrasik, Z.; Shand, P. J. Physicochemical, Thermal and Functional Characterisation of Protein Isolates from Kabuli and Desi Chickpea (Cicer Arietinum L.): A Comparative Study with Soy (Glycine Max) and Pea (Pisum Sativum L.). Journal of the Science of Food and Agriculture 2011, 91, 1022–1031.
- Chen, X.; Ru, Y.; Chen, F.; Wang, X.; Zhao, X.; Ao, Q. FTIR Spectroscopic Characterization of Soy Proteins Obtained through AOT Reverse Micelles. Food Hydrocolloids 2013, 31, 435–437.
- Johnson, D. W.;. Functional Properties of Oilseed Proteins. Journal of the American Oil Chemists’ Society 1970, 47, 402–407.
- Damodaran, S. Amino Acids, Peptides and Protein. In Fennema’s Food Chemistry; Damodaran, S., Parkin, K. L., Fennema,; Ed.; CRC press, Taylor & Francis.: Soundpark Way, Suite 300, Boca Raton, FL., 2008; Vol. 4.
- Narayana, K.; Narasinga Rao, M. S. Functional Properties of Raw and Heat Processed Winged Bean (Psophocarpus Tetragonolobus) Flour. Journal of Food Science 1982, 47, 1534–1538.
- Okezie, B. O.; Bello, A. B. Physicochemical and Functional Properties of Winged Bean Flour and Isolate Compared with Soy Isolate. Journal of Food Science 1988, 53, 450–454.
- Sathe, S. K.; Salunkhe, D. K. Investigations on Winged Bean [Psophocarpus Tetragonolobus (L.) DC] Proteins and Antinutritional Factors. Journal of Food Science 1981, 46, 1389–1393.
- Sathe, S. K.; Deshpande, S. S.; Salunkhe, D. K. Functional Properties of Winged Bean [Psophocarpus Tetragonolobus (L.) DC] Proteins. Journal of Food Science 1982, 47, 503–509.
- Adebiyi, A. P.; Aluko, R. E. Functional Properties of Protein Fractions Obtained from Commercial Yellow Field Pea (Pisum Sativum L.) Seed Protein Isolate. Food Chemistry 2011, 128, 902–908.
- Malomo, S. A.; Aluko, R. E. A Comparative Study of the Structural and Functional Properties of Isolated Hemp Seed (Cannabis Sativa L.) Albumin and Globulin Fractions. Food Hydrocolloids 2015, 43, 743–752.
- Tan, S. H.; Mailer, R. J.; Blanchard, C. L.; Agboola, S. O. Emulsifying Properties of Proteins Extracted from Australian Canola Meal. LWT-Food Science and Technology 2014, 57, 376–382.
- Osborne, T. B.;. The Vegetable Protein; 2nd ed.; Longmans Green and Co.: New York, 1924; 154 pp.
- Wani, I. A.; Sogi, D. S.; Gill, B. S. Physico-Chemical and Functional Properties of Native and Hydrolysed Protein Isolates from Indian Black Gram (Phaseolus Mungo L.) Cultivars. LWT - Food Science and Technology 2015, 60, 848–854.
- Toews, R.; Wang, N. Physicochemical and Functional Properties of Protein Concentrates from Pulses. Food Research International 2013, 52, 445–451.
- Laemmli, U. K.;. Cleavage of Structural Proteins during the Assembly of the Head of the Bacteriophage T4. Nature 1970, 227, 680–686.
- AOAC. Official Methods of Analysis of AOAC International. In Food Composition; Additives; Natural Contaminants, 18th ed.; Latimer, W. H. G. W.; Ed.; AOAC International: Califonia: Gaithersburg, MD, 2005; Vol. ume II.
- Were, L.; Hettiarachchy, N.; Kalapathy, U. Modified Soy Proteins with Improved Foaming and Water Hydration Properties. Journal of Food Science 1997, 62, 821–824.
- Bradford, M. M.;. A Rapid and Sensitive Method for the Quantitation of Microgram Quantities of Protein Utilizing the Principle of Protein-Dye Binding. Analytical Biochemistry 1976, 72, 248–254.
- Coffmann, C. W.; Garcia, V. Functional Properties and Amino Acid Content of a Protein Isolate from Mung Bean Flour*. International Journal of Food Science & Technology 1977, 12, 473–484.
- O’Kane, F. E.; Vereijken, J. M.; Gruppen, H.; Van Boekel, M. A. J. S. Gelation Behavior of Protein Isolates Extracted from 5 Cultivars of Pisum Sativum L. Journal of Food Science 2005, 70, C132–C137.
- Neto, V.; Narain, N.; Silva, J.; Bora, P. Functional Properties of Raw and Heat Processed Cashew Nut (Anacardium Occidentale, L.) Kernel Protein Isolates. Food/Nahrung 2001, 45, 258–262.
- Beuchat, L. R.;. Functional and Electrophoretic Characteristics of Succinylated Peanut Flour Protein. Journal of Agricultural and Food Chemistry 1977, 25, 258–261.
- Hayakawa, S.; Nakai, S. Relationships of Hydrophobicity and Net Charge to the Solubility of Milk and Soy Proteins. Journal of Food Science 1985, 50, 486–491.
- Da Silva, M.; Neves, V.; Lourenço, E. Protein Fractions and Major Globulin from Chickpea (Cicer Arietinum L.). Alimentos E Nutrição 2001, 12, 131–149.
- Ulloa, J. A.; Rosas‐Ulloa, P.; Ulloa‐Rangel, B. E. Physicochemical and Functional Properties of a Protein Isolate Produced from Safflower (Carthamus Tinctorius L.) Meal by Ultrafiltration. Journal of the Science of Food and Agriculture 2011, 91, 572–577.
- Adebowale, K.; Lawal, O. Comparative Study of the Functional Properties of Bambarra Groundnut (Voandzeia Subterranean), Jack Bean (Canavalia Ensiformis) and Mucuna Bean (Mucuna Pruriens) Flours. Food Research International 2004, 37, 355–365.
- Seena, S.; Sridhar, K. Physicochemical, Functional and Cooking Properties of under Explored Legumes, Canavalia of the Southwest Coast of India. Food Research International 2005, 38, 803–814.
- Nishinari, K.; Fang, Y.; Guo, S.; Phillips, G. O. Soy Proteins: A Review on Composition, Aggregation and Emulsification. Food Hydrocolloids 2014, 39, 301–318.
- Mundi, S.; Aluko, R. E. Effects of NaCl and pH on the Structural Conformations of Kidney Bean Vicilin. Food Chemistry 2013, 139, 624–630.
- Ma, C.-Y.; Harwalkar, V. Thermal Analysis of Food Proteins. Advances in Food Ind Nutrition Research 1991, 35, 317–366.
- Agboola, S.; Ng, D.; Mills, D. Characterisation and Functional Properties of Australian Rice Protein Isolates. Journal of Cereal Science 2005, 41, 283–290.
- Ju, Z. Y.; Hettiarachchy, N. S.; Rath, N. Extraction, Denaturation and Hydrophobic Properties of Rice Flour Proteins. Journal of Food Science 2001, 66, 229–232.
- Ni, Y.; Wen, L.; Wang, L.; Dang, Y.; Zhou, P.; Liang, L. Effect of Temperature, Calcium and Protein Concentration on Aggregation of Whey Protein Isolate: Formation of Gel-Like Micro-Particles. International Dairy Journal 2015, 51, 8–15.
- Sun-Waterhouse, D.; Zhao, M.; Waterhouse, G. I. Protein Modification during Ingredient Preparation and Food Processing: Approaches to Improve Food Processability and Nutrition. Food and Bioprocess Technology 2014, 7, 1853–1893.
- Horax, R.; Hettiarachchy, N.; Chen, P.; Jalaluddin, M. Functional Properties of Protein Isolate from Cowpea (Vigna Unguiculata L. Walp.). Journal of Food Science 2004, 69, fct119–fct121.
- Horax, R.; Hettiarachchy, N.; Kannan, A.; Chen, P. Protein Extraction Optimisation, Characterisation, and Functionalities of Protein Isolate from Bitter Melon (Momordica Charantia) Seed. Food Chemistry 2011, 124, 545–550.
- Dench, J. E.;. Extraction of Nitrogenous Material from Winged Bean [Psophocarpus Tetragonolobus (L.) DC] Flour and the Preparation and Properties of Protein Isolates. Journal of the Science of Food and Agriculture 1982, 33, 173–184.
- Lawal, O.; Adebowale, K.; Ogunsanwo, B.; Sosanwo, O.; Bankole, S. On the Functional Properties of Globulin and Albumin Protein Fractions and Flours of African Locust Bean (Parkia Biglobossa). Food Chemistry 2005, 92, 681–691.
- De Wit, J.;. Nutritional and Functional Characteristics of Whey Proteins in Food Products. Journal of Dairy Science 1998, 81, 597–608.
- Huffman, L. M.;. Processing Whey Protein for Use as a Food Ingredient. Food Technology 1996, 50, 49–52.
- Adebowale, Y. A.; Adebowale, K. O. Evaluation of the Gelation Characteristics of Mucuna Bean Flour and Protein Isolate. Electronic Journal of Environmental, Agricultural and Food Chemistry 2007, 6, 2243–2262.
- Adebowale, K.; Lawal, O. Foaming, Gelation and Electrophoretic Characteristics of Mucuna Bean (Mucuna Pruriens) Protein Concentrates. Food Chemistry 2003, 83, 237–246.
- Chau, C.; Cheung, P. Functional Properties of Flours Prepared from Three Chinese Indigenous Legume Seeds. Food Chemistry 1998, 61, 429–433.
- Aletor, O.; Oshodi, A.; Ipinmoroti, K. Chemical Composition of Common Leafy Vegetables and Functional Properties of Their Leaf Protein Concentrates. Food Chemistry 2002, 78, 63–68.
- Kaur, M.; Singh, N. Characterization of Protein Isolates from Different Indian Chickpea (Cicer Arietinum L.) Cultivars. Food Chemistry 2007, 102, 366–374.
- McClements, D. J.;. Food Emulsion: Principles, Practices and Techniques. 2nd ed.; CRC Group: Boca Raton, FL. 33431, 2005; 609 pp.
- McClements, D. J.;. Protein-Stabilized Emulsions. Current Opinion in Colloid & Interface Science 2004, 9, 305–313.
- Horax, R.; Hettiarachchy, N.; Chen, P.; Jalaluddin, M. Preparation and Characterization of Protein Isolate from Cowpea (Vigna Unguiculata L. Walp.). Journal of Food Science 2004, 69, fct114–fct118.
- Dalgleish, D. G.;. Structure and Properties of Food Emulsion. In Food Emulsions, 4th, Revised and Expanded ed.; Friberg, S. E., Larsson, K., Sjoblom, J.; Ed.; CRC Group, Taylor and Francis: New York, 2005; 1–44.
- Dalgleish, D. G.;. Food Emulsions—Their Structures and Structure-Forming Properties. Food Hydrocolloids 2006, 20, 415–422.
- Razumovsky, S. D. L.;. Molecular Bases of Surface Activity of Proteins. In Functional Properties of Proteins and Lipids; American Chemical Society: Washington, DC; 1998; Vol. 708, 2–18.
- Gosal, W. S.; Ross-Murphy, S. B. Globular Protein Gelation. Current Opinion in Colloid & Interface Science 2000, 5, 188–194.
- Zhao, X.; Chen, F.; Chen, J.; Gai, G.; Xue, W.; Li, L. Effects of AOT Reverse Micelle on Properties of Soy Globulins. Food Chemistry 2008, 111, 599–605.