
ABSTRACT
Ficus and validation of the ultra performance liquid chromatography–electrospray ionization hybrid triple quadrupole–linear ion trap–tandem mass spectrometry (UPLC–ESI–QqQLIT–MS/MS) method in a multiple-reaction monitoring (MRM) mode for the quantitative determination of 19 phytochemicals. The chromatographic separation of targeted phytochemicals was performed using the Waters ACQUITY UPLC BEH™ C18 column (1.7 μm, 2.1 mm × 50 mm) with 0.1% formic acid with water and acetonitrile as a mobile phase at a flow rate of 0.25 mL/min. The validation parameters showed the overall recoveries from 95.78−101.44% (RSD ≤ 3.25%), precision (intra-day: RSD ≤ 2.96%; inter-day: RSD ≤ 2.89%), linearity (R2 ≥ 0.9982), limit of detection (8.60 × 10⁻¹⁰−2.18 × 10⁻⁶ mg/mL), and the limit of quantitation (2.60 × 10⁻⁹–6.63 × 10⁻⁶ mg/mL) in the concentration range from 0.5 to 1000 × 10–6 mg/mL. This method was successfully applied in ethanolic extracts of different parts (fruits, leaves, and barks) of selected eight Ficus species. Quinic acid was predominant followed by rutin and chlorogenic acid among the studied nineteen phytochemicals. Ficus benjamina showed the maximum total content in fruits and leaves. The UPLC–ESI–QqQLIT–MS/MS method combined with principal component analysis (PCA) was successfully used for Ficus species discrimination on the basis of the contents of 15 compounds. The UPLC–ESI–QqQLIT–MS/MS method combined with PCA could be used for quality control.
Introduction
Genus Ficus (Moraceae) is a tropical, deciduous, evergreen tree and cultivated worldwide since ancient times due to its delicious, nutritive fruits and medicinal properties.[Citation1] The fruit of the Ficus species is commonly known as “Fig.” The annual worldwide production of raw and dried fig is about 1.1 million tonnes and 0.13 million tonnes, respectively, with the highest production in Asia followed by Africa, Europe, and America.[Citation2] The Ficus species is also used in traditional medicine for treating a wide range of ailments of the central nervous system, endocrine system, gastrointestinal tract, reproductive system, respiratory system, and infectious disorders.[Citation3,Citation4]
The crude extracts of the Ficus species have been reported to possess antioxidant, antidiabetic, anti-inflammatory, antiulcerogenic, antifungal, antibacterial, anticancer, and hypotensive activities.[Citation4–Citation9] Phenolics and terpenoids are the major bioactive phytochemicals reported to be extracted from the Ficus species.[Citation4] In recent years, phytochemicals, such as quinic acid, protocatechuic acid, chlorogenic acid, mangiferin, catechin, epicatechin, rutin, 7-hydroxycoumaric acid, ferulic acid, vanillic acid, luteolin, quercetin, apigenin, kaempferol, chrysin, betulinic acid, ursolic acid, and oleanolic acid, have generated more interest due to their positive effects on human health.[Citation3] Generally, phenolics have been reported to be antiinflammatory, antimutagenic, anticancer, and anti-HIV while terpenoids exhibited antimicrobial and antifouling activities.[Citation10]
High-performance liquid chromatography (HPLC), high-performance thin-layer chromatography (HPTLC), gas chromatography–mass spectrometry (GC–MS), and liquid chromatography–mass spectrometry (LC–MS) have been reported for the analysis of the bioactive compounds in the Ficus species.[Citation11–Citation18] However, the UPLC–ESI–QqQLIT–MS/MS method in the MRM mode provides efficient separation and detection with high selectivity, sensitivity, and accuracy in comparison with the HPLC and HPTLC methods. It is a very powerful tool for rapid quantitative analysis of trace amounts of phytochemicals in crude extracts.
Earlier, the identification and characterization of bioactive compounds such as catechin, epicatechin, rutin, histidine, vanillic acid, quinic acid, ferulic acid, and luteolin have been reported by liquid chromatography tandem mass spectrometry (LC–MS/MS) in the fruits of F. carica, F. deltoidea, and Opuntia ficus-indica.[Citation3,Citation6,Citation8,Citation9,Citation19–Citation23] Similarly, quantitation of the bioactive compounds in F. carica, F. bhengalensis, F. religiosa, and F. deltoidea has been reported by HPLC or HPTLC.[Citation9,Citation24–Citation28] Catechin, epicatechin, rutin, and ferulic acid were quantified in the fruits of F. carica by HPLC.[Citation11,Citation20] Principal component analysis (PCA) is one of the most widely used multivariate techniques useful in dealing with large datasets for discrimination. PCA can also be used to construct a loading plot that indicates variables responsible for discrimination between the samples. The plots of scores and loadings are complementary and superimposable.[Citation29–Citation31]
The objective of this study was to develop and validate the UPLC–MS/MS method for simultaneous quantitation of phytochemicals in ethanolic extracts of different plant parts like fruits, leaves, and barks of eight Ficus species namely F. religiosa L., F. benghalensis L., F. palmata subsp. virgata (Roxb.) Browicz, F. virens Aiton, F. lyrata Warb., F. benjamina L., F. hispida L. f., and F. racemosa L. using UPLC–ESI–QqQLIT–MS/MS in the MRM mode. PCA was used to discriminate among the edible and medicinal Ficus species.
Materials and methods
Reagents and chemicals
The standards, quinic acid, protocatechuic acid, chlorogenic acid, mangiferin, catechin, epicatechin, rutin, hispidine, 7-hydroxycoumaric acid, ferulic acid, vanillic acid, luteolin, quercetin, apigenin, kaempferol, chrysin, betulinic acid, ursolic acid, and oleanolic acid, were purchased from Sigma-Aldrich (St. Louis, MO, USA). LC–MS grade acetonitrile, methanol, and formic acid were also purchased from Sigma-Aldrich. Ultrapure water was obtained from a Direct-Q system (Millipore, Milford, MA, USA).
Plant materials
The fruits, leaves, and barks of the Ficus species were collected from different regions of Uttar Pradesh, India, and identified by Lal B. Chaudhary, Council of Scientific and Industrial Research-National Botanical Research Institute (CSIR-NBRI), Lucknow. The voucher specimen numbers of the collected materials were prepared and deposited at CSIR-NBRI, Lucknow (LWG), after their proper identification. The list of species with collection details is given in .
Table 1. List of species with collection details.
Drying method
The fruits, leaves, and barks were washed with tap water followed by Milli-Q water and water removed by placing them under blotting papers. The cleaned samples were kept in zipped polyethylene bags containing silica gel of 6–20 mesh, which was replaced regularly until the samples were fully dried. The completely dried plant materials were ground by mechanical mill into fine powder.
Extraction
The powdered samples (10 g) were each placed in ethanol (200 mL) and sonicated (Bandelin SONOREX, Berlin) for 30 min and allowed to stand at room temperature (26–28°C). After 24 h, ethanol was filtered off using a Whatman number 1 filter paper. The filtrate was concentrated in a rotary evaporator (Buchi Rotavapor-R2, Flawil, Switzerland) at 40°C under reduced pressure (20–50 kPa). The residue was re-extracted three times following the same procedure. Each extract was packed separately in glass vials and stored at −20°C.
Preparation of calibration solutions and crude extract samples
The standards (quinic acid, protocatechuic acid, chlorogenic acid, mangiferin, catechin, epicatechin, rutin, hispidine, 7-hydroxycoumaric acid, ferulic acid, vanillic acid, luteolin, quercetin, apigenin, kaempferol, chrysin, betulinic acid, ursolic acid, and oleanolic acid) and the dried crude extracts (leaves, fruits, and barks) were separately weighed accurately to be about 1 mg each. Each standard and crude extract were dissolved in methanol (about 1 mL) according to weight for the preparation of 1 mg/mL stock solutions. Now, these stock solutions were sonicated for 30 min (Bandelin SONOREX, Berlin) and filtered through a 0.22 μm syringe filter (Millex-GV, PVDF, Merck Millipore, Darmstadt, Germany). The stock solutions of the standards were further diluted with methanol to prepare a series of working concentrations (0.5, 1.0, 2.0, 2.5, 5.0, 10.0, 25.0, 50.0, 100, 125, 200, 250, 500, 1000) × 10–3 mg/mL for linearity and calibration. All stock solutions were stored at –20°C until LC–MS analysis.
UPLC–ESI–QqQlit–MS/MS conditions
The Waters ACQUITY UPLCTM (Waters, Milford, MA, USA) system consisted of a binary solvent manager, sample manager, column compartment, and a photodiode array detector (PAD). Chromatographic separation of the targeted phytochemicals was carried out on an ACQUITY UPLC BEH™ C18 column (1.7 μm, 2.1 mm × 50 mm) at 25°C. Mobile phase A is the water containing 0.1% of formic acid and acetonitrile (B) delivered at a flow rate of 0.25 μL. The gradient program was as follows: 0−2 min, 10−30% B; 2−5 min, 30−80% B; 5−5.80 min, 80−90% B; 5−8 min, 90−57% B; 8−9 min, 57−10% B; and then returned to the initial composition in 2 min. The injection volume was 2.0 μL.
A triple–quadrupole linear ion trap mass spectrometer (API 4000 QTRAPTM MS/MS system from AB Sciex, Concord, ON, Canada) equipped with an electrospray (Turbo VTM) ion source was set up in a negative ionization mode. Source dependent parameters such as ion spray voltage, turbo spray temperature (TEM), nebulizer gas (GS 1), heater gas (GS 2), and curtain (CUR) gas were set at 5500 V, 550°C, 50 psi, 50 psi, and 20 psi, respectively. The collision-activated dissociation gas was set to be medium and the interface heater was on. Nitrogen was used in GS 1, GS 2, and CUR. Simultaneous quantitative analysis was performed using the MRM mode and its conditions were optimized for each compound during infusion. For full scan ESI–MS and MS/MS, the spectra scan range was m/z = 100–1000 at unit resolution. Optimization of the mass spectrometric conditions was carried out by infusing 50 × 10–6 mg/mL solutions of the analytes dissolved in methanol at 10 μL/min using a Harvard “22” syringe pump (Harvard Apparatus, South Natick, MA, USA). The transitions and optimized compound-specific dependent MRM parameters (declustering potential (DP), entrance potential (EP), collision energy (CE), and cell exit potential (CEP)) for each analyte are shown in .
Table 2. The transitions and optimized compound-dependent MRM parameters: declustering potential (DP), entrance potential (EP), collision energy (CE), and cell exit potential (CXP) of 19 analytes.
Statistical analyses
The contents of the bioactive compounds obtained from three repeats (n = 3) of all samples were used for PCA on STATISTICA software, Windows version 7.0 (Stat Soft, Inc., USA).
Results
Optimization of UPLC conditions
UPLC conditions were optimized to obtain a satisfactory separation within a short run time. Different mobile phases, such as water/methanol, water/acetonitrile, 0.1% formic acid in water/methanol, and 0.1% formic acid in water/acetonitrile, at different flow rates (0.1, 0.15, 0.20, 0.25, 0.30, 0.35, and 0.4 mL/min) and different column temperatures (25, 30, 40, and 50°C) were tested. Similarly, different concentrations of formic acid (0.1, 0.2, 0.3, and 0.4% v/v) were also tested to improve the peak shape and restrain peak tailing. Satisfactory chromatographic separation was achieved with 0.1% formic acid in water and acetonitrile as the mobile phase at a flow rate of 0.25 mL/min at 25°C using ACQUITY UPLC BEH™ C18 column (1.7 μm, 2.1 mm × 50 mm) within a run time of 10 min.
Optimization of MS conditions
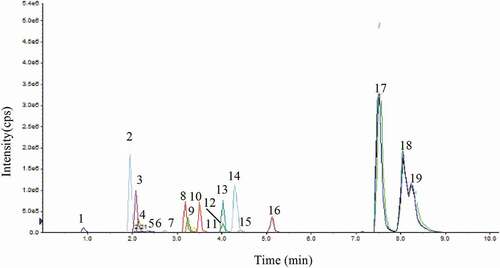
Each targeted analyte was infused into a mass spectrometer, and the mass spectra were studied in the negative ionization mode. Compounds 1–19 exhibited signal sensitivity in the negative ionization mode as [M–H]− ions at m/z 191.0 (quinic acid), 152.8 (protocatechuic acid), 353.3 (chlorogenic acid), 421.1 (mangiferin), 288 (catechin and epicatechin), 609.4 (rutin), 245.2 (hispidine), 161.1 (7-hydroxycoumaric acid), 193.0 (ferulic acid), 167.0 (vanillic acid), 285.1 (luteolin and kaempferol), 301.0 (quercetin), 269.0 (apigenin), 153.0 (chrysin), and 455 (betulinic acid, ursolic acid, and oleanolic acid) in the Q1 scan. The DP, EP, CE, and CXP were optimized for each compound to achieve the most abundant, specific, and stable MRM transition (). The curtain gas, GS1, GS2, and ion source temperature were further optimized in order to obtain the highest abundance of precursor-to-product ions. The MS/MS spectra of quinic acid, protocatechuic acid, chlorogenic acid, mangiferin, catechin, epicatechin, rutin, hispidine, 7-hydroxycoumaric acid, ferulic acid, vanillic acid, luteolin, quercetin, apigenin, kaempferol, and chrysin displayed abundant product ions corresponding to the transitions m/z 191.0→84.9, 152.8→109.3, 353.3→191.4, 421.10→331.0, 288.9→203.1, 288.6→203.0, 609.4→301, 245.20→159.0, 161.10→77.0, 193.0→134.0, 167→108.0, 285.1→132.9, 301.0→150.9, 269→117.0, 285.0→158.9, and 153.0→109.0, respectively, and these were selected as quantifiers ( and ). The [M–H]− ion (m/z 455) was selected as the quantifier in betulinic acid, ursolic acid, and oleanolic acid at different retention times. The optimized compound-dependent parameters and source parameters were combined, and finally the optimized UPLC–ESI–QqQLIT–MS/MS method in the MRM acquisition mode was validated and applied to quantify 19 phytochemicals in different parts of the Ficus species. The MRM-extracted ion chromatograms (EICs) and total ion chromatogram (TIC) of all analytes are shown in and , respectively.
Figure 1A. Structures and MS/MS spectra of standard compounds.

Figure 1B. Structures and MS/MS spectra of standard compounds.
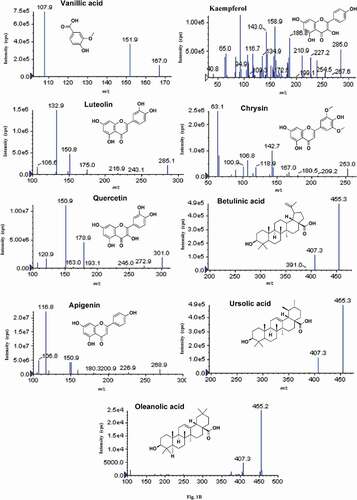
Figure 2A. Extracted ion chromatogram of 19 analytes.
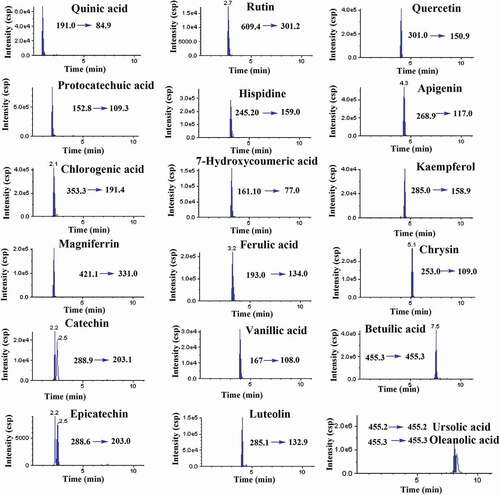
Figure 2B. Extracted ion chromatogram of 19 analytes.
Method validation
The linearity, limits of detection (LOD), limits of quantitation (LOQ), precision (inter-day and intra-day precision), stability, and accuracy were validated according to the guidelines of the International Conference on Harmonization (ICH).[Citation32] The 2.50 × 10⁻⁴ mg/mL stock solution was used in method development and validation.
Linearity, LOD, and LOQ
The calibration curves were constructed using more than five data points within the measured concentration range from 0.5 to 1000 × 10–6 mg/mL using a weight (1/x2) factor by the least-squares linear regression. The linear equation y = ax+b was used in the construction of the calibration curve, where “y” is the peak area ratio, “x” is the concentration of the analyte, “a” is the slope of the curve, and “b” is the intercept. The results showed linearity with correlation coefficients (R2) from 0.9982 to 1.0000 within the test ranges. The LODs and LOQs were calculated with a signal-to-noise (S/N) = 3 and 10, respectively, as the criteria, and the calculated values were found to be 8.60 × 10⁻¹⁰−2.18 × 10⁻⁶ mg/mL (LOD) and 2.60 × 10⁻⁹–6.63 × 10⁻⁶ mg/mL (LOQ) ().
Table 3. Linear regression, correlation coefficient (R2), limit of detection (LOD), limit of quantitation (LOQ), intra-day and inter-day precision, and recovery of compounds 1–19 in terms of peak area.
Precision, stability, and recovery
Intra-day and inter-day experiments selected for the precision of the developed method was investigated by three replicates during a single day and by duplicating the experiments on six consecutive days. The percentage relative standard deviations (%RSD) of the peak area for all compounds ranged from 0.25 to 2.96% and 0.17 to 2.89%, respectively. Similarly, the stability of sample solutions stored at room temperature was investigated by replicate injections of the sample solution at 0, 2, 4, 8, 12, and 24 h. The %RSD values of the stability ranged from 0.45 to 3.45% ().
To evaluate the accuracy of this method, a recovery test was applied by the standard addition method. The mixed standard solutions with three different spike levels (low (1.00 × 10⁻⁴ mg/mL), middle (2.00 × 10⁻⁴ mg/mL), and high (3.00 × 10⁻⁴ mg/mL) were added into a sample and analyzed using the above method in triplicate experiments. The recovery was calculated by the formula: recovery = (a–b)/c × 100%, where “a” is the detected amount, “b” is the original amount, and “c” is the spiked amount. All analytes showed recoveries in the range of 95.78−101.44% (RSD ≤ 3.25%). The results showed that the developed UPLC–ESI–QqQLIT–MS/MS method was simple, reliable, and reproducible ().
Application of the UPLC–ESI–QqQlit–MS/MS method
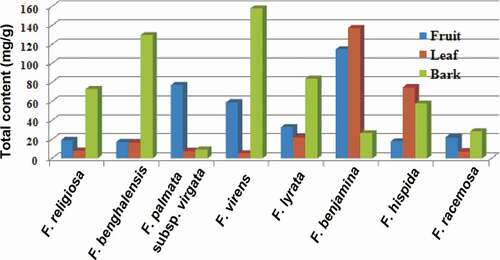
All compounds were identified, characterized, and quantified in crude extracts by the developed and validated UPLC–ESI–QqQLIT–MS/MS method. The quantities (mean value = 3) of quinic acid, protocatechuic acid, chlorogenic acid, mangiferin, catechin, epicatechin, rutin, hispidine, 7-hydroxycoumaric acid, ferulic acid, vanillic acid, luteolin, quercetin, apigenin, kaempferol, chrysin, betulinic acid, ursolic acid, and oleanolic acid in fruits, leaves, and barks of F. religiosa, F. benghalensis, F. palmata subsp. virgata, F. virens, F. lyrata, F. benjamina, F. hispida, and F. racemosa are presented in . The total content of all compounds in fruits, leaves, and barks is shown in .
Table 4. The content of 19 compounds (mg/g) in ethanolic extracts of the fruits, leaves, and barks of F. religiosa, F. benghalensis, F. palmata subsp. virgata, F. virens, F. lyrata, F. benjamina, F. hispida, and F. racemosa.
Figure 3. Graphical presentation of the total contents of 19 compounds in fruits, leaves, and barks in eight Ficus species.
Fruits
Among fruits, the highest content of quinic acid was detected in F. virens (48.283 mg/g) followed by F. benjamina (43.067 mg/g) and F. lyrata (27.271 mg/g). Similarly, a high quantity of rutin was found in fruits of F. palmata subsp. virgata (72.337 mg/g) and F. benjamina (63.147 mg/g) followed by F. hispida (8.601 mg/g) and F. virens (8.020 mg/g). A significant content of chlorogenic acid was detected in F. benjamina (5.63 mg/g) followed by F. lyrata (1.38 mg/g). The fruits of F. benjamina showed the highest total content of all compounds (114.797 mg/g) followed by F. palmata subsp. virgata (77.139 mg/g) and F. virens (58.921 mg/g).
Leaves
F. benjamina showed the highest content of quinic acid (126.00 mg/g) followed by F. hispida (65.971 mg/g) and F. benghalensis (11.073 mg/g). A high content of chlorogenic acid was detected in F. benjamina (4.857 mg/g) and F. hispida (4.145 mg/g). Similarly, a high content of rutin was detected in F. palmata subsp. virgata (4.953 mg/g), F. lyrata (1.961 mg/g), and F. virens (1.27 mg/g). Approximately, the same amount of catechin was detected in F. benjamina (1.977 mg/g) and F. lyrata (1.840 mg/g) followed by F. hispida (1.194 mg/g). High contents of oleanolic acid (1.89 mg/g) and ursolic acid (1.463 mg/g) were found in F. lyrata. F. benjamina leaves have shown a predominant total content (137.167 mg/g) followed by F. hispida (74.899 mg/g) and F. lyrata (22.003 mg/g).
Barks
The highest content of quinic acid was obtained in F. virens (154.738 mg/g) followed by F. benghalensis (112.015 mg/g) and F. religiosa (59.348 mg/g). Similarly, a high amount of chlorogenic acid was detected in F. benghalensis (14.182 mg/g) followed by F. religiosa (3.780 mg/g), F. benjamina (3.637 mg/g), and F. lyrata (3.252 mg/g). F. lyrata showed the highest content of catechin (10.137 mg/g) and epicatechin (8.121 mg/g). A high amount of rutin was detected in F. palmata subsp. virgata (4.131 mg/g) followed by F. religiosa (1.288 mg/g) and F. benjamina (1.053 mg/g). Similarly, barks of F. virens showed a high total content (157.73 mg/g) followed by F. benghalensis (129.657 mg/g) and F. lyrata (83.745 mg/g).
Principal component analysis
PCA is a chemometric method which discriminates variables and display differences among the samples. The PCA was run on the basis of the contents of 19 targeted bioactive compounds obtained during quantitative analysis (mean values n = 3) by UPLC–ESI–QqQLIT–MS/MS. In this study, hispidine, 7-hydroxycoumaric acid, apigenin, and chrysin did not show significant contribution, so they were dropped. On the basis of the remaining 15 compounds, PC1 and PC2 of the PCA plot of fruits explained 29.57% and 25.45% variations, respectively ()). The loading factor of the first factor indicated a correlation among chlorogenic acid (0.848), catechin (0.827), and quercetin (0.719), whereas factor 2 has a correlation among quinic acid (0.840), oleanolic (0.762) acid, and kaempferol (−0.760). As a result, F. virens, F. lyrata, and F. racemosa were closer to each other, whereas F. hispida and F. palmata subsp. virgata were located in another quadrate. F. benghalensis was located in the borderline while F. benjamina and F. religiosa were far apart from other species. The PCA plot ()) of edible species showed that F. hispida, F. racemosa, F. benghalensis, and F. benjamina were far apart from each other. The non-edible species F. lyrata and F. virens were similar, hence located together, and F. palmata subsp. virgata and F. religiosa were in different quadrates ()).
Figure 4. PC1 vs. PC2 plot showing discrimination among eight Ficus species in fruits (A), leaves (B), and barks (C) on the basis of the contents of 15 bioactive compounds (protocatechuic acid, chlorogenic acid, mangiferin, catechin, epicatechin, rutin, hispidine, 7-hydroxycoumaric acid, ferulic acid, vanillic acid, luteolin, quercetin, apigenin, kaempferol, chrysin, betulinic acid, ursolic acid, and oleanolic acid).
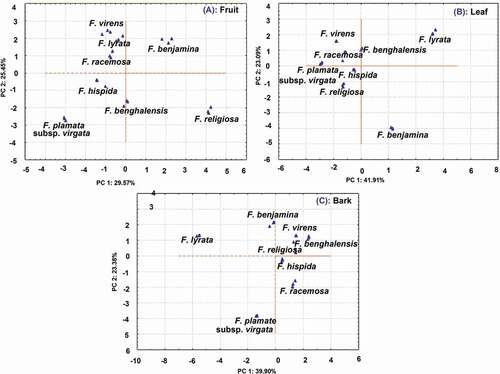
Figure 5. PC1 vs. PC2 plot showing discrimination between edible and non-edible fruits and leaves on the basis of 15 bioactive compounds (quinic acid, protocatechuic acid, chlorogenic acid, mangiferin, catechin, epicatechin, rutin, hispidine, 7-hydroxycoumaric acid, ferulic acid, vanillic acid, luteolin, quercetin, apigenin, kaempferol, chrysin, betulinic acid, ursolic acid, and oleanolic acid).
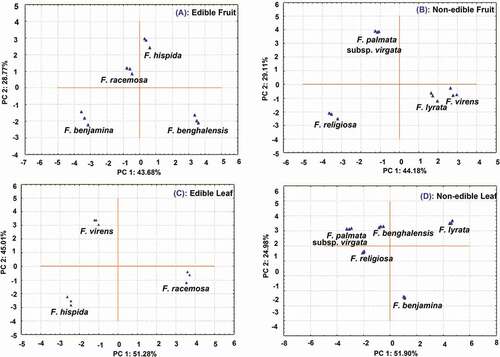
In leaves, PC1 and PC2 explained 41.91% and 23.09% variation which together explained 65.00%. Catechin (0.980), epicatechin (0.928), betulinic acid (0.798), and oleanolic acid (0.856) have a correlation in factor 1, whereas quinic acid (−0.756) and chlorogenic acid (−0.830) have a correlation in factor 2. The PCA plot showed F. virens, F. racemosa, and F. palmata subsp. virgata located in the same quadrate. Similarly, F. hispida and F. religiosa were located in the same quadrate, whereas F. lyrata and F. benjamina were far apart from each other ()). The edible species F. virens, F. hispida, and F. racemosa were further analyzed in PCA which showed all edible species located falling far apart from each other ()). Similarly, PCA was further run on leaves of non-edible species (F. benghalensis, F. palmata subsp. virgata, F. lyrata, F. religiosa, and F. benjamina), and the results showed that F. benghalensis and F. palmata subsp. virgata were closer to each other while others remained far apart ()).
Similarly, the PCA plots of barks presented in ) explained PC1 and PC2 variations of 41.91% and 23.09%, respectively. Factor loading showed a correlation among betulinic acid (0.959), ursolic acid (−0.943), kaempferol (−0.924), and catechin (−0.801) in factor 1, whereas factor 2 has protocatechuic acid (0.837) and rutin (−0.819). The PCA plot showed that F. virens, F. benghalensis, and F. religiosa were located in the same quadrate, whereas F. hispida and F. racemosa were located in another quadrate. Similarly, F. lyrata and F. benjamina were in the same quadrates, whereas F. palmata subsp. virgata were far apart.
Discussion
In the present study, the UPLC–ESI–QqQLIT–MS/MS method in the MRM mode was used to identify and quantify 19 bioactive compounds simultaneously in a single run from fruits, leaves, and barks of eight Ficus species namely F. religiosa L., F. benghalensis L., F. palmata subsp. virgata (Roxb.) Browicz, F. virens Aiton, F. lyrata Warb., F. benjamina L., F. hispida L. f., and F. racemosa L (). Hispidine, 7-hydroxycoumaric acid, and chrysin were detected in very small amounts while quinic acid and chlorogenic acid were found in high quantity in all the plant parts of all the studied species. A significant content of chlorogenic acid was detected in fruits (0.032–5.63 mg/g), leaves (0.053–4.857 mg/g), and barks (0.064–14.182 mg/g) as compared to the previously reported quantity in F. carica.[Citation11] Catechin was also observed in higher quantity ranges of 0.041–0.262, 0.011–1.977, and 0.039–10.137 mg/g in fruits, leaves, and barks, respectively, than the previous report.[Citation11] Epicatechin and rutin were also detected in high quantity (). Many of the selected Ficus species have shown a high content of bioactive compounds than the other published reports on Ficus species. The HPLC method reported by Taskeen et al.[Citation25] showed a very high amount of flavonoids in F. bhengalensis as compared to F. religiosa. The UPLC–ESI–QqQLIT–MS/MS method in the MRM mode is rapid, sensitive, precise, efficient, and reproducible as compared to HPLC and LC–MS methods reported earlier.[Citation3,Citation6,Citation8,Citation9,Citation19–Citation23]
According to Yin-Xian et al.,[Citation7] the antioxidant property of crude extracts of Ficus species is due to the total phenolic and flavonoid contents. Therefore, F. benjamina fruits and leaves, which are edible, can be highly valuable for health due to the high total content of phenolics and flavonoids. Similarly, barks of F. benghalensis and F. virens can be utilized for medicinal purposes in comparison to other tested species on the basis of the high content of selected phytochemicals. PCA was successfully used to discriminate among the Ficus species on the basis of their chemical content.
Conclusion
A rapid and sensitive UPLC–ESI–QqQLIT–MS/MS method was developed and validated as per ICH guidelines for the simultaneous quantification of 19 bioactive compounds in a single run from different parts of eight Ficus species. It is a high throughput and more advance method for the identification and quantitation of chemical constituents. The results indicated that the total content of all the 19 compounds was high in F. virens barks followed by leaves and fruits of F. benjamina. All these selected Ficus species as well as edible and non-edible fruits and leaves were successfully discriminated using PCA. The quantitative results also indicated the importance of plant parts. The present method can be used for the quantitative analysis of these compounds and quality control of Ficus species.
Conflicts of interest
The authors declare that they have no conflict of interest. This article does not contain any studies with human participants or animals performed by any of the authors.
Acknowledgments
The authors gratefully acknowledge SAIF, CSIR-Central Drug Research Institute, Lucknow, where the mass spectrometric studies were carried out. SK is thankful to the principal of MK Govt. College, Farrukhabad, for support. AKS, RT, and LBC express their gratitude to the Director, CSIR-National Botanical Research Institute, Lucknow, for facilities under the project BSC 0106. CDRI communication number is 9672.
References
- Chaudhary, L. B.; Sudhakar, J. V.; Kumar, A.; Bajpai, O.; Tiwari, R.; Murthy, G. V. S. Synopsis of the Genus Ficus L. (Moraceae) in India. Taiwania 2012, 57, 193–216.
- Statistics from: FAOSTAT (Food and Agricultural organization of United Nations: economic and social department: the statistical division). (1943). US. UN Food and Agriculture Organization Corporate Statistical Database. http://faostat3.fao.org/browse/Q/QC/E. (accessed Sep 6, 2016).
- Singh, D.; Singh, B.; Goel, R. K. Traditional Uses, Phytochemistry and Pharmacology of Ficus religiosa: A Review. Journal of Ethnopharmacology 2011, 134, 565–583. DOI: 10.1016/j.jep.2011.01.046.
- Sirisha, N.; Sreenivasulu, M.; Sangeeta, K.; Chetty, C. M. Antioxidant Properties of Ficus Species–A Review. International Journal of Chemtech Research 2010, 2, 2174–2182.
- Kuti, J. O.; Antioxidant Compounds From Four Opuntia Cactus Pear Fruit Varieties. Food Chemistry 2004, 85, 527–533. DOI: 10.1016/S0308-8146(03)00184-5.
- Omar, M. H.; Mullen, W.; Crozier, A. Identification of Proanthocyanidin Dimers and Trimers, Flavone C-Glycosides, and Antioxidants in Ficus deltoidea, a Malaysian Herbal Tea. Journal of Agriculture and Food Chemistry 2011, 59, 1363–1369. DOI: 10.1021/jf1032729.
- Yin-Xian, S.; You-Kai, X.; Hua-Bin, H.; Zhi, N.; Wen-Hui, W. Preliminary Assessment of Antioxidant Activity of Young Edible Leaves of Seven Ficus Species in the Ethnic Diet in Xishuangbanna Southwest China. Food Chemistry 2011, 128, 889–894. DOI: 10.1016/j.foodchem.2011.03.113.
- Takahashi, T.; Okiura, A.; Saito, K.; Kohno, M. Identification of Phenylpropanoids in Fig (Ficus carica L.) Leaves. Journal Agriculture Food Chemistry 2014, 62, 10076−10083. DOI: 10.1021/jf5025938.
- Ammar, S.; Contreras, M. M.; Belguith-Hadrich, O.; Bouaziz, M.; Segura-Carretero, A. New Insights into the Qualitative Phenolic Profile of Ficus carica L. Fruits and Leaves from Tunisia Using Ultra-High-Performance Liquid Chromatography Coupled to Quadrupole-Time-Of-Flight Mass Spectrometry and Their Antioxidant Activity. RSC Advance 2015, 5, 20035–20050. DOI: 10.1039/C4RA16746E.
- Yılmaz, A.; Boğa, M.; Topçu, G.; Bener, M.; Özyürek, M.; Güçlü, K.; Apak, R.; Erbaş, S.; Baydar, H.; Xu, X.; et al. Novel Terpenoids with Potential Anti-Alzheimer Activity from Nepeta Obtusicrena. Record Natural Product 2016, 10, 530–541.
- Slatnar, A.; Klancar, U.; Stampar, F.; Veberic, R. Effect of Drying of Figs (Ficus carica L) on the Contents of Sugars, Organic Acids, and Phenolic Compounds. Journal of Agriculture and Food Chemistry 2011, 59, 11696–11702. DOI: 10.1021/jf202707y.
- Smyth, T. J.; Ramachandran, V.; Brooks, P.; Smyth, W. F. Investigation of Antibacterial Phytochemicals in the Bark and Leaves of Ficus coronata by High‐Performance Liquid Chromatography‐Electrospray Ionization–Ion Trap Mass Spectrometry (Hplc‐Esi‐Msn) and ESI‐MSn. Electrophoresis 2012, 33, 713–718. DOI: 10.1002/elps.201100302.
- Yeddes, N.; Chérif, J. K.; Guyot, S.; Baron, A.; Trabelsi-Ayadi, M. Phenolic Profile of Tunisian Opuntia ficus indica Thorn Less Form Flowers via Chromatographic and Spectral Analysis by Reversed Phase-High Performance Liquid Chromatography-UV-Photodiode Array and Electrospray Ionization-Mass Spectrometer. International Journal of Food Properties 2014, 17, 741–751. DOI: 10.1080/10942912.2012.665404.
- Alajmi, M. F.; Alam, P.; Siddiqui, N. A.; Basudan, O. A.; Hussain, A. Quantitative Analysis of Biomarker Rutin in Different Species of Genus Ficus by Validated NP and RP-HPTLC Methods. Pakistan Journal of Pharmaceutical Sciences 2015, 28, 2213–2220.
- Basudan, O. A.; Alam, P.; Siddiqui, N. A.; Alajmi, M. F.; Alrehaily, A. J.; Alqasoumi, S. I.; Abdel-Kader, M. S.; Alam, P.; Donia, A. E. R. M. Development and Validation of A High-Performance Thin-Layer Chromatographic Method for the Determination of Biomarker Β-Amyrin in the Leaves of Different Ficus Species. Journal of Planar Chromatography 2015, 28, 223–228. DOI: 10.1556/1006.2015.28.3.5.
- Jasmine, R.; Manikandan, K.; Karthikeyan, K. Evaluating the Antioxidant and Anticancer Property of Ficus carica Fruits. Afr. J. Biotechnol. 2015, 14, 634–641. DOI: 10.5897/AJB.
- Shafaei, A.; Aisha, A. F.; Siddiqui, M. J. A.; Ismail, Z. Analysis of L-Citrulline and L-Arginine in Ficus deltoidea Leaf Extracts by Reverse Phase High Performance Liquid Chromatography. Pharmacognosy Research 2015, 7, 32–37. DOI: 10.4103/0974-8490.147196.
- Russo, F.; Caporaso, N.; Paduano, A.; Sacchi, R. Characterization of Volatile Compounds in Cilento (Italy) Figs (Ficus carica L.) Cv. Dottato as Affected by the Drying Process. International Journal of Food Properties 2017, DOI: http://dx.doi.org/10.1080/10942912.2017.1344991.
- Stintzing, F. C.; Schieber, A.; Carle, R. Identification of Betalains from Yellow Beet (Beta Vulgaris L.) And Cactus Pear [Opuntia ficus-indica (L.) Mill.] By High-Performance Liquid Chromatography-Electrospray Ionization Mass Spectrometry. Journal of Agriculture and Food Chemistry 2002, 50, 2302–2307. DOI: 10.1021/jf011305f.
- Oliveira, A. P.; Silva, L. R.; Ferreres, F.; De Pinho, G.; Valentão, P.; Silva, P.; Pereira, B. M.; Andrade, J. A.; Chemical, P. B. Assessment and in Vitro Antioxidant Capacity of Ficus carica Latex. Journal of Agriculture and Food Chemistry 2010, 58, 3393–3398. DOI: 10.1021/jf9039759.
- Dzolin, S.; Ahmad, R.; Zain, M. M.; Ismail, M. I. Flavonoid Distribution in Four Varieties of Ficus deltoidea (Jack). Journal of Medicinal Plant and Herbal Therapy Research 2015, 3, 1–9.
- Chua, L. S.; Hyphenated Technique of LC-PDALC-PDA-MS/MS for Phytochemical Profiling of Ficus deltoidea. In Crystallizing Ideas–The Role of Chemistry; Ramasami, P., Gupta Bhowon, M., Jhaumeer Laulloo, S., Li Kam Wah, H. Eds.; Springer International Publishing: New York City, 2016; pp 57–70.
- Zhang, X.; Lv, H.; Li, Z.; Jian, K.; Lee, M. R. HPLC/QTOF‐MS/MS Application to Investigate Phenolic Constituents from Ficus pandurata H. Aerial Roots. Biomedical Chromatography 2015, 29, 860–868. DOI: 10.1002/bmc.3366.
- Vaya, J.; Mahmood, S. Flavonoid Content in Leaf Extracts of the Fig (Ficus carica L.), Carob (Ceratonia siliqua L.) And Pistachio (Pistacia Lentiscus L.). Biofactors 2006, 28, 169–175. DOI: 10.1002/biof.v28:3/4.
- Taskeen, A.; Naeem, I.; Mubeen, H.; Mehmood, T. Reverse Phase High Performance Liquid Chromatographic Analysis of Flavonoids in Two Ficus Species. New York Science Journal 2009, 2, 32–35.
- Ali, B.; Mujeeb, M.; Aeri, V.; Mir, S. R.; Ahmad, S.; Siddique, N. A.; Faiyazuddin, M.; Shakeel, F. High-Performance Thin Layer Chromatographic Quantification of Bioactive Psoralen and Daidzein in Leaves of Ficus carica L. Natural Product Research 2011, 25, 1666–1670. DOI: 10.1080/14786419.2010.529446.
- Qin, H.; Zhou, G.; Peng, G.; Li, J.; Chen, J. Application of Ionic Liquid-Based Ultrasound-Assisted Extraction of Five Phenolic Compounds from Fig (Ficus carica L.) For HPLC-UV. Food Analytical Method 2015, 8, 1673–1681. DOI: 10.1007/s12161-014-0047-9.
- Vallejo, F.; Marín, J. G.; Tomás-Barberán, F. A. Phenolic Compound Content of Fresh and Dried Figs (Ficus carica L.). Food Chemistry 2012, 130, 485–492. DOI: 10.1016/j.foodchem.2011.07.032.
- Jolliffe, I. T.; Cadima, J. Principal Component Analysis: A Review and Recent Developments. Philosophical Transactions of the Royal Society A 2016, 374, 20150202. DOI: 10.1098/rsta.2015.0202.
- Xanthopoulos, P.; Pardalos, P. M.; Trafalis, T. B. Principal Component Analysis. In Robust Data Mining; Pardalos, P. M., Pinter, J. D., Robinson, S. M., Terlaky, T., Thai, M. T. Eds; Springer: New York, 2013.
- Bryant, D. K.; Monté, S.; Man, W. J.; Kramer, K.; Bugelski, P.; Neville, W.; White, I. R.; Camilleri, P. Principal Component Analysis of Mass Spectra of Peptides Generated from the Tryptic Digestion of Protein Mixtures. Rapid Communications in Mass Spectrometry 2001, 152, 418–427. DOI: 10.1002/rcm.247.
- ICH Guideline Q2 (R1). Validation of Analytical Procedures: Text and Methodology. International Conference on Harmonization, Geneva, 1, 2005.