
ABSTRACT
The presence of coumarin, a hepatotoxic phenyl propanoid, in samples of the spice, cinnamon, procured from the market has raised food safety concerns world over. A validated, ultra-performance liquid chromatography- linear ion trap triple quadrupole mass spectrometry method was developed in the present study for the estimation of coumarin and other phenolics in authentic Cinnamomum verum bark samples and market samples from south India. Coumarin contents in authentic bark samples were in the range of 12.3 to 143.0 mg/kg, whereas the coumarin contents in samples procured from the market were up to 3462.0 mg/kg. The high content of coumarin and cinnamaldehyde in cinnamon samples procured from the market suggested possible blending with substitutes like Cinnamomum cassia barks, which possess substantial amounts of coumarin and cinnamaldehyde.
Introduction
Cinnamon, one of the most commonly used spices in the world, has been recognised for its culinary and medicinal applications since antiquity and is one of the most important flavouring agents in food and beverage industry. True cinnamon (Ceylon cinnamon) is the dried inner bark of Cinnamomum verum J. S. Presl (syn. C. zeylanicum Blume; Family: Lauraceae), native to Sri Lanka. However, the barks of C. cassia Nees & T. Nees J. Presl (Chinese Cinnamon) from South-East China, C. loureiroi Nees (Saigon cassia) from Vietnam, C. burmannii Nees & T. Nees (Indonesian cinnamon) from South-East Asia, C. tamala (Dalchini) from north India and C. malabathrum (wild cinnamon) from south India were also traded as cinnamon in various parts of the world. [Citation1–Citation3] True cinnamon has been replaced by barks of other Cinnamomum species such as C. cassia and C. burmannii available at a cheaper price in the spices market. However, consuming high amounts of such substitutes is toxic due to the high content of coumarin (up to 10.6%) compared to true cinnamon. [Citation4–Citation6] Coumarin (2H-chromen-2-one) has been established as hepatotoxic and carcinogenic, and raised safety issues in food sector. The European Food Safety Authority (EFSA) and German Institute for Risk Assessment (BfR) established Tolerable Daily Intake (TDI) of coumarin as 0.1 mg per kg body weight. [Citation7] As per Food Safety and Standards Authority of India (FSSAI) guidelines, coumarin content in food products in India should not exceed 0.3% by weight. [Citation8]
Several analytical methods such as Gas chromatography mass spectrometry (GC-MS) [Citation9], High performance liquid chromatography (HPLC) [Citation10–Citation12], Liquid chromatography mass spectrometry (LC-MS) [Citation6,Citation13] and ambient ionisation mass spectrometry [Citation14] have been established to determine coumarin and related compounds in cinnamon. Because of high accuracy, reproducibility and authenticity in results, hyphenated LC-MS techniques are more acceptable for quality control and analysis of food samples. Recently, ultra-performance liquid chromatography (UPLC) technique has become a trendsetter in separation sciences compared to conventional HPLC techniques, due to the faster separation and better sensitivity. [Citation15] Electrospray ionisation (ESI) is one of the most useful ionisation techniques for the analysis of secondary metabolites, due to minimum thermal degradation under the mild conditions of ESI. [Citation16] Amongst the sensitive and accurate mass measurement techniques, triple quadrupole linear ion trap mass spectrometry (QqQLIT-MS/MS) combines the advantages of both QqQ and LIT. The functions of QqQ include Multiple reaction monitoring (MRM), precursor ion and product ion scans for quantitative analysis, whereas LIT yields a series of enhanced sensitive scans. [Citation17]
C. verum is cultivated in different parts of south India on a small scale. However, most of the market samples in south India originate from imported cinnamon, especially from Sri Lanka. Because of ease of availability and low cost, most of the cinnamon samples available in markets are adulterated with Cassia cinnamon (C. cassia) having high coumarin contents. [Citation18] The present study reports the quantification of coumarin and related phenolics in authentic C. verum bark samples collected from south India in comparison with samples procured from the markets by a validated UHPLC-QqQLIT-MS/MS method. Though south India is a centre of cinnamon trade, the quality evaluation of cinnamon samples originating from south India has not been studied and this is the first report on validated estimation of the coumarin and other phenolics of cinnamon from south India.
Materials and methods
Chemicals and plant materials
Analytical standards of coumarin (1), scopoletin (2), E-o-coumaric acid (3), cinnamic acid (4) and cinnamaldehyde (5) () were purchased from Sigma Aldrich (Bengaluru, India). All the solvents and chemicals used were of analytical grade or LC-MS grade and purchased from Merck (Darmstadt, Germany).
Figure 1. Structures of standard analytes (1–5).
Bark samples of five authentic C. verum accessions (M-6, 7, 8, 9 and 10) were collected from different parts of south India, including the cinnamon plantations which were established by the British during the colonial period in Anjarakkandy, Kannur, Kerala. Five cinnamon samples procured from the markets (M-1, 2, 3, 4 and 5) were purchased from retail shops in south India. Voucher specimens of authentic C. verum samples were deposited at Jawaharlal Nehru Tropical Botanic Garden and Research Institute Herbarium (TBGT). The sample type, source of the analysed samples and their herbarium voucher numbers are listed in .
Table 1. Cinnamon samples, source, sample code and herbarium number.
Quantification of coumarin and other phenolics
Sample preparation: Dried stem bark powders (1 g each) were extracted using analytical grade methanol for 3 h in a Soxhlet apparatus. The extracts were filtered through Whatman filter paper and evaporated to dryness using a rotary evaporator (Buchi, Switzerland) at 40°C. The dried extracts were weighed accurately (1 mg), dissolved in 1 mL of LC-MS grade methanol by sonication (Bandelin, Sonorex) and filtered through 0.22 µm syringe filter (Millipore, Germany).
Standards preparation: Mixed standards (1–5) stock solutions (1 mg/mL) were prepared by dissolving individual standards in LC-MS grade methanol. The working standard solutions were prepared by diluting the mixed standard solution with methanol and spiking with 50 ng/mL of the internal standards curcumin and piperine. All solutions were stored at –20°C until used and sonicated before injection.
Instrumentation and analytical conditions for UPLC-ESI-QqQLIT-MS/MS analysis
The quantitative analysis was performed on Waters Acquity UPLCTM system (Waters, Milford, MA, USA) interfaced with hybrid linear ion trap triple-quadrupole mass spectrometer (API 4000 QTRAP™ MS/MS system from AB Sciex, Concord, ON, Canada) equipped with electrospray (Turbo V) ion (ESI) source. Waters Acquity UPLCTM system consisted of binary solvent manager, sample manager, column oven and photodiode array detector (PDA). AB Sciex Analyst software version 1.5.1 was used to control the LC-MS/MS system and for data acquisition and processing.
Liquid chromatography conditions: The chromatographic separation of the analytes and internal standards was achieved on an Acquity UPLC BEH C18 column (50 mm × 2.1 mm id, 1.7µm) at a column temperature of 25°C. Analysis was completed with gradient elution of 0.1% formic acid in water (A) and acetonitrile (B) as mobile phase at a flow rate of 0.3 mL/min. The 4 min UPLC gradient elution programme was as follows: 0–3.0 min, 5–85% B; 3.0–4.0 min, 85% B; with equilibration time 2.5 min. The sample injection volume was 2 µL.
Mass spectrometric conditions: Precursor ion scan mode was used for the screening and MRM acquisition mode for quantification of standard compounds in analyte samples. The analytes with internal standards were detected using both positive and negative ESI modes, by continuous polarity switching and mass spectra were recorded in the range of m/z 100–1000. Nitrogen was used as the nebuliser, heater, curtain gas as well as the collision activated dissociation (CAD) gas. CAD gas was set at medium; interface heater was on and the source temperature was 550°C. The optimised parameters for negative mode were as follows: ion spray voltage was set at −4200 V; curtain gas, nebuliser gas (GS1) and heater gas (GS2) were set at 20 psi and source temperature was 550°C. Optimised parameters for positive mode were as follows: the ion spray voltage was set to 5500 V; nebuliser gas (gas 1) and heater gas (gas 2) were set to 50 psi and the curtain gas (CUR) was kept at 20 psi. Quantitation of the analytes was carried out using MRM acquisition mode at unit resolution and the MS conditions were optimised for each standard during infusion. The transitions and optimised compound dependent MRM parameters such as declustering potential (DP), entrance potential (EP), collision energy (CE) and cell exit potential (CXP) for the analytes and internal standards were listed in supplementary Table S1.
Validation procedure: The developed LC-MS/MS method was validated in terms of linearity, limit of detection (LOD), limit of quantification (LOQ), precision, stability and recovery according to the International Conference on Harmonisation of Technical Requirements for Registration of Pharmaceuticals for Human Use (ICH) guidelines (ICH Q2 R1, 2005).
The linearity of calibration curve was checked by plotting the peak areas against the series of standard solution concentrations. The correlation coefficient was determined by a linear regression model. LOD and LOQ were calculated by means of the calibration curve method. The precision of the developed method was evaluated using intraday and interday variations and the relative standard deviation (RSD) was taken as a measure of precision. The intraday and interday variations, which were selected to determine the precision of the developed method, were analysed using six replicates during a single day and by duplicating the experiments on three consecutive days. The stability of sample solutions stored at room temperature was investigated by replicate injections of the sample solution at 0, 2, 4, 8, 12 and 24 h. Recovery test, after adding the known amounts of standards at low (50% of the known amounts), medium (same as the known amounts) and high (150% of the known amounts) levels into samples, was applied in triplicate to evaluate the accuracy of the method. The validation parameters of the method are shown in supplementary Table S2.
Statistical analysis
All the statistical calculations related to quantitative analysis were performed on Graph Pad Prism software version 5. All the analyses were done in triplicate and the values were expressed as mean ± SD.
Results and discussion
Optimisation of UPLC and MS conditions
The chromatographic conditions such as mobile phase and gradient programme were optimised systematically to improve the separation of the analytes in a short analysis time. The developed UPLC method for analysis of coumarin and related phenyl propanoids was found to achieve better resolution at shorter retention times compared to conventional HPLC. The TIC’s of the standards (1–5), cinnamon sample procured from the market (M-1) and authentic sample (M-6) are shown in , whereas the TIC’s of all the cinnamon samples are shown in supplementary Figure S1.
Figure 2. TICs of (a). Standard analytes positive and negative combined mode (1-coumarin, 2-scopoletin, 3-E-o-coumaric acid, 4-cinnamic acid and 5-cinnamaldehyde) (b). Cinnamon market sample M-1 and (c). Cinnamon authentic sample M-6.
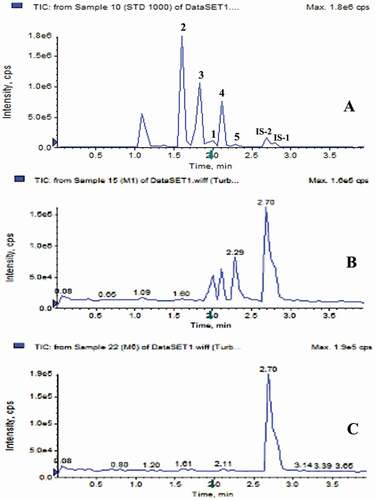
During tuning (Q1 scan), standards 2 and 3 in extracts and internal standard-1 (IS-1) exhibited good signal sensitivity in negative ionisation mode, whereas standards 1, 4 and 5, and internal standard-2 (IS-2) exhibited good signal sensitivity in positive ionisation mode. The ESI-MS/MS spectra of standards (1–5), for MRM method are shown in supplementary Figure S2.
Analytical method validation
The calibration curves indicated good linearity with correlation coefficients (r2) from 0.9991–0.9998, within the test ranges of 0.5–1000 ng/mL for the analytes. The LODs and LOQs were less than 0.36 and 0.81 ng/mL, respectively, assuring detection and quantification of the reference analytes at very low levels. In some investigations performed earlier, no coumarin was detected in samples of Ceylon cinnamon, probably due to a relatively poor LOD. [Citation12] The RSDs for the intraday and interday variations in precision were less than 2.10% and 2.11%, respectively, indicating that the method developed is suitable for the quantification of the selected analytes. The analytical method developed had good accuracy with overall recovery ranging from 95.45 to 104.43% (RSD ≤ 2.49%) for all the analytes. The results from the method validation are given in supplementary Table S2.
Coumarin content in cinnamon samples
Coumarin contents of authentic C. verum stem barks (M-6, 7, 8, 9 & 10) were in the range 12.3 to 143 mg/kg. The lowest coumarin content was detected in sample M-6 collected from C. verum plantation at Anjarakandy, Kannur, south India. This plantation was established by the British during the colonial period using the C. verum saplings introduced from Ceylon. [Citation1] The highest coumarin content in authentic C. verum stem barks was found in M-10 collected from JNTBGRI campus (143 mg/kg). Out of the five cinnamon samples procured from the market, four samples M-1, M-2, M-3 and M-4 purchased from retail shops in south India, showed high coumarin content, ranging from 819 to 3462 mg/kg, while the market sample M-5 purchased from an authentic spice trader showed low coumarin content (19.6 mg/kg) (, ).
Table 2. Content (mg/kg dry weight) of analytes in C. verum bark samples (mean ± SD, n = 3).
Figure 3. Coumarin content (mg/kg) in cinnamon samples (M-1 to M-10).
Previous studies have also reported low coumarin content in authentic C. verum samples and the quantity ranged from below the detection limit and up to 736 mg/kg dry plant weight. [Citation4,Citation6,Citation11] It is noteworthy that the cinnamon sample procured from the market (M-5) with low coumarin content was sold at almost three times the price of other samples with higher coumarin content. The results suggest possible blending of authentic samples with cheap substitutes from the genus Cinnamomum such as C. cassia and C. burmanii. C. cassia is a common adulterant to true cinnamon and generally market cinnamon samples with coumarin contents higher than 1700 mg/kg refer to cassia cinnamon (C. cassia). [Citation12] In the present study, the highest coumarin content in market samples was 3462 mg/kg, suggesting possible adulteration with C. cassia samples. Previous studies from Europe and the US reported that the dietary supplements using cinnamon market samples contained high amounts of coumarin, up to 2.5 and 3.9 mg per serving; in such cases, the coumarin intake may exceed the tolerable daily intake limit. [Citation12,Citation19,Citation20] As evident from the present study, the maximum coumarin content in authentic cinnamon sample is 0.143 mg/g, whereas the cinnamon sample procured from the market contains up to 3.462 mg/g coumarin.
Cinnamaldehyde content of cinnamon samples
Among the different secondary metabolites present in cinnamon, the phenyl propanoid cinnamaldehyde is the major constituent responsible for the aroma and spicy flavour. [Citation10] LC-MS methods have been reported for the estimation of cinnamaldehyde in solvent extracts of cinnamon samples. [Citation16,Citation21] C. verum stem bark collected from authentic sources (M-6 to M-10) showed cinnamaldehyde content ranging from 106 to 2330 mg/kg. The market samples M-1, M-2, M-3 and M-4 contained high amounts of cinnamaldehyde (5792 to 18580 mg/kg). It is significant to note that the high priced sample procured from the market (M-5) had the lowest cinnamaldehyde content of 2828 mg/kg which is comparable to the cinnamaldehyde content of authentic C. verum samples. It has been reported that the cinnamaldehyde content is higher in C. cassia compared with C. verum, and the high content of cinnamaldehyde in samples purchased from market indicated possible adulteration with C. cassia. [Citation6]
E-o-coumaric acid, scopoletin and cinnamic acid contents were also estimated. Except scopoletin, the other two compounds were found in higher quantities in market samples compared to authentic bark samples (). Remarkable variation in scopoletin content was not observed between market samples and authentic samples. Phenolic acids like cinnamic acid and E-o-coumaric acid were associated with sensory, nutritional and antioxidant properties of foods and also serve as markers in chemotaxonomy and maturation stages of plants. [Citation17,Citation22]
Conclusion
Recent analytical reports of cinnamon samples from different markets across the world revealed high contents of coumarin, which raised concerns over food safety. The present study also reports high content of coumarin in samples of cinnamon purchased from markets in south India, whereas the coumarin contents were comparatively very low in authentic cinnamon samples. Furthermore, the cinnamaldehyde content in the samples procured from the markets was also high compared to authentic samples. The study suggests that cinnamon bark of commerce from south India is highly adulterated with the barks of C. cassia containing unacceptable limits of coumarin and high content of cinnamaldehyde. In this context, the study is highly relevant as south India is a leading centre of cinnamon trade and an important consumer of cinnamon. The validated UPLC-ESI-QqQLIT-MS/MS method reported in the present study is highly sensitive, rapid and reproducible. This is the first report of validated estimation of the phenolic contents in south Indian cinnamon samples.
Supplemental Material
Download ()Acknowledgment
The authors wish to thank the Director, JNTBGRI, Thiruvananthapuram and Director, CDRI, Lucknow, India for the laboratory facilities.
Supplementary material
Supplemental data for this article can be accessed here.
Additional information
Funding
Related Research Data
References
- Ravindran, P. N.; Babu, N. K.; Shylaja, M. Cinnamon and Cassia: The Genus Cinnamomum; CRC Press: Boca Raton, Florida, 2004; 80–81.
- Purseglove, J. W.; Brown, E. G.; Green, C. L.; Robbins, S. R. J. Tropical Agricultural Series: Spices, Longman. Inc: New York. 1981; Vol. I. 100–101.
- Dhar, U.; Manjkola, S.; Bhatt, A. A.; Bisht, K.; Joshi, M. Current Status and Future Strategy for Development of Medicinal Plant Sector in Uttaranchal, India. Current Science. 2002, 83, 956–964.
- Lungarini, S.; Aureli, F.; Coni, E. Coumarin and Cinnamaldehyde in Cinnamon Marketed in Italy: A Natural Chemical Hazard? Food Additives and Contaminants Part A. 2008, 25, 1297–1305. doi: 10.1080/02652030802105274.
- Leela, N. K.;. Cinnamon and Cassia. In Chemistry of Spices, Parthasarathy, V. A., Chempakam, B., Zachariah, J. T. Eds.; CAB International: United Kingdom, 2008; pp124–145.
- Wang, Y. H.; Avula, B.; Nanayakkara, D. N. P.; Zhao, J.; Khan, I. A. Cassia Cinnamon as a Source of Coumarin in Cinnamon-Flavoured Food and Food Supplements in the United States. Journal of Agricultural and Food Chemistry. 2013, 61, 4470–4476. doi: 10.1021/jf4005862.
- EFSA. Coumarin in Flavourings and Other Food Ingredients with Flavouring Properties: Scientific Opinion of the Panel on Food Additives, Flavourings, Processing Aids and Materials in Contact with Food (AFC). EFSA Journal. 2008, 104, 1–36.
- FSSAI. Direction for Operationalization of Standards of Coumarin Content in Cinnamon: Notice of Operationalization of Standards of Cinnamon. In Food Security and Safety Authority of India. New Delhi, 2017.
- Lv, G. P.; Huang, W. H.; Yang, F. Q.; Li, J.; Li, S. P. Pressurized Liquid Extraction and GC-MS from Simultaneous Determination of Seven Components in Cinnamomum Cassia and the Effect of Sample Preparation. Journal of Separation Science. 2010, 33, 2341–2348. doi: 10.1002/jssc.201000208.
- He, Z. D.; Qiao, C. F.; Han, Q. B.; Cheng, C. L.; Xu, H. X.; Jiang, R. W.; But, P. P. H.; Shaw, P. C. Authentication and Quantitative Analysis on the Chemical Profile of Cassia Bark (Cortex Cinnamomi) by High Pressure Liquid Chromatography. Journal of Agricultural and Food Chemistry. 2005, 53, 2424–2428. doi: 10.1021/jf048116s.
- Sproll, C.; Ruge, W.; Andlauer, C.; Godelmann, R.; Lachenmeier, D. W. HPLC Analysis and Safety Assessment of Coumarin in Foods. Food Chemistry. 2008, 109, 462–469. doi: 10.1016/j.foodchem.2007.12.068.
- Woehrlin, F.; Fry, H.; Abraham, K.; Preiss-Weigert, A. Quantification of Flavouring Constituents in Cinnamon: High Variation of Coumarin in Cassia Bark from the German Retail Market and in Authentic Samples from Indonesia. Journal of Agricultural and Food Chemistry. 2010, 58, 10568–10575. doi: 10.1021/jf102112p.
- Rychlik, M.;. Quantification of Free Coumarin and Its Liberation from Glucosylated Precursors by Stable Isotope Dilution Assays Based on Liquid Chromatography-Tandem Mass Spectrometric Detection. Journal of Agricultural and Food Chemistry. 2008, 56, 796–801. doi: 10.1021/jf0728348.
- Krieger, S.; Hayen, H.; Schmitz, J. O. Quantification of Coumarin in Cinnamon and Woodruff Beverages Using DIP-APCI-MS and LC-MS. Analytical and Bioanalytical Chemistry. 2013, 405, 8337–8345. doi: 10.1007/s00216-013-7238-x.
- Spacil, Z.; Seifrtova, M.; Opletal, L.Solich, P. Rapid Qualitative and Quantitative Ultra-high Performance Liquid Chromatography Method for Simultaneous Analysis Of Twenty Nine Common Phenolic Compounds Of Various Structures. Talanta. 2010, 80, 1970–1979.
- Wu, H.; Guo, J.; Chen, S.; Liu, X.; Zhou, Y.; Zhang, X.; Xu, X. Recent Developments in Qualitative and Quantitative Analysis of Phytochemicalconstituents and Their Metabolites Using Liquid Chromatography-Mass Spectrometry. Journal of Pharmaceutical and Biomedical Analysis. 2013, 72, 267–291. doi: 10.1016/j.jpba.2012.09.004.
- Vallverdu-Queralt, A.; Regueiro, J.; Martinez-Huelamo, M.; Alvarenga, J. F. R.; Leal, L. N.; Lamuela-Raventos, R. M. A Comprehensive Study on the Phenolic Profile of Widely Used Culinary Herbs and Spices: Rosemary, Thyme, Oregano, Cinnamon, Cumin and Bay. Food Chemistry. 2014, 154, 299–307. doi: 10.1016/j.foodchem.2013.12.106.
- Dinesh, R.; Leela, N. K.; Zachariah, T. J.; Anandaraj, M. Controversies Surrounding Coumarin in Cassia: The Good, the Bad and the Not so Ugly. Current Science. 2015, 108, 482–484.
- Fotland, T. O.; Paulsen, J. E.; Sanner, T.; Alexander, J.; Husoy, T. Risk Assessment of Coumarin Using the Bench Mark Dose (BMD) Approach: Children in Norway Which Regularly Eat Oatmeal Porridge with Cinnamon may exceed the TDI for Coumarin with Several Folds. Food and Chemical Toxicology. 2012, 50, 903–912. doi: 10.1016/j.fct.2011.12.005.
- Ballin, N. Z.; Sorensen, A. T. Coumarin Content in Cinnamon Containing Food Products on the Danish Market. Food Control. 2014, 38, 198–203. doi: 10.1016/j.foodcont.2013.10.014.
- Jayaprakasha, G. K.; Rao, J. M. L. Chemistry, Biogenesis, and Biological Activities of Cinnamomum zeylanicum. Critical Reviews in Food Science and Nutrition. 2011, 51, 547–562. doi: 10.1080/10408391003699550.
- Robbins, R. J.;. Phenolic Acids in Foods: An Overview of Analytical Methodology. Journal of Agricultural and Food Chemistry. 2003, 51, 2866–2887. doi: 10.1021/jf026182t.