
 ?Mathematical formulae have been encoded as MathML and are displayed in this HTML version using MathJax in order to improve their display. Uncheck the box to turn MathJax off. This feature requires Javascript. Click on a formula to zoom.
ABSTRACT
The entire crystallization process and the effect of freezing rates on the temperature of spontaneous freezing (TSF) of living onion epidermal cells were analysed in this study. The cells, stained with iodine at a concentration of 1%, were frozen at three different freezing rates, i.e. 2, 1.2, and 0.5°C/min, and were thawed at 5°C/min. The higher freezing rate caused a higher TSF. Moreover, this article presents a method for determining whether a cell is inactivated by a plasmolysis experiment. The results of plasmolysis showed that the formation of ice crystals did not cause fatal mechanical damages to the cells, even when the freezing rate was as slow as 0.1°C/min. Finally, this article also demonstrated the grey-scale changes that occurred in the cells, as evidenced by an image processing technique. This further highlighted the ice crystal growth process and showed the ice crystal content at different locations inside the cells.
Introduction
Freezing is one of the most significant means for food preservation due to the lower rate of many deterioration reactions.[Citation1–Citation3] During the freezing process, many factors strongly influence the quality of food due to the formation and characteristics of ice crystals[Citation4–Citation7], such as their freezing rate, growing rate, and grain size, among which the freezing rate plays a crucial role.
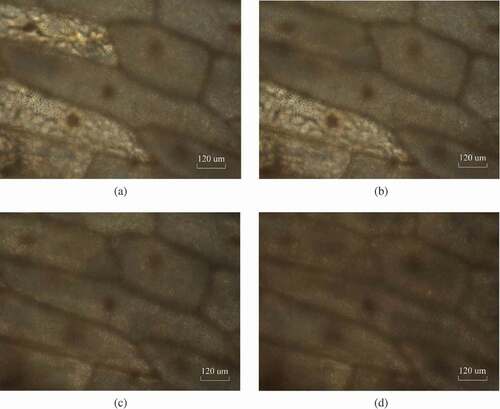
Figure 9. The thawing performance of the different freezing rates: (a) 0.5°C/min, (b) 1.2°C/min, and (c) 2°C/min.
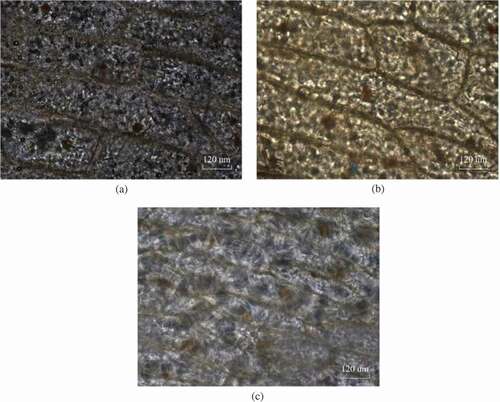
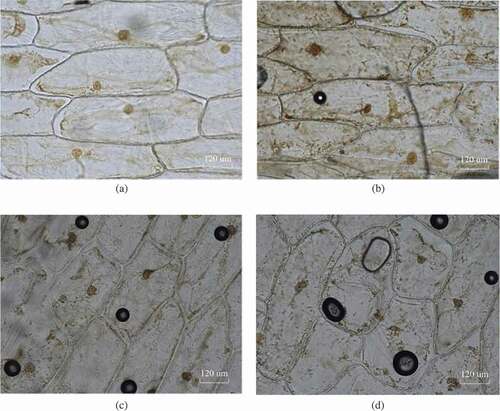
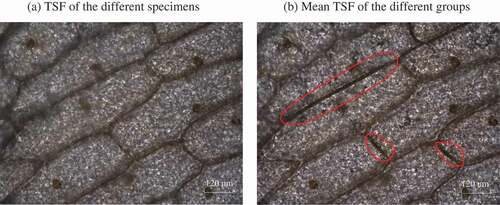
Figure 10. Cell plasmolysis after thawing at the different freezing rates: (a) 2°C/min, (b) 1.2°C/min, (c) 0.5°C/min, and (d) 0.1°C/min.
It is known that cells may experience significant contraction when cooled very slowly due to the dehydration caused by the growing ice mass in the already frozen cells[Citation8], which may also lead to fatal damage to the cells. Thus, many scholars endeavour to describe the effect of freezing rates on the mortality of cells.[Citation9–Citation12] However, most focus only on the influence of the intracellular freezing on the degree of injury to the cells or are committed to explain the mechanism of dehydration rather than the formation and growth of the intracellular ice crystals. Numerous studies explain the mechanism of ice crystal growth to improve the quality of frozen foods.[Citation13–Citation17] However, these studies have concentrated on the frozen cells at a late stage of the freezing process rather than the entire crystallization process.
In addition, the phenomenon known as ‘flashing’ was studied repeatedly, where the inside of the cell darkens spontaneously as the temperature drops to a certain point. Luyet and Gibbs reported, in detail, the continuous changes of the cell interior after a rapid freezing of onion epidermal cells.[Citation18] By means of the inoculation of ice crystals, Asahina gave a detailed description of the process of freezing and thawing in common plant cells, including intracellular freezing and extracellular freezing.[Citation8] Palta et al. investigated the retention of viability in onion tissue during freezing and thawing in 1977.[Citation19–Citation21] Despite all these excellent studies, due to the limitations of the experimental conditions, the experimental results do not accurately reflect the natural growth process of ice crystals.
Moreover, previous studies specifically report the growth behaviour of ice crystals of onion cells by various experimental methods. Brown et al. used a microscope with a videotape recorder to examine, in great detail, the behaviour of onion scale epidermal cells during repeated freezing and thawing of the same tissue in 1974 and 1980.[Citation22,Citation23] Tsuruta et al. also studied the effect of freezing rates on the initial freezing temperature of the onion epidermis using a cryomicroscope in 1996.[Citation24] Based on these studies, this article aimed to further observe the changes in the nucleus during freezing and identify whether this is the location of the ice nucleus by staining operations.
The main purpose of this article was to determine, with more certainty, where, when, and how freezing occurs in the cells using a CCD camera and to investigate the temperature of spontaneous freezing (TSF) at different freezing rates. Moreover, in order to further highlight the ice crystal growth process and to study the changes in the ice crystal content at different locations inside the cells, the grey value changes between adjacent images were calculated rather than showing the ice crystal content at a certain moment by means of a simple image processing technique. Finally, this article presents a method for determining whether a low freezing rate causes deadly mechanical damage to cells by a plasmolysis experiment.
Materials and methods
Staining preparation
Fresh purple onions with a uniform size and maturity were selected from an agricultural market in Tianjin, China. The second layer of the succulent scaly leaves of the onions adjacent to the outermost layer was chosen, which consists of monolayer cells of a large size. A scaly leaf square (10 × 10 mm) was cut out along the vertical and parallel vascular bundles with a blade. The inner skin was carefully peeled off with a tweezer to make temporary sections as the object of study. At last, the inner epidermal cells were stained with a lugo-iodine solution at a concentration of 1%, and the nucleus was seen clearly under a microscope.
Freezing and thawing process
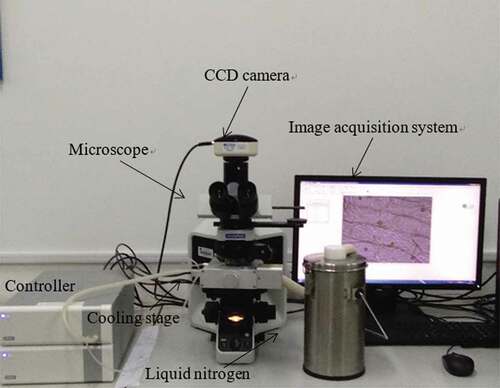
The stained onion epidermal cells, sandwiched between two cover slips, were placed onto an aLinkamTST350 cryostage, which was then charged with liquid nitrogen and connected to a computer. During the freezing and thawing process, an Olympus BX 53 microscope was used to observe the onion cell changes, and a CCD camera was used to capture the cell images. The magnification of the objective lens was 20×. The size of the images was 2560 × 1980 pixels. The experimental parameters were set as follows: the freezing rate was 2, 1.2, and 0.5°C/min. The thawing rate was 5°C/min. The temperature ranged from 20°C to −20°C and then from −20°C to 20°C. All the above parameters were controlled by the software Linksys32. The images near the ‘flashing’ were captured at a speed of 10 frames per second. To obtain effective and consistent experimental results, the experiment was repeated at least 8 times at each freezing rate, and the scale of the repetition was up to 30 times, taking three rates into account. In some cases, some of the duplicate results were inconsistent with our expectation, and the possible reasons and explanations for this are given in the Results and Discussion. The experimental setup is shown in , and the three experimental conditions are shown in .
Table 1. Three experimental conditions.
Figure 1. The experimental setup.
Plasmolysis experiment
It is well known that the occurrence of plasmolysis is an important criterion for judging whether cells lose their activity. Thus, a plasmolysis experiment was conducted after the freezing and thawing processes. The thawed cells were transferred to a slide. A sucrose solution, with a mass fraction of 0.3 g/ml, was dripped along the cover glass side, and after repeating this step and waiting for 3–5 min, we observed the phenomenon of plasmolysis under the same microscope.
Image processing
Image processing was performed as described by Stott et al. on selected frames that were extracted from the video.[Citation25] However, they only aimed to enhance the visibility of the intracellular phase boundary by adjusting the contrast and brightness. It is known that the location where the ice crystals appear inside the cell suddenly turns dark and opaque because of the scattering of the light by the intracellular ice crystals; that is, the captured images change to grey scale as a result. In addition, the volume of cells in the process of freezing changes to some degree, meaning that each pixel in the image has some displacements compared to where it was before. In fact, the grey values of adjacent pixels are so close that we can ignore the difference except for some of the boundaries. Therefore, it is feasible to signify changes in the ice crystal content at different locations during the ‘flashing’ process through the changes in grey scale.
A grey scale change detection method was proposed to monitor damage to materials, which can reflect the grey value change of each pixel point in the region of interest of the image by defining the normalized parameter C between the displacement and the grey value.[Citation26,Citation27] Inspired by this, this research endeavours to demonstrate the grey-scale changes that occur in frozen cells is presented by Equation (1) and Equation (2).
where C is the correlation coefficient. The larger the value of C is, the higher the content of the ice crystals. f(x, y) is the grey value of the pixel coordinate (x, y) in calculating the reference image after freezing, g(x*, y*) is the grey value of the pixel coordinate (x*, y*) in the adjacent image after the displacement of (x, y), and u(x, y) and v(x, y) are the horizontal and vertical displacements of (x, y), respectively. The interval between two adjacent images is 0.2 s.
Actually, the grey values of the adjacent pixels were so close that we ignored the displacements of the pixels except for some boundaries. For example, during the freezing process, the cell wall showed more obvious shrinkage, resulting in a larger displacement of pixels at the boundary. Thus, without regard to the cell wall, it is assumed that the displacement of the calculated points of the adjacent images is zero. Thus, the grey-scale changes that occurred in the frozen cells indicated the different ice crystal contents at various locations during the ‘flashing’ process.
Results and discussion
Ice crystal formation and growth
Entire crystallization process: From the images obtained, it was clearly seen that a phenomenon of ‘spontaneous freezing’ occurred in the cells as the temperature dropped to a certain point. For instance, when the freezing rate was 1.2°C/min and the temperature dropped to −15.1°C, the ice crystals were first seen to form on the cell wall facing the intercellular space, and then the elongated cells (i.e. the sharp and long cells) suddenly turned dark, as shown in . Subsequently, as shown in (), the ice crystals within the remaining cells grew rapidly, with fine dendritic branches or dark waves, and spread to the cell centre along the cell contour. The whole process lasted 1 s or so until all the cells within the observed field of view turned dark, as shown in ). Finally, these crystals rapidly united into larger pieces after their formation and continued to grow rather slowly, most of which surrounded the cell nucleus. Therefore, the nuclei and their vicinity became significantly darker than before, as shown in ).
Figure 2. Location of the ice crystals formed at the freezing rate of 1.2°C/min.
Additionally, the form that the ice crystals took on was also related to the freezing rate. For example, when the freezing rate was at 2°C/min, before the phenomenon of ‘flashing’ occurred, the cell sap was concentrated irregularly between the ice branches, and then, it was divided into a number of droplets like a net, as shown in ). This may be due to the appearance of a large number of extracellular ice crystals in the case of rapid freezing. A more specific explanation of this phenomenon is described in section 3.1.2. ) shows an image of the cells before ‘flashing’. Subsequently, some large ice crystals mainly arranged as an outside monolayer of cells formed, which was accompanied by the phenomenon of ‘flashing’, as shown in ,), which may be the frozen residues of the staining solution that remained on the cell surface.
Figure 3. Ice crystal growth at different times after ‘flashing’ at the freezing rate of 1.2°C/min.
There were also some exceptions when the freezing rate was 0.5°C/min or slower. When the freezing rate was as slow as 0.1°C/min, the cells exhibited a reticular conformation with many ice globules, as shown in ). ) is the reference image before ‘flashing’. Asahina ascribed that the intracellular freezing occurred after a considerable amount of ice formed on the cell surface. [Citation8] A more concrete understanding is described in section 3.1.2. In some cases, the formation of extracellular ice crystals was prior to that of the intracellular ice crystals at a higher temperature, as shown in ). ) is also a reference image before ‘flashing’. On the one hand, due to the tiny trembling of the test bench, which was caused by external factors, the extracellular ice crystals of the initial growth immediately spread to the surrounding area until large ice cubes appeared. On the other hand, the authors think it possible that the residues of the staining solution that remained on the cell surface froze earlier than the cells inside.
To gain a better understanding of how the ice crystals gradually grew, some images were selected for image processing, as shown in . It was obvious that the ice crystals first appeared on the cell wall facing the intercellular space and then extended along the cells’ contour. Furthermore, the content of the ice crystals in the elongated cells was much more than the rounded cells. The growth process of the ice crystals was also consistent with that described above, which it made more intuitive to observe this by means of image processing techniques.
Figure 4. Ice crystal growth near the ‘flashing’ at the freezing rate of 2°C/min when the temperature was: (a) −9.2°C, (b) −9.6°C, (c) −9.8°C, and (d) −10°C.
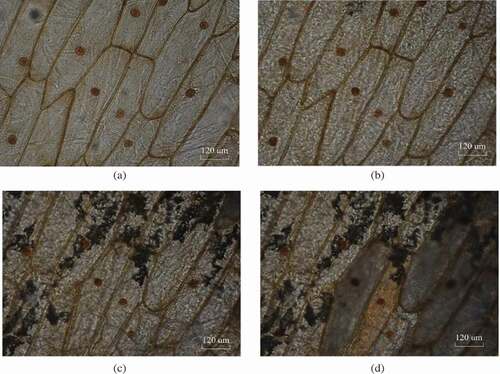
Figure 5. Ice crystal growth at a slower freezing rate. (a) 0.1°C/min, −16.7°C, (b) 0.1°C/min, −16.8°C, (c) 0.5°C/min, −10.5°C, and (d) 0.5°C/min, −11°C.
It is worth mentioning that the damages in the material can be reflected by changes in the crystals’ size. Furthermore, a quantitative relationship between the degree of damage and the deformation variables can also be built. However, as described above, as well as in published literature, the ice crystals grew around the ice core, with fine dendritic branches. In particular, the ice crystals were generally irregular, and thus, it was difficult to characterize the material damage according to the diameters of the ice crystals.
TSF and space changes between the cell wall: The TSF varied with the freezing rate. On the whole, the higher the freezing rate was, the higher the TSF became, as shown in . Generally, it is agreed that slower freezing induces the formation of large ice crystals, mostly in the extracellular regions, while the intracellular crystals are much smaller and more finely distributed during rapid freezing than those in slow freezing.[Citation9,Citation28–Citation31] According to the Ostwald ripening model, the free water in the cell gap freezes first at a slow freezing rate, which results in a vapour pressure inside and outside the cell. This makes intracellular water flow to the ice crystals, and they gradually form larger ice crystals. Upon rapid freezing, the ice crystals within the cell progress so fast that the formation of large ice crystals is prevented by blocking the extracellular flow of water. Thus, as observed in our study, small ice crystals rapidly formed and were evenly distributed in the cell tissue. As the temperature dropped, these small ice crystals quickly united into large ice crystals, and the cells suddenly froze entirely.
Figure 6. Grey changes at the moment of ‘flashing’ during the ice crystal formation process at a freezing rate of 1.2°C/min using the image processing method (the scale of each plot refers to the range of grey values for all the pixels in each image).
Interestingly, when the freezing rate was rather slow, the space between the cell walls slightly increased, as shown in . This was because, on the one hand, the volume increased as the ice crystals formed between the spaces of the cell walls, and on the other hand, the dehydration by the growing ice mass in the neighbouring frozen cells, to some extent, resulted in a fairly large contraction of the cell together with its wall. As the temperature decreased rapidly, the cells became super-cooled, and the remaining intracellular water froze before it had time to diffuse out of the cell.[Citation32]
It should be noted that the images used in the article have better examples in the experiments, but the quality of some of the images was slightly unsatisfactory. Due to the influence of the staining operation, transferring the cells into crystages and switching between two cover slips, the cells were extremely contaminated with impurities, and the monolayers sometimes folded, which largely affected the quality of the images observed.
Thawing performance
Upon thawing, the ice crystals immediately turned into the form of ice drops among all the frozen cells. The substance of the onion cells had a sponge-like appearance, representing the places that had been occupied by ice. The thawing performance of the different freezing rates is shown in .
Figure 7. Temperature of spontaneous freezing of the onion epidermal cells at three different freezing rates.
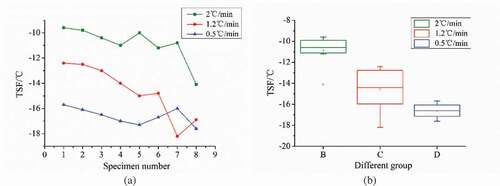
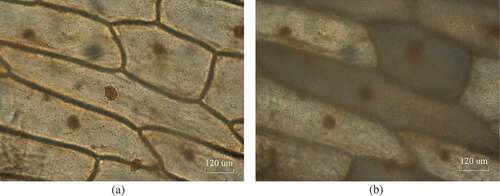
Figure 8. Changes of the cell wall gap in the frozen cells at a freezing rate of 0.1°C/min when the temperature was: (a) −16.8°C, (b) −17.3°C.
Plasmolysis
According to the interpretation of the maximum ice crystal formation zone, approximately 80% of the water in most fruits and vegetables can form ice crystals within a temperature range from −1°C to 5°C. The time to the maximum ice crystal formation zone affects the quality of the fruits and vegetables. If the freezing rate is too slow, the volume increases by 9–10%, due to the formation of columnar or massive granular ice crystals within the onion cells, resulting in mechanical damage to the cells or quality deterioration. Therefore, the plasmolysis experiment was conducted after the thawing process to judge whether the cells were still alive or not. In addition, in case that the freezing rate was reduced to a certain degree that the cytoplasm and nucleus were apparently disintegrated, and the frozen area containing these cell constituents was always darker than pure ice.[Citation29]
Thus, this study first set the freezing rate at 0.1°C/min, and the thawing rate remained constant. The above steps were repeated under different freezing rates, and the images observed under the microscope are shown in , which demonstrated that the cells had a plasmolysis, and the cells were still active even though they were subjected to the above four different freezing rates. Therefore, the results of the plasmolysis experiment showed that the cells did not lose their activity when the freezing rate was as slow as 0.1°C/min. That is, the formation of the ice crystals did not cause fatal mechanical damage to the cells.
Conclusion
In this article, the ice crystal growth process of onion epidermal cells under different freezing rates was investigated in detail. The freezing experiments showed that the slower the freezing rate was, the lower the TSF became. The ice crystals first formed on the cell wall facing the intercellular space. Moreover, the cells with poor roundness suddenly turned black, and the ice crystals grew rapidly with fine dendritic branches or dark waves and spread to the cell centre along the cell contour. Moreover, this article highlighted the grey-scale changes that occurred in the frozen cells, indicating the different ice crystal contents by image processing techniques. In addition, a method to judge whether the cells lost their activity or not was proposed by plasmolysis. The results of the plasmolysis showed that the formation of ice crystals did not cause fatal mechanical damage to the cells, even when the freezing rate was as slow as 0.1°C/min.
Additional information
Funding
Related Research Data
References
- Kim, Y.H.; Liesse, C.; Kemp, R.; Balan, P. Evaluation of Combined Effects of Ageing Period and Freezing Rate on Quality Attributes of Beef Loins. Meat Science, 2015, 110, 40–45.
- Sigfusson, H.; Ziegler, G. R.; Coupland, J. N. Ultrasonic Monitoring of Food Freezing. Journal of Food Engineering, 2004, 62(3), 263–269.
- Zhang, X.; Chu, X.; Ji, H.; Wang, Y. Effect of Freezing Rate on the Onion Cell Deformation Evaluated by Digital Image Correlation. Food Analytical Methods, 2016, 9(11), 3125–3132.
- Alizadeh, E.; Chapleau, N.; de-Lamballerie, M.; Le-Bail, A. Impact of Freezing Process on Salt Diffusivity of Seafood: Application to Salmon (Salmo Salar) Using Conventional and Pressure Shift Freezing. Food and Bioprocess Technology, 2008, 2(3), 257–262.
- Martino, M.N.; Otero, L.; Sanz, P.D.; Zaritzky, N.E. Size and Location of Ice Crystals in Pork Frozen by High-Pressure-Assisted Freezing as Compared to Classical Methods. Meat Science, 1998, 50(3), 303–313.
- Martino, M. N.; Zaritzky, N. E. Fixing Conditions in the Freeze Substitution Technique for Light Microscopy Observation of Frozen Beef Tissue. Food Microstructure, 1986, 5(1), 19–24.
- Petzold, G.; Aguilera, J. M. Ice Morphology: Fundamentals and Technological Applications in Foods. Food Biophysics, 2009, 4(4), 378–396.
- Asahina, E.;. The Freezing Process of Plant Cell; Contributions from the Institute of Low Temperature Science, 1956; Vol. 10, pp 83–126.
- Kaale, L.D.; Eikevik, T M.; Bardal, T.; Kjorsvik, E.; Nordtvedt, T S. The Effect of Cooling Rates on the Ice Crystal Growth Inair-Packed Salmon Fillets during Superchilling Andsuperchilled Storage. International Journal of Refrigeration, 2013, 36(1), 110–119.
- Mazur, P.;. Freezing of Living Cells: Mechanisms and Implications. American Journal of Physiology, 1984, 247(3 Pt 1), C125.
- Mcgrath, J. J.; Cravalho, E. G.; Huggins, C. E. An Experimental Comparison of Intracellular Ice Formation and Freeze-Thaw Survival of HeLa S-3 Cells. Cryobiology, 1975, 12(6), 540–550.
- Seki, S.; Mazur, P. The Temperature and Type of Intracellular Ice Formation in Preimplantation Mouse Embryos as a Function of the Developmental Stage. Biology of Reproduction, 2010, 82(6), 1198–1205.
- Do, G.-S.; Sagara, Y.; Tabata, M.; Kudoh, K-I.; Higuchi, T. Three-Dimensional Measurement of Ice Crystals in Frozen Beef with a Micro-Slicer Image Processing System. International Journal of Refrigeration, 2004, 27(2), 184–190.
- Pegg, D. E.;. The Relevance of Ice Crystal Formation for the Cryopreservation of Tissues and Organs. Cryobiology, 2010, 60(3 Suppl), S36–44.
- Payne, S.R.; Sandford, D.; Harris, A.; Young, O.A. The Effects of Antifreeze Proteins on Chilled and Frozen Meat. Meat Science, 1994, 37(3), 429.
- Chen, Y. L.; Pan, B. S. Morphological Changes in Tilapia Muscle following Freezing by Airblast and Liquid Nitrogen Methods. International Journal of Food Science & Technology, 1997, 32(2), 159–168.
- Woinet, B.; Andrieu, J.; Laurent, M.; Min, S.G. Experimental and Theoretical Study of Model Food Freezing. Part II. Characterization and Modelling of the Ice Crystal Size. Journal of Food Engineering, 1998, 35(4), 395–407.
- Luyet, B. J.; Gibbs, M. C. On the Mechanism of Congelation and of Death in the Rapid Freezing of Epidermal Plant Cells. Protoplasma, 1938, 30(1), 319–419.
- Palta, J. P.; Levitt, J.; Stadelmann, E. J. Freezing Tolerance of Onion Bulbs and Significance of Freeze-Induced Tissue Infiltration. Cryobiology, 1977, 14(5), 614.
- Palta, J. P.; Levitt, J.; Stadelmann, E. J. Freezing Injury in Onion Bulb Cells: II. Post-Thawing Injury or Recovery. Plant Physiology, 1977, 60(3), 398–401.
- Palta, J. P.; Levitt, J.; Stadelmann, E. J. Freezing Injury in Onion Bulb Cells. Plant Physiology, 1977, 60(3), 398–401.
- Brown, M. S.; Pereira, E. S.; Finkle, B. J. Freezing of Nonwoody Plant Tissue: II. Cell Damage and the Fine Structure of Freezing Curves. Plant Physiology, 1974, 53(5), 709–711.
- Brown, M. S.;. Freezing of Nonwoody Plant Tissues. IV. Nucleation Sites for Freezing and Refreezing of Onion Bulb Epidermal Cells. Cryobiology, 1980, 17(2), 184–186.
- Tsuruta, T.; Kawamizu, T.; Nonaka, I.; Masuoka, T.; Experimental Study on Freezing of Onion Skin Cells: Intracellular Ice Formation and Dehydration with Extracellular Solution. Nihon Kikai Gakkai Ronbunshu B Hen/transactions of the Japan Society of Mechanical Engineers Part B, 1996, 62(598), 2446–2451.
- Stott, S. L.; Karlsson, J. O. Visualization of Intracellular Ice Formation Using High-Speed Video Cryomicroscopy. Cryobiology, 2009, 58(1), 84–95.
- Zhang, X.; Yang, G.; Zhan, N.; Ji, H. Gray Change Detection Method for Damage Monitoring in Materials. Applied Optics, 2015, 54(4), 934–939.
- Zhang, X.; Wang, Y.; Yang, J.; Qiao, Z.; Ren, C.; Chen, C. Deformation Analysis of Ferrite/Pearlite Banded Structure under Uniaxial Tension Using Digital Image Correlation. Opt. Lasers Eng., 2016, 85, 24–28.
- Bevilacqua, A.; Zaritzky, N. E.; Calvelo, A. Histological Measurements of Ice in Frozen Beef. Optics & Lasers in Engineering, 1979, 14(3), 237–251.
- Kerr, W.L. Texture in frozen foods. In: Handbook of Frozen Foods. (Hui, Y.H.; Cornillon, P.; Legaretta, I.G.; Lim, M.H.; Murrell, K.D.; Nip, W.K. eds.), 2004, NewYork: Marcel Dekker, 149–168.
- Kaale, L.D.; Eikevik, T M.; Bardal, T.; Kjorsvik, E. A Study of the Ice Crystals in Vacuum-Packed Salmon Fillets (Salmon Salar) during Superchilling Process and following Storage. Journal of Food Engineering, 2013, 115(1), 20–25.
- Dong, X.L.; Zhang, C.; Feng, X.; Duan, Z. Analysis and Improvement of Accuracy, Sensitivity, and Resolution of the Coherent Gradient Sensing Method. Applied Optics, 2016, 55(17), 4752–4758.
- Kaale, L.D.; Eikevik, T M.; Rustad, T.; Nordtvedt, T S.; Bardal, T.; Kjørsvik, E. Ice Crystal Development in Pre-Rigor Atlantic Salmon Fillets during Superchilling Process and following Storage. Food Control, 2013, 31(2), 491–498.