
 ?Mathematical formulae have been encoded as MathML and are displayed in this HTML version using MathJax in order to improve their display. Uncheck the box to turn MathJax off. This feature requires Javascript. Click on a formula to zoom.
ABSTRACT
Starches isolated from seven different cereals were evaluated for their composition, physicochemical, in vitro digestibility, structural, morphological, and pasting properties. The in vitro starch digestion rate and estimated glycemic index (GI) of cereal starches were evaluated along with the impact of cooking on starch digestion. The cooking of starch slurries increased the rapidly digestible starch content from a range of 34.7–54.4% to a range of 60.5–78.5%. On the basis of hydrolysis index, the GI ranged from 83.6 to 91.8 and after cooking it increased from 95.1 to 98.6 for different cereal starches. Both the swelling power and solubility showed an increasing trend with rising temperature. Paste clarity of starches negatively correlated with fat content. The amylose content of various starches ranged from 17.7 to 24.7% and was negatively correlated to crystalline index (r = -0.975, p ≤ 0.05). XRD pattern revealed A-type pattern of crystalline starch, where crystallinity index ranging between 28.2 to 44.9%. FTIR revealed slight differences among chemical bonding of starches from different cereals. From scanning electron micrograph observations, wheat and barley starch granules proved smoother as compared to other cereal granules. Barley contained the highest (27.5 µm) and rice had the lowest (10.2 µm) size starch granules. The pasting properties were significantly (p ≤ 0.05) different for different cereal starches. Peak, breakdown, and final viscosities were the highest for maize starch (1725, 384, and 2112 mPa.s, respectively), whereas rice and oats exhibited the highest trough and setback viscosities (1420 and 954 mPa.s, respectively).
Introduction
Starch is the principle storage carbohydrate of various crops and is abundantly found in nature. Starch is added to the food products as the functional ingredient as it related to the characteristic properties of the food. Among the different plant species, the chemical compositions, morphologies, and the molecular structures of starches are different.[Citation1] In both food and non-food industries, starch is substantially used biopolymer.[Citation2] Extensive advancement has been made in analysing the physicochemical, functional, and rheological properties of starches obtained from non-conventional origin.[Citation3] Starch is viewed as the distinct granules being embedded in the protein matrix within the endosperm of the kernel. The use of starch in different food applications is attributed to its unique physicochemical and functional characteristics and varies with the biological origin.[Citation4] The textural properties of most foods are greatly influenced by starch and have many industrial applications such as colloidal stabilizer, gelling agent, water retention agent, bulking agent, and adhesive. Many studies had been accomplished on rheological, textural, morphological, and thermal properties of starches which added new value to the products.[Citation5,Citation6] Among the starches from various species, the starch granules showed variation in the packing of amylose and amylopectin. Evidently, swelling belongs to the amylopectin content. The amylopectin content influenced the crystallinity of starches and therefore governs the onset of swelling and gelatinization, while the amylose content mainly represents amorphous region.[Citation7] The recognition of pasting properties is a vital measure of the processing condition of foods and their constituents. For instance, such understanding encourages a processor in optimizing concentration of ingredients and pressure–temperature–shear limits to attain a product of required uniformity. The pasting involves starch undergo a change that arise after gelatinization upon additional heating results in furthermore swelling of starch granules, leaching out of the molecular constituents from the granules and simultaneously the granules get disrupted due to the application of shear forces.[Citation8] The studies on the attribute of crystalline structure of starches have been encompassed by X-ray diffraction (XRD).[Citation3] Fourier transform infrared spectroscopy (FTIR) analysed the nature of already existed, newly formed, and broken chemical bonds. Englyst et al.[Citation9] classified starch into fractions, that is, rapidly digestible starch (RDS), slowly digestible starch (SDS), and resistant starch (RS) and have evaluated that extent of starch hydrolysis correlates with glycemic index (GI) of food products. Scanning electron microscopy (SEM) has been utilized to correlate morphology of granule to starch genotype.[Citation10] SEM has been a convenient device for analysis the microstructures of cereal grains, flour, and derived products.[Citation11] SEM has also described the relation of paste structures to paste properties.[Citation12] The study was undertaken to evaluate the proximate composition, physicochemical, in vitro digestibility, granular morphology, pasting, and crystalline properties of starches isolated from different cereal grains. By evaluating these various properties of starches, we can enhance their applications in food industries for representing appropriate processing practices of different food products.
Materials and methods
Materials
Seven cereal crops, wheat (Triticum aestivum), rice (Oryza sativa), maize (Zea mays), barley (Hordeum vulgare), oats (Avena sativa), sorghum (Sorghum bicolor), and millets (Pennisetum glaucum) from 2015 harvest commonly grown in Punjab state were obtained from Punjab Agriculture University, Ludhiana, India. The grains were cleaned to remove dirt, foreign material, and any damaged seeds and then stored at 20°C until further use. The chemical and reagents were used of the analytical grade. All enzymes used in this study were procured from Sigma-Aldrich (Taufkirchen, Germany). Milli-Q water was used for experiments.
Starch isolation
Starch from different cereals isolated by using different method. Whole corn of about 500 g was steeped in 1.25 L of distilled water containing sodium hydrogen sulphite (0.1% SO2) at 50 ± 2°C for 18–20 h and then starch was obtained using the method of Sandhu et al.[Citation13] Wheat was milled by using Brabender Quadrametric Junior Mill (Duisberg, Germany) to obtain wheat flour. Then the wheat starch was isolated by following the method of Singh et al.[Citation14] The rice was milled to remove bran and then steeped in 5–6 volumes of sodium hydroxide (0.2–0.3%) at 25°C for 24 h to soften the endosperm and starch was isolated according to the method proposed by Sodhi and Singh.[Citation15] About 1 kg of millet grains was added to water at ratio 1:6 and starch was obtained as the method described by Adebowale et al.[Citation16] Other cereals oats, barley, and sorghum were also steeped in water in different ratio with intermittent circulation of water and then starch was isolated according to the methods reported by Hoover and Vasanthan,[Citation17] Vasanthan and Bhatty,[Citation18] and Beta et al.,[Citation19] respectively.
Chemical analysis
Starch samples from different cereal grains were estimated for their protein, moisture, ash, fat, and fibre contents by standard methods of analysis.[Citation20] Amylose content of different isolated starches was measured by using the procedure of Williams et al.[Citation21]
Swelling power (SP) and solubility
SP and solubility of different starches were determined according to the method of Leach et al.[Citation22] The aqueous suspension (1%) of starch (100 ml) was heated at 55, 65, 75, 85, and 95°C with constant stirring in a water bath for 1 h. The suspension was allowed to cool at 30°C for 30 min. Then the sample was transferred to the preweighed centrifuge tubes, centrifuged for 10 min at 3000 × g and the weight of sediment was measured. To determine the solubility, the supernatants were transferred to petridishes and evaporated in hot air oven at 110°C for 12 h, cooled to room temperature in a dessicator and weigh the dry solids.
Light transmittance
The light transmittance of different starches was measured according to the method of Perera and Hoover.[Citation23] The aqueous suspension (1%) of starch was heated at 90°C with constant stirring for 1 h in a water bath. The suspension was allowed to cool at 30°C for 1 h. The samples were kept for 5 days in a refrigerator at 4°C and after every 24 h, the absorbance was measured at 640 nm against distilled water used as blank with a UV/VIS spectrophotometer (Shimadzu, UV-1800, Japan) to determine the light transmittance.
Pasting properties of starches
Pasting properties of different starches were determined by using Rapid Visco-Analyser (Model RVA-3, Newport Scientific Pvt. Ltd., Australia). The starch sample of 3 g was mixed with 25 ml of distilled water in the RVA sample canister to make a starch suspension of 28 g. The time temperature consists of a heating phase of sample ranged from 50 to 95°C at 6°C/min after 1 min of equilibrium time at 50°C and then 5 min of holding step at 95°C. After that the cooling was done from 95°C to 50°C at 6°C/min with 2 min of holding phase at 50°C. The parameters that recorded were pasting temperature (PT), peak viscosity (PV), hold viscosity, final viscosity, breakdown viscosity (BV; PV - trough viscosity), and setback viscosity (final viscosity - trough viscosity).
Scanning electron microscopy
The morphology of different starches was determined by scanning electron microscope (JSM-6100 Scanning Electron Microscope (ZEOL, USA). Scanning electron micrographs were obtained at 1000 X (1000 times magnified) with a scanning electron microscope by following the method described by Wani et al.[Citation24] after coated with gold-palladium (60:40) (Ion sputter JFC-1100, JEOL, USA). An accelerating potential of 10 kV was used during micrography.
X-ray diffraction
X-ray diffractograms of different starch samples were measured using an analytical X-ray diffractometer (RigakuMiniflex, Japan) having CuKα source, with a wavelength of λ = 1.54 Å functioning at 45 kV and 40 mA. X-ray diffractograms were obtained at 25°C in the 2ϴ angle range of 4–30°C with a step size of 0.02 and 10 s scan speed. The MS excel data were exported to (OriginPro 8E, OriginLab, USA) software for graph creation. The crystalline index (%) and d-spacing index of different starches were calculated by the methods of Lionetto et al.[Citation25] and Zhang et al.,[Citation26] respectively.
Fourier transform infrared spectroscopy
FTIR spectrum was performed on Fourier transform spectrophotometer (PerkinElmer FTIR-C92035, USA) with wave number in the range of 400–4000 cm−1 using KBr pellet method. The graph was created by exporting MS excel data sheet to OriginPro, 8E (OriginLab, USA) software.
Particle size analysis
Particle size distribution of different cereal starches were determined by using laser-light particle size analyser (S3500, Microtrac Inc., USA) provided with delivery system for dry samples (Microtrac Turbotrac SDC, Microtrac Inc., USA).
In vitro starch digestibility
In vitro digestibility of raw and cooked starch slurries were determined according to the method established by Englyst et al.[Citation9] with minor modifications. Then the RDS, SDS, and RS were analysed on the basis of their digestion rates. The kinetics of starch hydrolysis and excepted GI were determined by non-linear model described by Goni et al.[Citation27] (1997). According to first order equation:
where C, C∞, and k represented the percentage of starch hydrolysis at time t, maximum starch hydrolysis after 180 min, kinetic constant, and t is the time (min). The variable C∞ and k were estimated for all samples based on the data acquired from the in vitro hydrolysis procedure.
The hydrolysis index (HI) was obtained by dividing the area under the hydrolysis curve of each sample by the corresponding area of a reference sample (fresh white bread). According to Goni et al.,[Citation27] the HI is good predictor of glycemic response. The estimation of expected GI was done by using the model
Statistical analysis
The data reported in all the tables are averages of triplicate observations. The data were subjected to statistical analysis using Minitab Statistical Software version 17 (Minitab Inc., USA).
Results and discussion
Chemical analysis of starches
The chemical composition of starches isolated from different cereals is shown in . The moisture content of different starches varied from 11.2 to 13.8%. The moisture content of different starches less than 14% is generally considered as safe for long storage.[Citation28] A significant difference (p ≤ 0.05) was observed in protein content of starches obtained from different cereals. The higher protein content of millet and barley might be due to the presence of some insoluble proteins associated with starch granules, which did not remove during extraction process. Similar results for millet protein were also reported by Wankhede et al.[Citation29] The fat content of different starches varied from 0.07 to 0.44% and significant difference (p ≤ 0.05) was reported among different cereals. Sorghum starch had the highest ash content (0.60%) followed by barley (0.30%), which was nearly half than former. The variation in chemical composition of different starches may be attributed to the different isolation methods and different cereal types. The low protein and ash content described the purity of isolated starches.
Table 1. Chemical analysis of different cereal starches (dwb).
The amylose content varied significantly (p ≤ 0.05) among different starches () and varied from 17.7% to 24.7%, where oats had the highest and millet showed the lowest value. Resurreccion et al.[Citation30] reported that during development, the high temperature leads to low amylose content. The results for maize, millets, and barley starch are compatible with those described by Sandhu and Singh[Citation31], Wankhede et al.,[Citation29] and Pycia et al.,[Citation32] respectively.
SP and solubility of starches
The SP and solubility of different starches measured from 55 to 95°C at 10°C interval ( and respectively). SP and solubility refers to evaluate the degree of association between amylose and amylopectin chains, confines to amorphous and crystalline regions of the starch granule.[Citation33] There was a simultaneous rise in SP and solubility of various cereal starches as the temperature increased from 55 to 95°C. The starch granules swell constantly till the slurry temperature exceeds the gelatinization range. The heating of starch in free water leads to disruption of crystalline structure of starch granules and therefore, water molecules associated to the hydroxyl groups of amylose and amylopectin by hydrogen bonding that induce an increase in SP and solubility. Millet starch reveals the highest SP and solubility while barley starch exhibits the lowest. The potency of starch granules increased which strengthens the diffusion of starch particles in water.[Citation15] Similar trends of increased SP and solubility with increased temperature was found for millet starch[Citation29], barley and potato starch[Citation34], rice starch,[Citation35] and corn starch.[Citation36] The difference in structure of starch granules may contribute to variations within the SPs and solubility of different cereal starches. Kaur et al.[Citation37] observed that the large, asymmetric, or cuboidal starch granules confined to increased SP and decreased solubility for potato starches.
Table 2. Swelling power (g/g) of different cereal starches.
Table 3. Solubilities (%) of various starches.
Light transmittance
shows the effect of storage on paste clarity of starches from various cereals. It has been observed that as the storage period increased, the light transmittance of starch paste from different cereals decreased. Among the different cereal starches, wheat starch showed the maximum light transmittance while oat starch had the lowest. The light transmittance of starch pastes decreased on storage due to the recrystallization of starches. The variations in the light transmittance values may be attributed to the variation in remainder of the swollen granule in the starches that refract light to different degrees and therefore results in distorted images.[Citation38] The results are compatible to Singh et al.[Citation39] for rice, Shaikh et al.[Citation40] for millets, and Gujral et al.[Citation41] for barley.
Table 4. Light transmittance % of starches from different cereals.
Pasting properties of starches
The pasting properties of starches obtained from different cereals are shown in . The pasting attributes are useful in the choice of product for use in the industry as a binder, thickener, or for any other purpose. The selection process also related to the viscosity of the gel formed during and after heating. PT signifies the minimum temperature demanded to cook the flour. PT of starches ranged from 75.2 to 89.6°C. The oat starch had the highest PT followed by barley, wheat, and rice starch. The lowest PT was found for maize starch. The PT values for maize starch, and oat starch were identical to the values that reported by Sandhu and Singh[Citation31] for maize starch and Hoover et al.[Citation42] for oat starch. PV appeared at the equilibrium point between swelling and polymer leaching due to which viscosity increased and then polymer alignment rupture which cause it to decrease. The PV was observed higher for maize starch (1725 mPa s) and lower for barley starch (1186 mPa s). The maize starch showed the lowest PT (75.2°C) as compared to the other starches. Therefore, it showed that maize starch has the highest water holding capacity and can swell more readily than other starches and highest PV developed at lowest PT. Similar results for were reported by Ashogbon and Akintayo[Citation43] for legume starches. Due to amylose retrogradation, hardening of cooled starch suspensions is the setback viscosity and it ranged from 314 to 954 mPa s (). BV represents the ability of swollen granules to rupture. BV was significantly (p ≤ 0.05) higher for maize starch (384 mPa s) and lowest for rice starch (153 mPa s). The starches with highest BV have less ability to resist heat and shear stress on cooking. Therefore, rice starch could be efficient to resist heat and shear stress as compared to maize starch. BV affects the strength of starch pastes. SV of different starches ranged from 314 mPa s to 954 mPa s which was lowest for rice starch and highest for oat starch. On cooling, the cooked rice starch paste was stable which showed by its lowest setback viscosity. The lowest setback viscosity of rice starch showed its high resistance to retrogradation. Final viscosity is the tendency of the material to form viscous paste determined by retrogradation of soluble amylase on cooling and it ranged from 1397 to 2112 mPa s which was highest for maize starch and lowest for barley starch. Pasting properties rely on the rigid nature of starch granules, which affect the ability of granule swelling[Citation44] and leaching out of the amylose from the solution.[Citation45]
Figure 1. Pasting properties of starches from different cereals. (A) Wheat (WH-1105), (B) Rice (PR-123), (C) Oats (OL-9), (D) Maize (Super-777), (E) Barley (PL-426), (F) Sorghum (Sudex), and (G) Millets (FBC-16). η: viscosity and T: temperature.
Granular characteristics
The laser light diffraction analysis of different cereal starches are shown in . The size distribution of starches with proportion of ˂10 µm size were 2.96, 3.7, 5.96, 9.64, 24.87, 36.46, and 46.99%, respectively, while that of >10 µm size were 97.04, 96.3, 94.04, 90.3, 75.13, 63.45, and 53.01%, respectively, for sorghum, barley, maize, wheat, millets, rice, and oats starches. Scanning electron micrographs of starches isolated from different cereals are shown in . SEM reveals the relevant variations in the size and shape of granular structure of wheat, rice, oat, maize, barley, sorghum, and millets starches. A-type starch granules of barley were observed to be largest in size (27.5 µm) followed by wheat (26.4 µm), sorghum (21.4 µm), maize (18.5 µm), millet (18.1 µm), oat (13.7 µm), and rice (10.2 µm). B-type starch granules of sorghum were found to be largest in size (8.9 µm) followed by wheat (8.13 µm), millet (5.9 µm), maize (5.3 µm), barley, oat (4.5 µm), and rice (4.1 µm). The surface of wheat and barley starch granules were viewed smoother as compared to rice, maize, oat, millet, and sorghum starches. The wheat starch showed the presence of spherical, lenticular shaped, and large disc like granules having large proportion of A-type granules and small proportion of B-type granules. Baum and Bailey[Citation46] reported that wheat endosperm consist of two types of starches during maturity, that is, large (A-type) and small (B-type). The granules of rice were observed to be polygonal, hexagonal, irregular, and angular shaped. The gelatinization and cooking of larger starch granules required more time as the penetration of heat and moisture to the centre of the granules take more time. The oat starch exhibits the presence of irregular and oval shaped granules with diameter ranged from 4.5 to 13.7 µm. Morphologically, the oat and rice starch are somewhat similar, but the oat starch contains large granules as compared to rice starch. The granules of barley starch were found to be cuboidal, oval, irregular, and morphologically similar to wheat starch. The granules of maize starch were angular shaped while round and polygonal for sorghum starch with heterogeneous size range. The millet starch was polygonal and irregular in shape. The shape and size of various starches varied due to their biological origin.[Citation4] The biochemistry of chloroplast and physiology of plant also effect the morphology of starches.[Citation47]
Figure 2. Particle size distribution of starches from different cereals.
Figure 3. Scanning electron micrographs (SEM) of starches isolated from different cereals. (A) Wheat (WH-1105), (B) Rice (PR-123), (C) Oats (OL-9), (D) Maize (Super-777), (E) Barley (PL-426), (F) Sorghum (Sudex), and (G) Millets (FBC-16) (bar = 20 µm).
X-ray diffraction
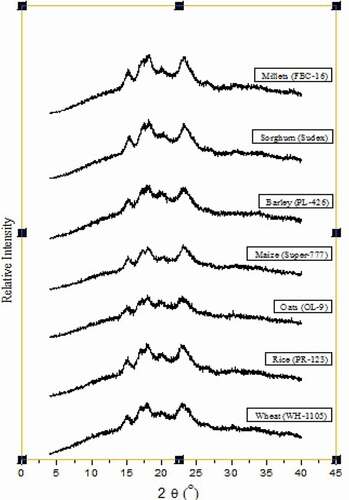
shows the X-ray diffractograms of starches isolated from different cereals. Wheat starch showed the peaks at 14.8°, 17.8°, and 22.7°; doublets at 17.8°; and small peak at 18.5° of 2ϴ which represent the A type pattern of wheat starch. Rice starch showed the small peak at 19.5° and doublet peak at 17.8°. The doublet peak of oat starch was observed at 17.9°. The peaks of maize starch were measured at 15.0° and 23.3°, doublet peaks at 17.9°, and small peak at 19.8°. High amylose and low amylopectin maize (V and VII) starches showed the peak at 2ϴ of 20°.[Citation48] The barley starch showed the peaks at 15.0° and 22.3°. Sorghum starch showed peaks at 15.2° and 23.2°, doublets at 18.0°, and small peak at 19.6°. The peaks of millet starch were measured at 15° and 22.8°, doublet peak at 17.7°, and small peak at 20°. For different cereal starches, XRD patterns presented the major peaks with d-spacing around at 5.88, 4.90, 4.45, and 3.86 Å (), representative of an A-type crystalline packing arrangement. The crystalline index of various starches ranged from 28.2% to 44.9%. Among the various starches, millet starch had the lowest amylose content (17.7%) but having highest crystalline index (44.9%). The crystalline index of different starches was in the order of millet > maize ͌sorghum > rice > barley > wheat > oat. The starches having low amylose content results in high crystalline index.
Table 5. X- ray diffraction spacing, intensities, and crystalline index of major peaks of different starches.
Figure 4. X-ray diffraction patterns of starches from different cereals.
Fourier transform infrared spectroscopy
FTIR spectra are recorded to study the structure of different cereal starches (). FTIR spectra of starches showed the characteristic broad peaks at 3352.2–3393.9 cm−1and are assigned to O-H stretching of hydroxyl group. There was a slight difference observed among the starches from different cereals. The later peaks at 2920–2935 cm−1 are attributed to the C-H stretching of glucose unit. Bands due to water are located in amorphous region of starch at 1635.5–1652.8 cm−1. Peaks at 13377.8–1416, 1140.9–1171.6, and 927.8–1010.6 cm−1are assigned to the vibration of C-H stretching, C-H, and C-O-H bending, respectively. Furthermore, the bands appeared at 854.4–858.6, 766.1–769.5, and 567.4–584.7 cm−1 are related to the vibrations of anhydroglucose ring stretching. Similar results were reported by Brij et al.[Citation49] for wheat starch.
Figure 5. FTIR spectroscopy of starches from different cereals.
In vitro starch digestibility (%)
The extent of RDS, SDS, and RS are shown in . Generally, RDS is thoroughly absorbed in small intestine and is concerned with fast increase of postprandial glucose level. The RDS content of different starches ranged from 34.7 to 54.4% which exhibited increase from 60.5 to 78.5% after cooking. Starch isolated from rice and oats exhibited the highest RDS followed by maize. Barley starch showed the lowest RDS content (60.5%) among the different cereal starches. SDS is the starch which absorbed thoroughly but slowly in small intestine and associated with the slow increase of postprandial glucose and insulin levels. SDS content varied from 39.5 to 53.7% among the different cereal starches and decreased (21.0–37.7%) after cooking. The variations found in starch digestibility may be attributed to many factors such as type of cereal, granular size, degree of crystallinity, and depends on physicochemical properties of the starch and is affected by processing and storage conditions. During cooking, starch granules get gelatinized and partially solubilized and subsequently became available to digestive enzymes.[Citation50] After cooking, the digestibility of starch improved with significant increase in RDS accompanied by considerable decrease in SDS and RS. RS is the starch which represents both the starch and starch degraded products that are not digested in the small intestine but can enhance fermentation in large intestine of normal persons.[Citation51] The intact starch granules of uncooked starch are responsible for higher RS due to their poor hydrolysis by digestive enzymes. RS varied from 6.1 to 11.6% within different cereal starches and get decreased from 0.5 to 1.8% after cooking. In addition, rice and barley starches revealed the highest and lowest RS. It was positively correlated (r = 0.840 p ˂ 0.05) with starch granular size. The size of the granule may affect the digestibility of starch as the smallest granule sized starch, that is, rice showed higher digestibility rate. As granule size increases, the surface area decreased for specific volume subsequently, the chances of enzymatic attack on substrate decreased.[Citation52]
Table 6. In vitro digestibility of raw and cooked starch fractions from different cereal starches.
HI and estimated GI (%)
From nutritional point of view, HI is one of the most important criteria for differentiation of starch digestibility. HI represents the proportion of starch digested in food related to the starch digested in reference food, that is, white bread. GI is calculated from HI and is associated with rise in blood sugar level after consumption of food. HI and eGI of different cereal starches are shown in . HI of starches ranged from 80.0 to 95.0 and increased to range from 100.7 to 107.2 after cooking. Estimated GI (eGI) ranged from 83.6 to 91.8 and after cooking it was increased from 95.1 to 98.6. HI and eGI following the order as: barley > sorghum > millets > wheat > maize > oats > rice. HI and eGI correlated positively with RDS (p ˂ 0.01) and negatively correlated to SDS and RS (p ˂ 0.05). The increase in eGI of cereal starches after heating is attributed to the starch gelatinization. According to Ovando-Martinez et al.,[Citation53] the surface of the bean starch granules became rough and flattened after cooking. This structural change was accompanied by breaking and disrupting of the cell during cooking. Chung et al.[Citation54] showed that the gelatinized corn starch hydrolysed more readily than starch in the granular state. Starch gelatinized by heating was easily hydrolysed by enzymes, thus releasing glucose and increasing the GI value. The gelatinized starch was easily hydrolysed by digestive enzymes; therefore, releasing glucose GI value gets increased. These results are resembled with the Kim and White.[Citation55]
Table 7. Hydrolysis index and estimated glycemic index of raw and cooked starch fractions from different cereal starches.
Principle component analysis
The principle component analysis results are shown in . The PCA score plot 6(a) describes an overview of relationships between starches from different cereals and loading plot provides interrelationships between the measured properties. The degree of similarity or difference between cereal starches depends on distance between locations of different starches on score plot. The starches from maize and sorghum were different from others having positive and negative scores, respectively. The starches from wheat and barley showed similarity in positive and negative scores on score plot. The first and second components (PCs) described 46.8% and 24% of the variance, respectively. Both components represent the total variability of 70.8%. Loading plot 6(b) presents the details about the correlation between the different properties. The SP at 85°C and 95°C had positive correlation with solubilities of starches at different temperatures. So SP and solubilities affected positively with temperature. The solubility of starches at different temperatures was dependent to each other and negatively correlated to the light transmittance of starches stored for different periods. The light transmittance negatively affected with fat content. The amylose content negatively correlated with the crystalline index (r = -0.975, p ≤ 0.05). Peak viscosities of starches was found dependent on trough and final viscosities and negatively correlated to PT. GI and HI positively correlated to RDS while negatively correlated to SDS and RS. It provides the knowledge related to the correlations between the measured properties.
Figure 6. (a) Principal component analysis: score plot of first principal component (PC 1) and second principal component (PC 2) describing the overall variation among properties of starches from different cereals. (b) Principal component analysis: loading plot of PC 1 and PC 2 describing the variation among properties of starches from different cereals. RDS, RDS (raw), SDS, SDS (raw), RS, RS (raw), GI, GI (raw), HI, HI (raw): rapidly digestible starch, slowly digestible starch, resistant starch, glycemic index and hydrolysis index of cooked and raw starches; SS 55, 65,75,85,95: solubilities of starches at 55, 65, 75, 85, and 95ºC; SP 85, 95: swelling power at 85 and 95ºC; SV: setback viscosity, PT: peak temperature, TV: trough viscosity, PV: peak viscosity, FV: final viscosity, CI: crystalline index, SG: starch granular size and 0, 24, 48, 72, 96, 120 h: light transmittance of starches after 0–120 h.
Conclusion
The starches from different cereal grains differ significantly in their physicochemical, morphological, pasting, and crystalline properties. The SP and solubility of all starches increased on rise in temperature and it was more pronounced for the millet starch. The pasting parameters of starches varied significantly. Barley starch showed highest PV, BV, and final viscosity while rice starch had highest setback viscosity. The millet starch had the highest crystalline index while oats starch had the lowest. The present study demonstrated the increased starch digestibility during in vitro digestion with cooking of cereal starches. Cooking increased the starch gelatinization, therefore increasing the susceptibility of enzymatic hydrolysis of starch. The quality of various food products can be improved by the utilization of starches having desirable functional properties and therefore the different food products which make use of the chemically modified starches can be replaced by these starches. Barley, corn, millet, and sorghum are mostly used as feed purposes and have surplus amount of starch which can be utilized as food applications. The properties evaluated from these starches can be proved useful in food processing and can enhance new product development possibilities. So the properties we evaluated in our study can be helpful in designing new food formulations by using wide spectrum properties of these starches.
Additional information
Funding
Related Research Data
References
- French, D.;. Organization of Starch Granules. In Starch Chemistry and Technology, 2nd ed.; Whistler, R. L., BeMiller, J. N., Paschall, E. F., Eds.; Academic Press: New York, 1984; pp. 183–247.
- Ali, T. M.; Hasnain, A. Morphological, Physicochemical and Pasting Properties of Modified White Sorghum (Sorghum Bicolor) Starch. International Journal of Food Properties 2014, 17, 523–535. DOI: 10.1080/10942912.2012.654558.
- Hoover, R.;. Composition, Molecular Structure, and Physicochemical Properties of Tuber and Root Starches: A Review. Carbohydrate Polymers 2001, 45, 253–267. DOI: 10.1016/S0144-8617(00)00260-5.
- Svegmark, K.; Hermansson, A. M. Microstructure and Rheological Properties of Composites of Potato Starch Granules and Amylose: A Comparison of Observed and Predicted Structure. Food Structure 1993, 12, 181–193.
- Kim, S. Y.; Wiesenborn, D. P.; Orr, P. H.; Grant, L. A. Screening Potato Starch for Novel Properties Using Differential Scanning Calorimetry. Journal of Food Science 1995, 60, 1060–1065. DOI: 10.1111/j.1365-2621.1995.tb06292.x.
- Lii, C. Y.; Tsai, M. L.; Tseng, K. H. Effect of Amylose Content on the Rheological Property of Rice Starch. Cereal Chemistry 1996, 73, 415–420.
- Zobel, H. F.;. Starch Crystal Transformations and Their Industrial Importance. Starch. 1988a, 40, 1–7. DOI: 10.1002/star.19880400102.
- Tester, R. F.; Morrison, W. R. Swelling and Gelatinization of Cereal Starches. Cereal Chemistry 1990, 67, 558–563.
- Englyst, H. N.; Kingman, S. M.; Cummings, J. H. Classification and Measurement of Nutritionally Important Starch Fractions. European Journal of Clinical Nutrition 1992, 46, S33–S50.
- Fannon, J. E.; Hauber, R. J.; BeMiller, J. N. Surface Pores of Starch Granules. Cereal Chemistry 1992a, 69, 284–288.
- Gallant, K.; Boucher, B.; Baldwin, P. M. Microscopy of Starch: Evidence of A New Level of Granule Organization. Carbohydrate Polymers 1997, 32, 177–191. DOI: 10.1016/S0144-8617(97)00008-8.
- Fannon, J. E.; BeMiller, J. N. Structure of Corn Starch Paste and Granule Remnants Revealed by Low Temperature Scanning Electron Microscopy after Cryopreparation. Cereal Chemistry 1992, 69, 456–460.
- Sandhu, K. S.; Singh, N.; Malhi, N. S. Physicochemical and Thermal Properties of Starches Separated from Corn Produced from Crosses of Two Germ Pools. Food Chemistry 2005, 89, 541–548. DOI: 10.1016/j.foodchem.2004.03.007.
- Singh, S.; Singh, N.; Isono, N.; Noda, T. Relationship of Granule Size Distribution and Amylopectin Structure with Pasting, Thermal, and Retrogradation Properties in Wheat Starch. Journal of Agriculture and Food Chemistry 2010b, 58, 1180–1188. DOI: 10.1021/jf902753f.
- Sodhi, N. S.; Singh, N. Morphological, Thermal and Rheological Properties of Starch Separated from Rice Cultivars Grown in India. Food Chemistry 2003, 80, 99–108. DOI: 10.1016/S0308-8146(02)00246-7.
- Adebowale, K. O.; Afolabi, T. A.; Olu-Owolabi, B. I. Hydrothermal Treatments of Finger Millet (Eleusinecoracana) Starch. Food Hydrocolloids 2005, 19, 974–983. DOI: 10.1016/j.foodhyd.2004.12.007.
- Hoover, R.; Vasanthan, T. Studies on Isolation and Characterization of Starch from Oat (Avenunudu)Grains. Carbohydrate Polymers 1992, 19, 285–297. DOI: 10.1016/0144-8617(92)90082-2.
- Vasanthan, T.; Bhatty, R. S. Starch Purification after Pin Milling and Air Classification of Waxy, Normal and High Amylose Barleys. Cereal Chemistry 1995, 72, 379–384.
- Beta, T.; Corke, H.; Rooney, L. W.; Taylor, J. R. N. Starch Properties as Affected by Sorghum Grain Chemistry. Journal of the Science of Food and Agriculture 2000, 81, 245–251. DOI: 10.1002/1097-0010(20010115)81:2<245::AID-JSFA805>3.0.CO;2-S.
- AOAC. Official Methods of Analysis, 15th ed.; Association of Official Analytical Chemists: Washington, DC, 1990.
- Williams, P. C.; Kuzina, F. D.; Hlynka, I. A Rapid Calorimetric Procedure for Estimating the Amylose Content of Starches. Cereal Chemistry 1970, 47, 411–420.
- Leach, H. W.; McCowen, L. D.; Schoch, T. J. Structure of the Starch Granule. Swelling and Solubility Patterns of Various Starches. Cereal Chemistry 1959, 36, 534–544.
- Perera, C.; Hoover, K. Influence of Hydroxypropylation on Retrogradation Properties of Native, Defatted and Heat Moisture Treated Potato Starches. Food Chemistry 1999, 64, 361–375. DOI: 10.1016/S0308-8146(98)00130-7.
- Wani, I. A.; Sogi, D. S.; Wani, A. A.; Gill, B. S.; Shivhare, U. S. Physico-Chemical Properties of Starches from Indian Kidney Bean (Phaseolus vulgaris) Cultivars. International. International Journal of Food Science and Technology 2010, 45, 2176–2185. DOI: 10.1111/j.1365-2621.2010.02379.x.
- Lionetto, F.; Sole, R. D.; Cannoletta, D.; Vasapollo, G.; Maffezzoli, A. Monitoring Wood Degradation during Weathering by Cellulose Crystallinity. Materials 2012, 5, 1910–1922. DOI: 10.3390/ma5101910.
- Zhang, B.; Li, X.; Liu, J.; Xie, F.; Chen, L. Supramolecular Structure of A- and B-Type Granules of Wheat Starch. Food Hydrocolloids 2013, 31, 68–73. DOI: 10.1016/j.foodhyd.2012.10.006.
- Goni, I.; Garcia-Alonso, A.; Saura-Calixto, F. A Starch Hydrolysis Procedure to Estimate Glycemic Index. Nutr. Res. (N.Y.). 1997, 17, 427–437. DOI: 10.1016/S0271-5317(97)00010-9.
- Juliano, B. O.; Villarreal, C. P. Grain Quality Evaluation of World Rices. International Rice Research Institute: Los Banos, Philippines, 1993; p. 205.
- Wankhede, D. B.; Rathi, S. S.; Gunjal, B. B.; Patil, H. B.; Walde, S. G.; Rodge, A. B.; Sawate, A. R. Studies on Isolation and Characterization of Starch from Pearl Millet (Pennisetum americanum (L.) Leeke) Grains. Carbohydrate Polymers 1990, 13, 17–28. DOI: 10.1016/0144-8617(90)90048-W.
- Resurreccion, A. P.; Hara, T.; Juliano, B. O.; Yosida, S. Effect of Temperature during Ripening on Grain Quality of Rice. Soil Science and Plant Nutrition 1997, 23, 109–112.
- Sandhu, S. K.; Singh, N. Some Properties of Corn Starches II: Physicochemical, Gelatinization, Retrogradation, Pasting and Gel Textural Properties. Food Chemistry 2007, 101, 1499–1507. DOI: 10.1016/j.foodchem.2006.01.060.
- Pycia, K.; Gałkowska, D.; Juszczak, L.; Fortuna, T.; Witczak, T. Physicochemical, Thermal and Rheological Properties of Starches Isolated from Malting Barley Varieties. Journal of Food Science and Technology 2015, 52, 4797–4807. DOI: 10.1007/s13197-014-1531-3.
- Ratnayake, W. S.; Hoover, R.; Warkentin, T. Pea Starch: Composition, Structure and Properties – A Review. Starch/Starke. 2002, 54, 217–234. DOI: 10.1002/1521-379X(200206)54:6<217::AID-STAR217>3.0.CO;2-R.
- Forssel, P.; Hamunen, A.; Autio, K.; Suortti, T.; Poutanen, K. Hypochlorite Oxidation of Barley and Potato Starch. Starch-Starke. 1995, 47, 371–377. DOI: 10.1002/star.19950471002.
- Yu, S.; Ma, Y.; Menager, L.; Sun, D. W. Physicochemical Properties of Starch and Flour from Different Rice Cultivars, Food Bioprocess Technology. 2012, 5, 626–637.
- Wang, Y. J.; Wang, L. Physicochemical Properties of Common and Waxy Corn Starches Oxidized by Different Levels of Sodium Hypochlorite. Carbohydrate Polymers 2003, 52, 207–217. DOI: 10.1016/S0144-8617(02)00304-1.
- Kaur, L.; Singh, N.; Sodhi, N. S. Some Properties of Potatoes and Their Starches II. Morphological, Thermal and Rheological Properties of Starches. Food Chemistry 2002, 79, 183–192. DOI: 10.1016/S0308-8146(02)00130-9.
- Craig, S. A. S.; Maningat, C. C.; Seib, P. A.; Hoseney, R. C. Starch Paste Clarity. Cereal Chemistry 1989, 68, 173–182.
- Singh, N.; Kaur, L.; Sandhu, K. S.; Kaur, J.; Nishinari, K. Relationships between Physicochemical, Morphological, Thermal, Rheological Properties of Rice Starches. Food Hydrocolloids 2006, 20, 532–542. DOI: 10.1016/j.foodhyd.2005.05.003.
- Shaikh, M.; Ali, T. M.; Hasnain, A. Post Succinylation Effects on Morphological, Functional and Textural Characteristics of Acid-Thinned Pearl Millet Starches. Journal of Cereal Science 2015, 63, 57–63. DOI: 10.1016/j.jcs.2015.02.006.
- Gujral, H. S.; Sharma, P.; Kaur, H.; Singh, J. Physiochemical, Pasting and Thermal Properties of Starch Isolated from Different Barley Cultivars. International Journal of Food Properties 2013, 16, 1494–1506. DOI: 10.1080/10942912.2011.595863.
- Hoover, H.; Smith, C.; Zhou, Y.; Ratnayake, R. M. W. S. Physicochemical Properties of Canadian Oat Starches. Carbohydrate Polymers 2003, 52, 253–261. DOI: 10.1016/S0144-8617(02)00271-0.
- Ashogbon, A. O.; Akintayo, E. T. Morphological and Functional Properties of Starches from Cereal and Legume: A Comparative Study. International Journal of Biotechnology and Food Science 2013, 4, 72–83.
- Sandhya Rani, M. R.; Bhattacharaya, K. R. Rheology of Rice Flour Pastes: Effect of Variety, Concentration and Temperature and Time of Cooking. Journal of Texture Studies 1989, 20, 127–137. DOI: 10.1111/j.1745-4603.1989.tb00427.x.
- Morris, V. J. Starch Gelation and Retrogradation. Trends in Food Science and Technology 1990, 1, 2–6. DOI: 10.1016/0924-2244(90)90002-G.
- Baum, B. R.; Bailey, L. G. A Survey of Endosperm Starch Granules in the Genus Hodeum: A Study Using Image Analytic and Numerical Taxonomic Techniques. Canadian Journal of Botany 1987, 65, 1563–1569. DOI: 10.1139/b87-215.
- Badenhuizen, N. P.;. The Biogenesis of Starch Granules in Higher Plants. Appleton Crofts: New York, 1969.
- Shi, Y. C.; Capitani, T.; Trzasko, P.; Jeffcoat, R. Molecular Structure of A Low Amylopectin Starch and Other High Amylose Maize Starches. Journal of Cereal Science 1998, 27, 289–299. DOI: 10.1006/jcrs.1997.9998.
- Karwasra, B. L.; Gill, B. S.; Kaur, M. Rheological and Structural Properties of Starches from Different Indian Wheat Cultivars and Their Relationships. International Journal of Food Properties 2017, 20, S1093–S1106. DOI: 10.1080/10942912.2017.1328439.
- Ren, X.; Chen, J.; Molla, M. M.; Wang, C.; Diao, X.Shen, Q. In Vitro Starch Digestibility and in Vivo Glycemic Response of Foxtail Millet and its Products. Food Funct 2016, 7, 372–379. doi:10.1039/C5FO01074H
- Kaur, M.; Sandhu, K. S.; Ahlawat, R. P.Sharma, S. In Vitro Starch Digestibility, Pasting and Textural Properties of Mung Bean: Effect of Different Processing Methods. International Journal of Food Science and Technology 2015, 52, 1642–1648. DOI:10.1007/s13197-013-1136-2.
- Svihus, B.; Uhlen, A. K.Harstad, O. M. Effect of Starch Granule Structure, Associated Components and Processing on Nutritive Value of Cereal Starch: a Review. Animal Feed Science and Technology 2005, 122, 303–320. DOI:10.1016/j.anifeedsci.2005.02.025.
- Ovando-Martinez, M.; Osorio-Diaz, P.; Whitney, K.; Bello-Perez, L. A.Simsek, S. Effect of The Cooking on Physicochemical and Starch Digestibility Properties of Two Varieties of Common Bean (Phaseolus Vulgaris L.) Grown under Different Water Regimes. Food Chemistry 2011, 129, 358–365.
- Chung, H. J.; Shin, D. H.; Lim, S. T. In Vitro Starch Digestibility and Estimated Glycemic Index of Chemically Modified Corn Starches. Food Research International 2008, 41, 579–585.
- Kim, H. J.; White, P. J. In Vitro Digestion Rate and Estimated Glycemic Index of Oat Flours from Typical and High β-Glucan Oat Lines. Journal of Agricultural and Food Chemistry 2012, 60, 5237–5242. doi:10.1021/jf300429u.