
 ?Mathematical formulae have been encoded as MathML and are displayed in this HTML version using MathJax in order to improve their display. Uncheck the box to turn MathJax off. This feature requires Javascript. Click on a formula to zoom.
ABSTRACT
Wheat quality laboratories need a scoring system for efficient segregation of wheat samples. A comprehensive and objective scoring system was developed to assist the evaluation of end-use quality of hard red spring (HRS) wheat. The overall quality score consisted of (1) wheat, (2) milling, (3) flour and dough, and (4) baking quality scores. Subscores attained from various quality tests were subdivided into individual categories. The objective of this experiment was to evaluate the quality scoring system. Since flour quality is highly influenced by experimental milling procedures, four different laboratory roller mills were compared for the scoring system using 12 HRS wheat samples. Although the mill type varied significantly (p < 0.001) for the overall quality scores, they appeared to be consistent for ranking of wheat samples, showing significant correlation coefficients (r ≥ 0.74, p < 0.01) between different mill types. Quad. Sr. mill was specifically identified to be more suitable for dough and bread-making quality evaluation of HRS wheat due to the higher consistency with a long-flow MIAG mill. The overall quality scores also showed a significant (p < 0.001) variation among wheat samples, indicating that the scoring system could be useful to segregate HRS wheat samples for end users and breeders.
Abbreviation: HRS: Hard Red Spring; MN: Minnesota; MT: Montana; ND: North Dakota; SD: South Dakota; OVA: Overseas Varietal Analysis; Quad: Quadrumat; AACCI: American Association of Cereal Chemist International; SKB: Sandstedt Kneen and Blish; SAS: Statistical Analysis System; ANOVA: Analysis of Variance; LSD: Least Significant Difference; ERE: Extensograph Resistance to Extension; SDS: Sodium Dodecyl Sulfate
KEYWORDS:
Introduction
Hard red spring (HRS) wheat constitutes about 25% of the crop in the United States. HRS wheat is known to have high protein content and excellent milling and baking performances[1,Citation2] and generally used in yeast breads, hard rolls, specialty breads, bagels, and pizza crusts because of the high protein content. In addition, HRS wheat flour is widely used in frozen dough products because they show higher storage tolerance than those made with lower protein wheat. The domestic and overseas buyers pay premium price for HRS wheat because of its high quality and unique characteristics. Therefore, more emphasis should be put on the functional properties and end-use quality of the HRS wheat.
A scoring system would provide a simple and straightforward evaluation of HRS wheat cultivars for end-use quality. For quality evaluation of HRS wheat, Nolte, Youngs, Crawford, and Kunerth [Citation3] developed a scoring and faulting system that used 16 quality factors. Their quality scoring system did not include dough mixing characteristics analyzed using farinograph and extensograph that are currently very important in wheat trade. The scoring system was also deficient in other important quality traits including sprout damage, starch damage, and gluten content. This might be possibly due to the unavailability of instruments to measure those traits at that time. Therefore, an overall scoring system including those traits has been needed for evaluating the quality of HRS wheat. Development of a new comprehensive scoring system would enable a more accurate and straightforward screening of new lines with suitable end-use quality in HRS wheat breeding.
Different types of experimental roller mills are used for the evaluation of milling quality of wheat samples. According to Baasandorj, Ohm, Manthey, and Simsek, [Citation4] individual experimental mills varied in the flour extraction rate, and the milled flour samples differed for protein composition, and some quality traits, such as mixing characteristics and breadmaking. Despite that, those experimental mills appeared to be consistent in evaluating the quality for HRS wheat samples that were segregated based on kernel size. However, the research was performed using only small-scale experimental mills such as Quad Jr., Sr., and Buhler mills. Souza, Griffey, Kweon, and Guttieri [Citation5] investigated the Allis-Chalmers long-flow mill for quality evaluation of soft wheat genotypes and reported that the long-flow mill was useful for the evaluation of milling performance of soft wheat cultivars. Guttieri, Souza, and Sneller [Citation6] compared the short-flow experimental milling system with the long-flow experimental milling system for whole grain soft wheat milling. They reported that the short-flow experimental mill system is useful for screening of cultivars causing less starch damage than the long-flow experimental milling system in soft wheat. The different experimental mills are supposed to be consistent with the commercial milling system in quality characteristics of milled flour for different wheat samples. For HRS wheat, few reports have been recently published for comparison of the performance of the small experimental mills with a long-flow mill such as MIAG-Multomat mill, which resembles the commercial milling system. The objective of this study was to determine if the quality evaluation of HRS wheat samples was affected by different experimental roller mills including Quad Jr., Quad Sr., Buhler, and MIAG-Multomat mills, and the secondary objective was to test an overall scoring system which was developed to assist evaluation of HRS wheat.
Materials and methods
Wheat samples
Five bushels of six HRS wheat cultivar composites (Forefront, Elgin, Bolles, ND 817, SY Ingmar, and Glenn) were obtained from the Gulf/Great Lake Export Region as part of the 2014 Overseas Varietal Analysis (OVA). The OVA samples were composited for each cultivar by blending the same proportion of wheat grains produced at Casselton ND, Crookston ND, and Watertown SD locations. An additional five bushels of 6 HRS wheat cultivars of Dapps, Elgin, Faller, Focus, Glenn, and Prosper from Casselton location were obtained from the North Dakota State Seed Department, thus making a total of 12 HRS wheat samples. These samples were selected since they were readily available in large amounts and would give a good representation of the quality of HRS wheat samples that were produced in the Northern Plain region in USA.
Kernel quality analysis
Wheat samples were cleaned on a Carter Day XT5 seed cleaner (Simon-Carter Co., Minneapolis, MN) to remove shrunken and broken kernels. Test weight and moisture contents (dockage-free portion) were determined with a GAC 2100 tester (Dickey-John, Auburn, IL, USA). Whole-wheat ash and protein content were measured by near-infrared spectroscopy with an Infractec 1241 grain analyzer (Perstorp Analytic, Hoganas, Sweden).
Wheat kernel samples (10 g) were weighed and prepared after removal of all dockage, shrunken, and broken kernels and other foreign materials. The number of each sample was counted with a model 77 Totalizer (Seedburo Equipment, Chicago, IL, USA). The number of counted kernels was converted to 1000 kernel weight and recorded:
The ground wheat flour falling number was determined using a Falling Number (FN1900, Perten Instruments, Springfield, IL, USA) according to AACCI Approved Method 56-81.03.[Citation7]
Flour milling
Wheat samples were tempered to 16% moisture for 18 h before flour milling. All wheat samples were milled on four different laboratory mills: Brabender Quadrumat (Quad.) Jr. and Sr. (Brabender Instruments, Hackensack, NJ, USA), Buhler MLU-202 (Buhler Industries, Uzwil, Switzerland), and MIAG-Multomat (Miag, Braunschweig, Germany) roller mills.
A total of 4 kg of wheat samples were milled on the Brabender Quad. Jr. according to AACCI Approved Method 26-50.01[Citation7] and on the Quad. Sr. and Buhler MLU-202 according to AACCI Approved Method 26-21.02.[Citation7] Two hundred gram lot was milled at a time on the Quad. Jr. and Sr. mills due to the sieving capacity. Approximately 50 kg of wheat samples were milled on the MIAG Multomat mill; the feed rate of wheat to the mill was set at 1360 g/min. The break releases for the first, second, and third breaks were set at 30, 53, and 65%, respectively. Flour extraction was determined as the percentage of straight-grade flour produced. Flour streams obtained from the MIAG mill were then rebolted through an 84 SS sieve on a rebolter (Ser. No. 204, Allis-Chalmers MFG., Milwaukee, WI, USA) to remove any foreign material. Flour mill streams were then blended for 30 min in a cross-flow blender (Serial No. L6-0280, Patterson-Kelly Co., East Stroudsburg, PA, USA).
Flour and dough quality analysis
The moisture content of each sample was determined with air-oven drying at 135°C according to AACCI Approved Method 44-19.01.[Citation7] Ash content of each flour sample was determined according to AACCI Approved Method 08-01.01.[Citation7] Flour starch damage was determined using a Megazyme starch damage assay procedure according to AACCI Approved Method 76-31.01.[Citation7] Flour protein content was determined according to AACCI Approved Method 46-30.01 with a LECO FP 528 nitrogen/protein analyzer (LECO, St. Joseph, MI, USA). Protein loss was determined by subtracting flour protein content from whole-wheat protein content.
The flour particle size was determined using a RoTap shaker (Seedburo Equipment Co., Chicago, IL, USA) according to AACCI Method 55-60.01. Flour (100 g) was weighed and sifted on the sieves with screen openings of 250, 180, 150, 125, 75, and 45 μm for 5 min. Flour fractions retained on each sieve was weighed and expressed as the percentage of flour in each particle size range.
The flour color score was determined by light reflectance according to AACCI Approved Method 14-22.01 with a color difference meter using the CIELAB (L*, a*, b*) color space (CR 310, Minolta Camera, Osaka, Japan).[Citation7] The flour falling number was determined using a Falling Number (Perten Instruments FN1900, Springfield, IL, USA) according to AACCI Approved Method 56-81.03.[Citation7] The wet gluten content and gluten index were determined with a Glutomatic 2200 S system (Perten Instruments, Springfield, IL, USA) according to AACCI Approved Method 38-12.02.[Citation7]
The water absorption and dough strength were measured with a Farinograph-E (Brabender© Farinograph version 4.0.3, C. W. Brabender Instruments, Hackensack, NJ, USA) according to AACCI Approved Method 54-21.02, applying the constant flour weight method.[Citation7] The dough extensibility was measured using an Extensograph-E (Brabender© Extensograph version 4.3.0, C.W. Brabender Instruments Inc., Hackensack, NJ) according to AACCI Approved Method 54-10.01.[Citation7]
Breadmaking
Flour samples (100 g) were baked according to AACCI Approved Method 10-09.01[Citation7] with the following modifications: fungal α-amylase (15 SKB) instead of dry malt powder, instant yeast (1.0%) instead of compressed yeast, and the addition of 10 ppm ammonium phosphate. After baking, bread loaf volume was measured according to AACCI Approved Method 10-05.01.[Citation7] A 3-h fermentation schedule with two punches was used, and the bread was baked in “Shogren-type” pans. The bread was then evaluated on a scale of 1–10, with 10 being the best and 1 being the worst, for crust color, crumb color, crumb grain, and symmetry. The texture analysis of bread loaves was done 1 day after baking. Breads were sliced crosswise using an electric bread slice. A texture analyzer (TA-XT2i, Texture Exponent 32 version 6.1.4.0, Texture Technologies Corp., Scarsdale, NY) was used to determine the bread firmness according to AACCI Approved Method 74-09.01.[Citation7]
Quality scoring for HRS wheat cultivars on their quality characteristics
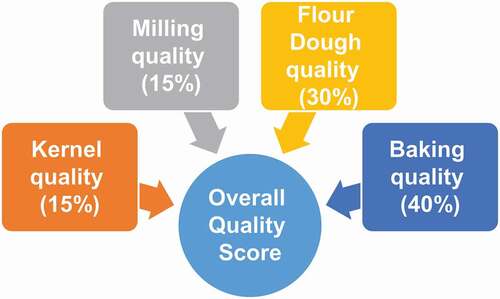
The overall quality score consisted of (1) wheat, (2) milling, (3) flour and dough, and (4) baking quality scores in which the weights/percentages were given to each of these quality characteristics (–). Scores were awarded for each trait by subdividing these categories into various quality tests for evaluating these traits. Each of these four quality scores further consisted of various quality tests in which weights were again given to calculate individual quality scores. Within each quality test, scores between 1 and 10 were assigned for each quality test to calculate the overall quality score, with 10 being the best and 1 being the worst (–). Upon getting an overall score from these four quality traits, a final or overall quality score was calculated by giving weights on these four quality scores. The weights were assigned for these quality traits, and emphasis was placed on dough and baking quality, as these are the most influential basis used to determine the overall quality ().
Table 1. Quality score for wheat characteristics and milling parameters with weights assigned.
Table 2. Quality scores for flour and dough characteristics with weights assigned.
Table 3. Baking quality score consisting of various quality tests with weights assigned.
Figure 1. Overall quality scoring system consisting of wheat, milling, flour and dough, and baking quality scores.
Statistical analysis
Statistical analysis was performed using the SAS statistical methods software (Version 9.3, SAS Institute; Cary, NC). The experimental design was a two-factorial layout with the mill type and wheat cultivars as main factors. Analysis of variance (ANOVA) was performed to assess the effect of the mill type and wheat samples on quality characteristics. The mill type and wheat sample interaction term was used as an error term. The least significant difference (LSD) was used to declare differences between treatments at a 5% significance level.
Results and discussion
Roller mills in quality evaluation of HRS wheat
The milling parameters are given in for wheat samples across roller mills. Flour yield increased with the mill type. The number of grinding stages and sieving process associated with each mill may explain the difference in the flour yield. The Quad. Jr. mill had the lowest flour yield owing to only four grinding rolls and one sieving process. In contrast, the Buhler mill had significantly (p < 0.05) higher flour yield, as there are three pairs of grinding rolls with the sieving process following each grinding stage. In other words, more grinding and sieving stages promote better separation of bran and germ from the endosperm, thus resulting in a greater flour yield. Baasandorj, Ohm, Manthey, and Simsek [Citation4] also reported a lower flour yield for the Quad. Jr. mill than for either of the Quad. Sr. and Buhler mills. The ANOVA showed that the flour yield was significantly (p < 0.001) affected by mill types and wheat samples (). The wheat samples showed a lower mean square value than mill types that reveals that the mill type might have a greater influence on the variation of the flour yield than wheat samples.
Table 4. Means of roller mills and mean square values for wheat, milling, flour and dough, and baking quality evaluation parameters a
The Quad. Sr. mill had significantly (p < 0.05) lower flour ash content compared with the other mills. Ash content indicates the purity of wheat flour, and lower ash content often means a better separation of bran and germ from the endosperm. The Buhler mill had higher flour ash content compared to the other mills (). This could be due to a higher flour extraction than those from the other mills. Generally, ash content increases with flour extraction. While the influence of the mill type was significant (p < 0.001) when analyzed by ANOVA, wheat samples showed nonsignificant variation (p > 0.05) for flour ash content.
Protein loss is simply the difference of protein content between wheat and the straight-grade flour, and it is typically 1%. [Citation8] Mill types and wheat samples affected significant variation (p < 0.01) of protein loss (). Protein loss of approximately 1% was observed for all mills except the Quad. Sr., which had significantly (p < 0.05) higher protein loss than other mills. High protein loss in the Quad. Sr. mill could explain the low ash content. As bran and aleurone layer fractions which are rich in protein and ash were removed more during the milling process, it resulted in greater protein loss. The mill type had a minimal, though significant (p < 0.05) effect on wet gluten content. Flour from the MIAG mill had the highest wet gluten content (33.7%), while the Quad. Sr. mill produced flour with the lowest wet gluten content (32.4%).
One of the key differences in wheat flour samples produced by different milling techniques is the different particle size distribution of milled flour.[Citation9] The flour particle size distribution varied among mill types (). Flours produced from the Quad. Jr. and Sr. mills had nonuniform and coarse particle size, while the Buhler and MIAG mills produced very uniform and fine flour particles (). Flour starch damage was also significantly (p < 0.05) different between mill types except for between the Buhler and MIAG mills (). When averaged across wheat samples, the Quad. Sr. had the lowest damaged starch content of 5.4% followed by the Quad. Jr mill (). Both the Buhler and MIAG mills had significantly higher starch damage compared to the Quad. mills. Baasandorj, Ohm, Manthey, and Simsek [Citation4] also reported similar flour starch damage values for Quad. Jr. and Sr. and Buhler mills. Factors such as more grinding, larger roll differentials, higher roll temperature, and finer apertures on sieves increase starch damage and decrease particle size of flour.[Citation8]
Figure 2. Flour particle size distribution at various sieve openings for flour samples milled in different roller mills.
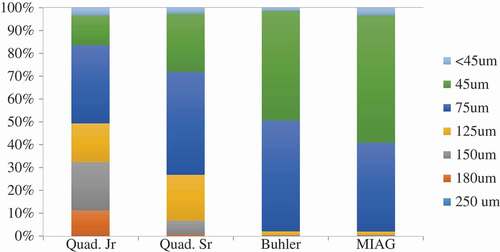
The mill type significantly (p < 0.01) influenced farinograph parameters (). Farinograph water absorption was higher for both the Buhler and MIAG mills when compared to the Quad. Jr. and Sr. mills. In contrast, farinograph peak time and stability were found to be higher for the Quad. Jr. and Sr. mills. During different stages of the bread-baking process, an insufficient level of water causes flour particles to not stick together while too much water results in handling problems during mixing and proofing stages.[Citation10,Citation11] Therefore, an optimum level of water is needed to hydrate flour components and to develop the gluten during the mixing stage. Wheat flour samples show different hydration properties and the flour particle size plays an important role in determining the optimum level of water quantity required for uniform hydration of flour dough.[Citation8,Citation12] The Quad. Jr. and Sr. mills produced coarser flour samples (), which resulted in a slower rate of water hydration and increased dough development time as indicated by the farinograph peak time. In contrast, flours produced from the Buhler and MIAG mills resulted in significantly higher (p < 0.05) water absorption, indicating that the fine flour particles resulted in faster water uptake and ultimately shorter dough development time. Flour starch damage could also be another factor influencing water absorption, as damaged starch granules exhibit a higher degree of water absorption than the undamaged granules.[Citation1] Therefore, a combination of high starch damage and fine flour particle size produced in the Buhler and MIAG mills explains the higher water absorption.[Citation8]
The extensograph parameters also showed significant variation (p < 0.05) for mill types and wheat samples (). The extensograph resistance to extension (ERE) measures the force required to stretch the dough with a hook until it breaks. Flour produced from the Quad. Jr. and Sr. mills showed significantly (p < 0.05) higher ERE than those from Buhler and MIAG mills (). In contrast, flour samples from the Quad. Jr. mill showed lower ERE. Flour samples from the Quad. Jr. and Sr. mills had larger extensograph area values than flour samples from Buhler or MIAG mills. These results indicated that, in terms of dough quality parameters, flour samples produced from the Quad. Jr. and Sr. mills have stronger dough rheological properties when compared to those from Buhler and MIAG mills. Especially, the long farinograph stability and high ERE are desirable characteristics of HRS wheat flour. Variation in protein composition could also be a factor that affected the differences in the farinograph (especially peak time and stability) and extensograph parameters. Baasandorj, Ohm, Manthey, and Simsek [Citation4] reported that SDS-unextractable polymeric proteins, which associate positively with dough strength parameters, were significantly higher in flour obtained from a Quad. Jr mill than that obtained from a Buhler mill.
Bread-making quality was evaluated for the roller mills (). Baking water absorption showed a similar trend to farinograph water absorption as was indicated by the significant correlation (r = 0.61, p < 0.001) between them. Flours obtained from the Quad. Jr. and Sr. mills had significantly (p < 0.05) lower baking absorption values, while the Buhler and MIAG mills had higher baking absorption. Flour absorption during the bread-making process is related to the flour particle size as well as damaged starch from the mechanical means as mentioned previously for farinograph water absorption.[Citation8]
Flours from the Buhler and MIAG mills produced larger bread loaves when compared to the Quad. Jr. and Sr. mills (). In addition, those bread loaves had higher scores for symmetry, crumb grain texture and crumb color and lower bread firmness than those of Quad. Jr. and Sr. mills. In contrast, the bread loaves from Quad. Jr. and Sr. mills also had significantly (p < 0.05) higher bread crumb firmness. Flour requiring higher water absorption levels results in softer bread crumb and a slower rate of bread firming. The one factor that caused higher crumb firmness for flour samples from Quad. Jr. and Sr. mills might be the lower water absorption. The balance between viscous and elastic characteristic of dough is very important, as overly viscous dough is slack, while excess elasticity results in tough dough. Flour samples obtained from the Quad. Jr. and Sr. mills had stronger dough rheology properties as indicated by higher ERE, which might prevent expansion of dough during baking and result in lower bread loaf volumes and higher firmness.[Citation13] However, ANOVA showed insignificant variation for loaf volume, symmetry, curst color, and crumb grain for mill types in this experiment ().
Evaluation of mills based on a scoring system
also presents the quality scores for individual roller mills. The Quad. Jr. and Sr. mills were significantly (p < 0.05) lower for milling quality scores, while the Buhler and MIAG mills received higher milling quality scores. This was expected due to the higher flour yield and flour starch damage for flour samples milled on the Buhler and MIAG mills. Since HRS wheat samples tested in this experiment consisted of cultivars that are known to have fair or above milling quality in general, the variance for the milling score was low even though it was statistically significant (p < 0.05). The flour samples from Quad. Jr. and Sr. mills received higher flour and dough quality scores owing to higher farinograph and extensograph parameters. The baking quality score was significantly (p < 0.05) higher for the Buhler and MIAG flour samples mostly due to the better bread-making characteristics and larger bread loaf volume than flour samples from Quad. Jr. and Sr. The overall quality scores showed a similar trend. The Buhler and MIAG mills had significantly (p < 0.05) higher overall quality scores of 6.4 and 6.5, respectively, when compared to the Quad. Jr. and Sr. mills, both of which received overall quality scores of 6.1.
Correlations between mills for quality characteristics
Smaller experimental roller mills are typically used for quality evaluation when sample quantity and time are limited. Therefore, it is very important that the small experimental mills are consistent with larger or commercial mills in quality evaluation of wheat samples. The consistency of milling performance was evaluated by estimating linear correlation coefficients (r) between mill types in this experiment. shows the correlations between roller mills for individual quality characteristics. The flour yield showed a positive and significant (p < 0.001) correlation between Quad. Jr. and MIAG mills. This indicates that a Quad. Jr. mill may be used for evaluating flour yield potential using a small size of wheat sample prior to milling in a MIAG mill for larger scale. No significant (p > 0.05) correlation appeared for flour starch damage between roller mills (). Thus, flour starch damage obtained from one mill type could not be predicted by other different roller mills.
Table 5. Correlation coefficients between roller mills for quality characteristics.
Significant (p < 0.01) and positive correlations appeared for farinograph water absorption between mills (). Flour samples obtained from the Buhler and MIAG roller mills especially had a high correlation (r = 0.93, p < 0.001) for farinograph water absorption probably due to the similar flour particle size distribution () and starch damage level (). Farinograph stability is another important parameter that measures dough tolerance against mixing action. A significant (p < 0.05) correlation appeared between Quad. Sr. and Buhler, Quad. Sr. and MIAG, and Buhler and MIAG mills for farinograph peak time and stability (). However, Quad Jr. did not show a significant (p > 0.05) correlation with other mills for peak time and stability except for with MIAG for peak time (r = 0.58, p < 0.05) and with Quad. Sr. for stability (r = 0.90, p < 0.05). This result indicates that the Quad. Jr. mill might not be useful when evaluating wheat samples for dough mixing characteristics. In contrast, significant (p < 0.05) correlations appeared among all the mills for ERE and baking parameters including absorption, mix time, and bread loaf volume (). These results suggest that small mills may be used for experimental flour milling when its primary goal is to evaluate bread-making quality of wheat samples.
also presents the correlation coefficients for individual and overall quality scores between roller mills. No significant (p > 0.05) correlation appeared for milling quality scores between these individual mills, except for between the Quad. Sr. and Buhler mills. The nonsignificant correlation might appear due to the low variation of milling scores of wheat samples within mill types as all the wheat samples are released cultivars that have fair and above milling quality. In contrast, a significant (p < 0.05) and positive correlation appeared for flour and dough quality scores among these mill types (). Especially, the Quad. Jr. showed significant (p < 0.05) correlations with other mills for flour and dough quality scores despite low correlations for farinograph stability with Buhler and MIAG mills. The Quad. Jr. did not have significant correlations (p > 0.05) with other mills for baking quality score despite the significant correlations for baking parameters with other mills. Similarly, the Buhler and MIAG mills which had significantly (p < 0.05) higher baking quality scores did not show a significant (p > 0.05) correlation for the baking quality score (). This might be due to the low variation of baking quality scores as all the wheat samples received a fair score above 5.7 or above for all mills. The overall quality score showed significant (p < 0.01) and positive correlations between all the roller mills. This indicates that the interaction of mill types and wheat samples might not be high enough to cause discrepancy in quality evaluation of wheat samples. Especially, the consistency between short flow mills and MIAG mill is considered to be important since settings of the MIAG mill is more similar to the commercial mill system in this experiment. The correlations indicate that the Quad Sr. mill is more consistent with the MIAG mill and could be useful for the evaluation of wheat quality, especially flour and dough, and bread-making quality of HRS wheat samples.
Evaluation of wheat samples using the scoring system
HRS wheat samples were evaluated based on an overall scoring system for assessing HRS wheat quality. The scoring system is expected to assist the industry in the selection of wheat cultivars since it simplifies the description of quality characteristics of wheat cultivars. The aim was to determine whether the scoring system is useful for quality evaluation of HRS wheat samples. Upon evaluating quality characteristics for HRS wheat samples, quality scores were assigned as described in the Materials and Methods section. Statistical significance (p < 0.05) of variance for quality scores among wheat samples () supports that the scoring system may be useful to differentiate HRS wheat samples for quality.
The quality scores are summarized as mean, SE, range, and coefficient variance value in . Wheat samples were significantly (p < 0.05) different for flour yield scores showing a mean score of 7.3 (). Although ANOVA revealed that wheat samples had a significant (p < 0.05) effect, there was a small variation in the flour yield score as indicated by low SE and CV values for wheat samples (). The reason is that all the wheat samples showed a good flour yield in this experiment and received a score of 7.0 or above except O-Bolles. In contrast, larger variation occurred for the flour ash score with a wider range from 7 to 9.
Table 6. Mean, SE, minimum (Min), maximum (Max), and coefficient of variance (CV) values of quality scores for wheat samples.
The mill type had a significant (p < 0.05) effect on the starch damage score; however, no significant difference was observed for the wheat samples (). Baasandorj, Ohm, and Simsek [Citation14] estimated that the optimum flour damaged starch content was found to be 6.6–8.5% for hard wheat flour. The damaged starch content showed a range of 6.6–9.0% for flour samples milled on the MIAG in this research. This indicates that the level of flour starch damage may be around the optimum level when milled on large mills and variation of damaged starch content might not be an important factor in determining the flour yield score for HRS wheat samples in this experiment. A large variation appeared for the protein loss scores for these HRS samples as indicated by large CV and range. The ANOVA also revealed that the wheat sample had significant (p < 0.001) effects on the protein loss scores (). The overall milling quality score ranged from 6.2 (O-Forefront) to 7.4 (O-Bolles). The milling quality scores of 7 or above were considered “good” milling quality wheat, which included cultivars O-Bolles, C-Dapps, O-Elgin-ND, C-Elgin-ND, and C-Prosper. On the contrary, O-Forefront, O-Glenn, O-ND 817, and C-Faller were considered “fair” milling quality wheat receiving milling quality scores of 6.6 or less.
Flour and dough quality scores were also assigned for HRS wheat samples (). Wheat samples showed significant (p < 0.001) differences for the wet gluten scores. The low amount of wet gluten, indicated by the low wet gluten scores, could indicate differences in the bread-making quality. O-Bolles, C-Glenn, and C-Dapps cultivars had high wet gluten scores of 5.8 or above. In contrast, O-Elgin-ND, C-Elgin-ND, O-Forefront, and C-Prosper cultivars had very low wet gluten scores less than 4.0.
HRS wheat is known for its dough quality and strength of which information is provided by farinograph stability and ERE. A farinograph stability score showed large variation for wheat samples with the range of 2.0–5.3 (). Specifically, O-Bolles, C-Glenn, and O-SY Ingmar cultivars had a high farinograph stability score over 4.5, while C-Focus, C-Prosper, and O-ND 817 cultivars had low farinograph stability scores lower than 3.5. The score range was wider for an ERE score (3.8–9.0) than the farinograph stability score. Cultivars O-Bolles, C-Glenn, and O-Glenn scored very high ERE scores above 8.5, indicating that these cultivars had strong gluten strength. In terms of flour and dough quality scores, wheat cultivars O-Bolles, C-Glenn, O-Glenn, and O-SY Ingmar received scores of 5.5 or above, hence these cultivars were considered “good” flour and dough quality cultivars.
Similarly, the baking quality scores were assigned for these HRS samples. Bread loaf volume is an important parameter when evaluating flour baking quality. The ANOVA showed that wheat samples had a significant (p < 0.001) variation for the loaf volume score. The volume score showed the range of 4.5–7.5. Specifically, all the samples scored 5.0 or above except for C-Elgin-ND (4.8) and C-Prosper (4.5). The baking quality score, which factored in all the baking quality parameters, appeared to vary significantly for wheat samples. The baking quality score ranged from 6.4 to 7.7. O-Bolles had the highest baking quality score of 7.7 making this cultivar “good” baking quality cultivar, while wheat samples scoring less than 7.0 were consider “fair” baking quality cultivars, which were C-Elgin-ND, C-Focus, O-Forefront, and C-Prosper. But, the SE (0.4) and CV (5.6) values were lower than those of loaf volume.
The overall quality score consisted of the wheat quality score (15%), milling quality score (15%), flour and dough quality score (30%), and baking quality score (40%). These weights were given considering the importance on the end-use quality of HRS wheat. The ranking of 12 HRS wheat samples showed a similar trend for flour and dough quality, baking quality, and overall quality scores. This was due to the fact that flour and dough quality, and baking quality scores contributed 70% of the overall quality score. The overall quality score ranged 5.6–7.0. To be more specific, O-Bolles, C-Glenn, and O-Glenn cultivars had the overall quality scores of 6.5 or above when averaged across mill types. The overall quality scores for these HRS wheat cultivars were consistently high for different roller mills. Thus, these cultivars would be considered “good” overall quality wheat cultivars. In contrast, C-Focus, O-Forefront, and C-Prosper cultivars were considered “fair” overall quality wheat cultivars receiving the overall quality scores of 6.0 or less.
Conclusion
Differences in the roller mill types used in the quality evaluation were observed. The short-flow mills, Quad. Jr. and Sr., showed higher flour and dough quality scores, but lower milling, baking, and overall quality scores. In contrast, the Buhler and MIAG mills showed higher milling, baking, and overall quality scores. Despite the difference of quality scores, the mills showed consistency in evaluating wheat samples for quality as shown by significant (p < 0.01) correlations occurring for the overall quality score. The consistency of mill performance was especially evaluated with the MIAG mill, since it resembles a commercial milling system. Among short-flow mills, the Quad. Sr. mill is thought to be more appropriate for quality evaluation of HRS wheat samples especially when sample quantity is limited since significant (p < 0.05) correlations appeared for most of the flour, dough, and bread-making quality traits with the MIAG mill. The quality scoring system appeared to be effective for segregation of HRS wheat samples. Especially, the overall quality score varied significantly (p < 0.001) for the HRS wheat samples in this experiment, indicating that the score system could be used to segregate wheat samples for quality in an objective, comprehensive, and straightforward way. From the results obtained in this study, we conclude that the Quad. Sr. mill with the comprehensive overall scoring system developed in this research may be used effectively in objectively ranking the HRS wheat samples for quality evaluation especially when sample quantity is limited in breeding program or industry.
Acknowledgments
The authors would like to thank Alyssa Jodock (USDA-ARS) and DeLane Olsen (NDSU) for their technical assistances.
Additional information
Funding
Related Research Data
References
- Carson, G. R.; Edwards, N. M. Criteria of Wheat and Flour Quality. In Wheat: Chemistry and Technology; Khan, K., Shewry, P., Eds.; AACC International: St. Paul, 2009. pp 97–118.
- North Dakota Wheat Commision. Us Hard Red Spring Wheat Regional Crop Quality Report. http://www.ndwheat.com/uploads/resources/973/finalhrs15.pdf (accessed Oct 27, 2017).
- Nolte, L.; Youngs, V.; Crawford, R.; Kunerth, W. Computer Program Evaluation of Durum and Hard Red Spring Wheat; Cereal Foods World, 1985, 30, 227-229.
- Baasandorj, T.; Ohm, J.-B.; Manthey, F.; Simsek, S. Effect of Kernel Size and Mill Type on Protein, Milling Yield, and Baking Quality of Hard Red Spring Wheat. Cereal Chemistry 2015, 92(1), 81–87. DOI: 10.1094/CCHEM-12-13-0259-R.
- Souza, E.; Griffey, C.; Kweon, M.; Guttieri, M. Sources of Variation for Long-Flow Experimental Milling. Crop Science 2008, 48(4), 1432–1440. DOI: 10.2135/cropsci2007.10.0562.
- Guttieri, M. J.; Souza, E. J.; Sneller, C. Laboratory Milling Method for Whole Grain Soft Wheat Flour Evaluation. Cereal Chemistry 2011, 88(1), 1–5. DOI: 10.1094/CCHEM-02-10-0017.
- AACC-I. American Association of Cereal Chemists International Approved Methods of Analysis. http://www.aaccnet.org/ApprovedMethods (accessed Oct 27, 2017).
- Posner, E. S.; Hibbs, A. N. Wheat Flour Milling; American Association of Cereal Chemists, Inc: St. Paul, 2005
- Doblado-Maldonado, A. F.; Rose, D. J. Particle Distribution and Composition of Retail Whole Wheat Flours Separated by Sieving. Cereal Chemistry 2013, 90(2), 127–131. DOI: 10.1094/CCHEM-09-12-0124-R.
- Hatcher, D.; Kruger, J.; Anderson, M. Influence of Water Absorption on the Processing and Quality of Oriental Noodles. Cereal Chemistry 1999, 76(4), 566–572. DOI: 10.1094/CCHEM.1999.76.4.566.
- Matsuki, J.; Okunishi, T.; Okadome, H.; Suzuki, K.; Yoza, K.; Tokuyasu, K. Development of a Simple Method for Evaluation of Water Absorption Rate and Capacity of Rice Flour Samples. Cereal Chemistry 2015, 92(5), 487–490. DOI: 10.1094/CCHEM-01-15-0004-N.
- Roman-Gutierrez, A. D.; Mabille, F.; Guilbert, S.; Cuq, B. Contribution of Specific Flour Components to Water Vapor Adsorption Properties of Wheat Flours. Cereal Chemistry 2003, 80(5), 558–563. DOI: 10.1094/CCHEM.2003.80.5.558.
- Aamodt, A.; Magnus, E. M.; Færgestad, E. M. Effect of Protein Quality, Protein Content, Bran Addition, Datem, Proving Time, and Their Interaction on Hearth Bread. Cereal Chemistry 2004, 81(6), 722–734. DOI: 10.1094/CCHEM.2004.81.6.722.
- Baasandorj, T.; Ohm, J.-B.; Simsek, S. Effects of Kernel Vitreousness and Protein Level on Protein Molecular Weight Distribution, Milling Quality, and Breadmaking Quality in Hard Red Spring Wheat. Cereal Chemistry 2016, 93(4), 426–434. DOI: 10.1094/CCHEM-09-15-0181-R.