
 ?Mathematical formulae have been encoded as MathML and are displayed in this HTML version using MathJax in order to improve their display. Uncheck the box to turn MathJax off. This feature requires Javascript. Click on a formula to zoom.
ABSTRACT
In this study, the effects of five cooking methods on nutritional value and flavor of turbot muscle were evaluated. Chemical compositions of samples were determined using AOAC methods, and the fatty-acid composition was determined by gas chromatography–mass spectrometry (GC–MS). Flavors of samples cooked using different methods were characterized by electronic nose. Volatile compounds were determined using solid-phase microextraction (SPME) followed by gas GC–MS. All the samples were investigated before/after cooking. The results showed that the fatty acids found in abundance in the raw sample were C22:6n-3, C16:0, C18:1n-7, and C20:5n-3. All of the fatty acids were detected in steamed samples, while some of the fatty acids were degraded in other cooking methods. Electronic nose can be used to distinguish samples cooked differently. 20, 17, 34, 20, and 23 compounds were detected in samples cooked by frying, baking, microwave heating, boiling in vacuum-sealed bag (BIVSB) and steaming, respectively. Aldehydes, ketones, alcohols, acids, and hydrocarbons were the main volatile components detected. In summary, steaming preserves water, protein, lipids and fatty acids the best in cooked samples while generates desirable flavor, it is recommended as the choice of cooking for turbot.
Introduction
Cultivation of turbot (Scophthalmus maximus) is a fast-growing aquaculture industry. Turbot is high demand in countries where consumers prefer white, firm, and tasty fishes. [Citation1] Turbot is a commercially important marine fish for aquaculture in northern China. [Citation2–Citation4] The harvest of flounder fish were 118,009 tons, it was the third maricultural fish in China in 2016. [Citation5]
Cooking is usually necessary to obtain palatable and pathogen-free foods. Suitable cooking minimizes the nutrient loss and improves the eating properties of food [Citation6], while inappropriate cooking may lead to excessive nutrient loss and deteriorated eating quality. Fish is an important part of the diet for people around the world, being a good source of high-quality proteins, vitamins, and other essential nutrients, such as n-3 polyunsaturated fatty acids (PUFAs) and trace minerals. [Citation1] In general, the PUFAs are more susceptible to oxidation during cooking than their saturated analogues; however, several studies showed that EPA and DHA contents remained stable in some fish species during certain types of cooking. [Citation7] Clearly, cooking method may have an important role in determining the final content of nutrients in fish. [Citation8]Effects of different processing and cooking methods on nutritive values and mineral contents of different fish species have been previously studied. [Citation7–Citation10] Gladyshev [Citation11] studied the effect of cooking on the essential PUFAs in muscle tissue of humpback salmon. The samples were fried, boiled, and roasted. They found that heat treatment in general did not decrease the EPA or DHA content, except for a moderate reduction of them in fried samples. It was reasoned that the high levels of natural antioxidants in salmon protect EPA and DHA during cooking. Marimuthu [Citation12] studied the effects of different cooking methods (boiling, baking, frying, and grilling) on proximate and mineral composition of snakehead fish, the changes in the amount of protein and fat were found to be significantly higher in frying and grilling fish. The ash content increased significantly whereas that of the minerals (Na, K, Ca, Mg, Fe, Zn, and Mn) was not affected in all cooking methods. However, there is no literature on the effects of different cooking methods on the nutritional components and volatile flavor components of fish.
With the rapid development of the food industry, and people’s consumption habit tend to change overtime, the requirements of food grade is getting higher and higher. By studying the effect of cooking methods on the proximate composition, fatty-acid profile and flavor of turbot muscle, insight could be obtained to provide theoretical guidance for processing fish products more effectively, and for the development of follow-up foodstuffs.
Materials and methods
Materials
Turbot (n = 30, 1.3–1.5kg and length 38–42 cm) were randomly selected from a local market (Changxing Market, Dalian, China) and kept on ice and transported to laboratory within 0.5 h of purchase. Fish was killed by a sharp blow on head, the muscle part was cut into sample cubes of 1.5 cm3 × 1.5 cm3 × 1.0 cm3 following skin removal. Samples were fried with soybean oil in a frying pan (190 ± 10 °C, 70 s); baked in an oven (170 °C, 11 min); cooked in a microwave oven (moderate heat, 16 s);packed in a vacuum plastic bag and boiled in water (80 °C, 4 min); steamed for 4 min [Citation10,Citation13–Citation15], respectively.
Proximate analysis
Proximate composition was determined by using standard AOAC methods. [Citation16] Moisture content was measured gravimetrically by drying the sample to a constant weight in an oven at 105 °C for 16 h. The crude ash content was estimated by incineration in a muffle furnace at 550 °C for 5–6 h until the sample was completely free of carbon particles. The crude protein content was determined by Kjeldahl methods with a Kjeldahl azotometer (KDN-103F, Shanghai QianJian Instrument Company, Shanghai, China). Fat content was determined by Soxhlet method with a fat tester (SZF-06A, Shanghai XinJia Electronics Company, Shanghai, China). Total carbohydrate content was determined by phenol-sulfuric acid method. All analyses were performed in triplicate.
Analysis of fatty acids
The total lipids were extracted using chloroform/methanol (2/1, v/v) according to Folch et, al. [Citation17] After extraction, they were methylated as described by Zhu et al. [Citation18] Fatty Acid Methyl Ester(FAMEs) were analyzed by gas chromatography–mass spectrometry (GC–MS) using an Agilent 7890A/5975C GC/MS system equipped with a HP-5MS capillary column (30 m× 0.25 mm× 0.25 μm; Palo Alto, CA, USA) as previously reported. [Citation19] The FAMEs were identified by comparing the relative retention time with that of authentic standards (37-component FAME mix; Supelco Inc., Bellefonte, PA, USA), and referenced with the NIST14 mass spectral database. The compositions of fatty acids in raw and cooked turbot muscle samples were analyzed in triplicate.
Electronic nose detection
The aroma quality of turbot during the cooking process was investigated using an e-nose system (e-nose, PEN3, WNA Airsense Analysentechnik GmbH, Schwerin, Germany). The device was equipped with 10 different metal oxide sensors positioned in a small chamber. The e-nose system consisted of a sampling apparatus, a detector unit containing the array of sensors, and pattern recognition software for data recording and analysis. [Citation20]
Five grams of turbot muscle samples were put in a 30 mL vial. Then the headspace gas was pumped into the sensor chamber, and this measurement phase lasted for 80 s for the sensors to reach stable values. During the measurement process, chamber flow rate was 300 mL min−1, and injection flow rate was 300 mL min−1. All the samples were measured with the same parameters, and every measurement was replicated at least three times until the stable results were obtained.
Analysis of volatile compounds
Five grams of turbot muscle samples were homogenized for 4 min with saturated NaCl solution (25 mL). The mixture was centrifuged (10 min, 2500 g), and 3 mL of supernatant was transferred to a 10 mL headspace vial and sealed with polytetrafluoroethylene/silicone septa and a steel cap. Internal standard (cyclohexanone, 50 mg/L, 20 μL) was added into sample prior to extraction. The vials and their contents were preheated for 5 min in a Combi PAL autosampler (CTC, Switzerland) before insertion of a divinylbenzene/carboxen/polydimethylsiloxane (DVB/Car/PDMS) solid-phase microextraction (SPME) fiber into the headspace. The fiber was withdrawn and inserted into the GC injector for holding for 2 min. To improve extraction efficiency, turbot muscle was used to evaluate the parameters that affected SPME. Various cooked samples were tested. [Citation21]
The volatile compounds were separated using an HP-5MS capillary column. The GC oven temperature was set as such at 35 oC for 3 °min, heating to 70 oC at a rate of 3 oC/min, to 200 oC at 10 oC/min, and then to 260 oC at 20 oC/min, and held for 5 min. Helium flow rate was 1.5 mL/min. The injector was operated in splitless mode, and its temperature was 260°C.
The MS was operated in electron ionization mode (70 eV), and data were acquired in full scan mode for the range of 29–400 Da. The temperatures of the source and detector were 150 °C and 230 °C, respectively. A series of n-alkanes (C8–C20) were analyzed under the same GC conditions to calculate the retention index (RI). Compounds were tentatively identified by comparing the mass spectra with those in the NIST14 mass spectral library, and by comparing the RI with those in the LRI database (http://www.odour.org.uk/lriindex.htmL). The volatiles were semi-quantitatively measured using the internal standard cyclohexanone, assuming a relative response factor of one for each compound. Raw and all 35 cooked samples were analyzed in triplicate.
Determination of the key flavor compounds: With a relatively odor activity value method (relative odor activity value, ROAV), defining the component which had a greatest contribution to the total flavor to have an ROAVstan = 100, ROAV values of other volatile components were calculated by
Cri and Ti represent the relative content of each volatile component and the corresponding threshold value of sensation; Crstan and Tstan present the relative percentage content and the corresponding threshold value of the component of the total flavor of the sample, respectively.
Statistical analysis
Statistical analysis was performed using SPSS 16.0 (SPSS Inc., Chicago, IL, USA). The significant difference between means was set at p < 0.05, and evaluated using ANOVA. The differences among the aroma profiles of different samples were analyzed by principal component analysis (PCA). All graphs were drawn using Origin 8.5 (OriginLab Corp., Hampton, USA).
Results and discussion
Nutritional composition
The proximate compositions of turbot muscle samples processed under different cooking methods are shown in . The moisture content of the fish fillets varied from 62.44 ± 1.67% to 78.68 ± 1.32%, showing reduction after cooking, and the fried fillets had the lowest moisture content. The moisture contents were shown to be inversely related to the total lipid content, which might be attributed to the oil penetrating into the food after water was evaporated during cooking. [Citation12] For cooked fresh, fried samples had the highest protein content (27.62 ± 0.62g/100g). The protein content of the cooked samples was higher than raw sample, which might be due to the sample after the cooking, other nutrients lost more, resulting in a slight increase in the relative content of protein. Abdelrahman had the similar result [Citation22]. Fried sample had the highest fat content, which might be due to the tissue of fried sample was damaged seriously, water loss more, resulting in more oil into fish tissue. Followed by raw and steamed samples, between of them had no significant difference, vacuumed sample had the lowest fat content, which might be due to the sample in vacuum-sealed packaging before cooking, the sample was squeezed in a vacuum environment, leading to fat loss more during cooking. Dana et al. [Citation23] studied the effect of different cooking methods on the fat content of the fish patties have the similar result. For the ash content offered, microwaved, BIVSB, steamed, baked and raw fish was 1.10 ± 0.06g/100g, 1.09 ± 0.14g/100g, 0.78 ± 0.02g/100g, 1.12 ± 0.10g/100g, 1.26 ± 0.07g/100g and 1.18 ± 0.07g/100g, respectively. Fried sample had the lowest ash content, which might be due to high temperature of frying damaged the tissue severely, leading to many mineral into the oil. [Citation24] Fried sample had the highest content of carbohydrate, other groups had no significant difference, indicating that the carbohydrate contents were affected less by cooking methods.
Table 1. Proximate composition (g/100g) of turbot muscle cooked by different methods.
Analysis of fatty acids
The fatty-acid profiles of the raw and cooked samples are presented in . The main fatty acids found in raw samples were as follows: C22:6n-3(20.37%), C16:0(18.05%), C18:1n-7(18.03%), and C20:5n-3 (8.23%), respectively. Fried fish had a much higher level of linoleic acid (18:2n-6) content (55.02%) which came from the soybean oil used for frying, confirming oil penetration during frying. [Citation25,Citation26] EPA(C20:5n-3) reduced from 8.23% to 0.37% and DHA(C22:6n-3) from 20.37% to 1.57%. The reduction of EPA and DHA confirmed the high susceptibility of PUFAs to high-temperature cooking. [Citation27] Other cooking methods, which were at more moderate temperature, had far less influence to DHA and EPA contents. Compared with raw sample, only steamed samples retained all the fatty acids, while other cooking methods all caused losses of fatty acids to different degrees.
Table 2. Fatty acids composition relative content (%) of turbot muscle cooked by different methods.
Analysis of volatile compounds
As shown in , 20, 17, 34, 20, and 23 volatile compounds including ketones, alcohols, acids, hydrocarbons, and aldehydes were detected in samples cooked by frying, baking, microwave heating, BIVSB, and steaming, respectively. Among them, the content of ketones in fresh turbot muscle samples is the highest, reaching 60.06% of all volatile compounds, followed by aldehydes (21.82%). Apparently, flavor of turbot samples develops through a series of chemical reactions, such as Maillard reaction and lipid oxidation, which results in the formation of a large number of volatile compounds. [Citation28]
Table 3. Volatile components relative content (%) of turbot muscle cooked by different methods.
Ketones mainly come from the oxidation of PUFAs, or the thermal degradation, oxidation or microbial degradation of amino acids. Ketones have unique fragrance and fruity flavor. [Citation29] Wang et al. [Citation30] reported that the characteristic flavor contributor in turbot was 2-undecanone. In this study, 2-undecanone was only detected in microwaved samples, suggesting that microwaving may enhance the fruity flavor in cooked turbot.
Generally, saturated C6-C12 aldehydes produce grassyand fragrant smell of fat. In food, they are important olfactory substances with lower threshold [Citation31] for detection. In this study, hexanal, heptanal, and (E,E)-2,4-heptadienal were detected in raw samples. After cooking, more aldehyde compounds emerged. The relative content of heptanal, characteristic of fishy odor, was 7.07% in fresh samples. After cooking, the content of heptaldehydes was greatly reduced: in fried samples, it was 0.85% and non-detectable in other samples. This is one of the reasons for the much decreased fishy smell in cooked samples.
The appearance of many anthracene, naphthalene, and derivatives in turbot samples is alarming. These compounds originate from environmental pollutants. In agreement with Wang et al. [Citation32], our study confirmed that many fishes were polluted by their habitual environment nowadays. The contributions of volatile compounds to the overall flavor of the samples were evaluated by their concentration and sensory thresholds, respectively. Because the hexanal content was high, and its olfactory threshold was low, we selected it to be the reference for the ROAV, with its ROAVstan = 100 combined with the relative percentages and olfactory thresholds of volatile components as shown in . Since the non-anal content was higher in steamed, microwave, and vacuum water-heated samples and had smaller olfactory threshold, from a comprehensive analysis of the overall flavor contributions of the three samples, we considered the ROAV of nonanal in steamed, microwave, and vacuum water-heated samples ROAVstan = 100. Other volatile flavor compounds of ROAV could be obtained by the method of calculation of 2.4, and analyzed the main flavor components of each sample, and described the odor characteristics of important flavor compounds. The results are shown in .
Table 4. Some known relative odor activity values and characteristic odor of turbot muscle cooked by different methods.
As shown in , larger the ROAV of a component, greater the contribution of that component to the overall flavor of the samples. Generally, it is considered that when ROAD≥ 1 substance was the main flavor component analysis of the sample [Citation29], but when 0.1≤ ROAV≤ 1, the material also had important influence on the overall flavor samples.
shows that the main flavor components in the samples were changed by cooking: from aldehyde, heptyl aldehyde, and (E, E)-2,4-heptadienal in the fresh samples, to nonanal, hexanal, and 1-methyl naphthalene in stemed samples; nonanal, hexanal, heptanal, octanal, and (E, E)-2,4-heptadienal in the fried samples, nonanal, hexanal, octanal, and 1-methyl naphthalene in the microwaved samples; hexanal, (E)-2-hexenal and (E,E)-2,4-heptadienal in the baked samples; and nonanal, hexanal, octanal, and (E)-2-decene aldehyde in boiled samples. In general, aldehydes were the overwhelmingly important flavor compounds in cooked turbot. Fishy smell of raw samples came from heptaldehyde, which disappeared after cooking. Hexanal was a product of 13-hydrogen peroxide from breaking the auto oxidation of linoleic acid after cracked. [Citation30] In cooked turbot, saturated straight chain aldehydes such as hexanal (grassy) [Citation33], heptanal (fishy) [Citation34], and nonanal [Citation31] (fat fragrant grass scent) are the main contributors to its flavor.
Electronic nose
PCA is commonly performed to identify patterns of correlation between individual factors (i.e., compositional variables) involved in the differentiation among different samples. Typically, samples with similar patterns or properties are represented by closely-patterned clusters of points in a PCA plot. [Citation20] shows the PCA plot with the primary and secondary PC scores, PC1 and PC2, where PC1 explains 99% of the sample variance and PC2 explains only 1%. Therefore, the majority of the variance among samples was captured by PC1. Although only small portion of the variance was captured in PC2, it was still important in determining certain factors pertaining to the effects of the cooking treatments. [Citation35,Citation36]
Figure 1. PCA plot of electronic nose of turbot muscle cooked by different methods.
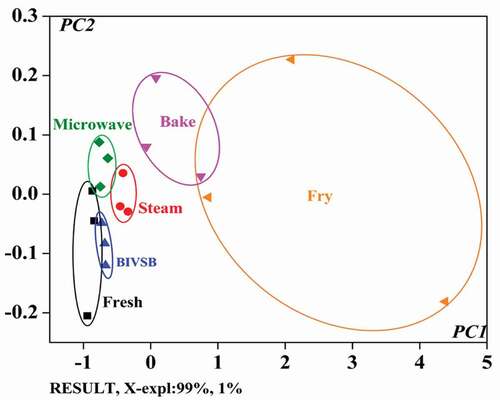
As shown in , turbot samples could be differentiated by e-nose based on their flavor profiles, which were determined by how they were cooked. Cluster corresponding to fried samples is farther away from those corresponding to samples cooked by other means, indicating that frying caused most significant changes to the turbot samples. These results are in good agreement with those of GC–MS analysis. The flavor of fish was influenced greatly by aldehydes, ketones, alcohols, and hydrocarbons. [Citation37,Citation38] They are shown in . Fried, baked, microwaved, boiled, and steamed samples were 20, 17, 34, 20, and 23 types, respectively.
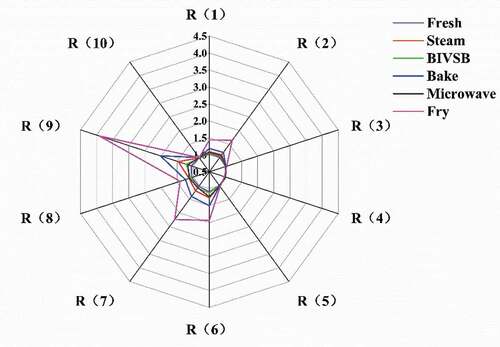
shows the effects of cooking methods on the flavor profile of the fish samples. The response value of the sensor more obvious changes from big to small are R (2), R (6), R (7), and R(9), indicating that after processed by these five kinds of cooking methods, compounds of nitroxides R(2), methane R(6), inorganic sulfide R(7), aromatic components, and organic sulfide R(9) increased in samples; and frying has the most significant impact on the flavor of the samples.
Figure 2. Radar chart of electronic nose of turbot muscle cooked by different methods.
Conclusion
The moisture contents did not change much in turbot samples cooked by microwave heating, boiling, or steaming comparing to the fresh samples. Fried samples on the other hand suffered the largest water loss and had the highest fat content. A total of 16 kinds of fatty acids were detected in the fresh turbot muscle samples; they went through changes during cooking, but the degree of change is highly dependent on the cooking method, microwaving and steaming caused minimal destruction of fatty acids in samples. Electronic nose could be used to distinguish samples prepared by different cooking methods. The aldehydes dominate flavor of cooked turbot. Heptaldehyde, octanal, nonanal, and hexanal were the most important compounds that determine turbot flavor. Taking into account preservation of valuable nutrient (e.g., fatty acids) and enhanced flavor, steaming is appeared to be the best cooking method for processing turbot.
Additional information
Funding
References
- Martınez, B.; Miranda, J. M.; Rodriguez, J. L.; Nebot, C.; Cepeda, A.; Franco, C. M. Differentiat-Ion of Farmed and Wild Turbot (Psetta Maxima): Proximate Chemical Composition, Fatty Acid Profile, Trace Minerals and Antimicrobial Resistance of Contaminant Bacteria. Journal of Food Science and Technology International 2010, 5(16), 435–441. DOI: 10.1177/1082013210367819.
- Lee, J. K.; Cho, S. H.; Park, S. U.; Kim, K.-D.; Lee, S.-M. Dietary Protein Requirement for Young Turbot (Scophthalmus Maximus L.). Journal of Aquaculture Nutrition 2003, 9(4), 283–286. DOI: 10.1046/j.1365-2095.2003.00255.x.
- Rodríguez, Ó.; BARROS-VElÁZQUEZ, J.; Ojea, A.; Piñeiro, C.; Aubourg, S. P. Evaluation of Sensory and Microbiological Changes and Identification of Proteolytic Bacteria during the Iced Storage of Farmed Turbot (Psetta Maxima.). Journal of Food Science 2003, 68(9), 2764–2771. DOI: 10.1111/j.1365-2621.2003.tb05802.x.
- Laura, C.; Laura, S.; Laszlo, O. Sex-Associated DNA Markers from Turbot. Journal of Marine Biology Research 2011, 7(4), 378–387. DOI: 10.1080/17451000.2010.515226.
- Zhang, X. L.; 2017 China Fishery Statistical Yearbook; China Agriculture Press: Beijing, China, 2017
- Zhang, Y.; Wang, X. H.; Wang, W.; Zhang, J. M. Effect of Boiling and Frying on Nutritional Value and in Vitro Digestibility of Rabbit Meat. African Journal of Food Science 2014, 24, 8, 92–103.
- Hedayat, H.; Maryam, M.; Masoud, R.; Leila, M.; Ramin, K.; Nader, K. K.; Aria, B. Effect of Different Cooking Methods on Minerals, Vitamins and Nutritional Quality Indices of Kutum Roach (Rutilusfrisiikutum). Food Chemistry 2014, 148(3), 86–91. DOI: 10.1016/j.foodchem.2013.10.012.
- Badiani, A.; Stipa, S.; Bitossi, F.; Pirini, M.; Bonaldo, A.; Gatta, P. P.; Rotolo, M.; Testi, S. True Retention of Nutrients upon Household Cooking of Farmed Portion-Size European Sea Bass (Dicentrarchus Labrax L.). Journal of LWT-Food Science and Technology 2013, 50(1), 72–77. DOI: 10.1016/j.lwt.2012.06.026.
- Unlusayin, M.; Kaleli, S.; Gulyavuz, H. The Determination of Flesh Productivity and Protein Components of Some Fish Species after Hot Smoking. Journal of the Science of Food and Agriculture 2001, 81(7), 661–664. DOI: 10.1002/jsfa.862.
- Gokoglu, N.; Yerlikaya, P.; Cengiz, E. Effects of Cooking Methods on the Proximate Composition and Mineral Contents of Rainbow Trout (Oncorhynchus Mykiss). Journal of Food Chemistry 2004, 84(1), 19–22. DOI: 10.1016/S0308-8146(03)00161-4.
- Gladyshev, M. I.; Sushchik, N. N.; Gubanenko, G. A.; Demirchieva, S. M.; Kalachova, G. S. Effect of Way of Cooking on Content of Essential Polyunsaturated Fatty Acids in Muscle Tissue of Humpback Salmon. Food Chemistry 2006, 96(3), 446–451. DOI: 10.1016/j.foodchem.2005.02.034.
- Marimuthu, K.; Thilaga, M.; Kathiresan, S.; Xavier, R.; Mas, R. H. M. H. Effect of Different Cooking Methods on Proximate and Mineral Composition of Striped Snakehead Fish (Channa Striatus, Bloch). Food Science Technology 2012, 49(3), 373–377. DOI: 10.1007/s13197-011-0418-9.
- Gross, G. A.; Gruter, A. Quantitation of Mutagenic/Carcinogenic Heterocyclic Aromatic Amines in Food Products. Journal of Chromatography A 1992, 592(1–2), 271–278. DOI: 10.1016/0021-9673(92)85095-B.
- Gross, G. A.; Turesky, R. J.; Fay, L. B.; Stillwell, W. G.; Skipper, P. L.; Tannenbaum, S. R. Heterocyclic Aromatic Amine Formation in Grilled Bacon, Beef and Fish and in Grill Scrapings. Journal of Carcinogenesis 1993, 14(11), 2313–2318. DOI: 10.1093/carcin/14.11.2313.
- Jagerstad, M.; Laser-Reuterswrd, A.; Olsson, R.; Grivas, S.; Nyhammar, T.; Olsson, K.; Olsson, A. Creatin(In)E and Maillard Reaction Products as Precursors of Mutagenic Compounds: Effects of Various Amino Acids. Journal of Food Chemistry 1983, 12(4), 255–264. DOI: 10.1016/0308-8146(83)90014-6.
- AOAC. Official Methods of Analyses, 18th ed.; Association of Official Analytical Chemists: Washington DC, 2007.
- Folch, J.; Lees, M.; Sloane-Stanley, G. H. A Simple Method for the Isolation and Purification of Total Lipids from Animal Tissues. Journal of Biological Chemistry 1957, 226, 497–509.
- Zhu, B. W.; Qin, L.; Zhou, D. Y.; Wu, H. T.; Wu, J.; Yang, J. F.; Li, D. M.; Dong, X. P.; Murata, Y. Extraction of Lipid from Sea urchin(Strongylocentrotus Nudus) Gonad by Enzyme-Assisted Aqueousand Supercritical Carbon Dioxide Methods. Journal of European Food Research and Technology 2010, 230(5), 737–743. DOI: 10.1007/s00217-010-1216-8.
- Li, D. M.; Zhou, D. Y.; Zhu, B. W.; Chi, Y. L.; Sun, L. M.; Dong, X. P.; Qin, L.; Qiao, W. Z.; Murata, Y. Effects of Krill Oil Intake on Plasma Cholesterol and Glucose Levels in Rats Fed a High-Cholesterol Diet. Journal of Science and Food Agriculture 2013, 93(11), 2669–2675. DOI: 10.1002/jsfa.6072.
- Li, C. P.; Wu, J. J.; Li, Y.; Dai, Z. Y. Identification of the Aroma Compounds in Stinky Mandarin fish(Siniperca Chuatsi) and Comparison of Volatiles during Fermentation and Storage. International Journal of Food Science and Technology 2013, 48, 2429–2437.
- Sousa, E. T.; Rodrigues, F. D. M.; Martins, C. C.; De Oliveira, S. F.; Pereira, P. A. D. P.; De Andrade, J. B. Multivariate Optimization and HS-SPME/GCMS Analysis of VOCs in Red, Yellow and Purple Varieties of Capsicum Chinense Sp. Peppers. Microchem Journal 2006, 82(2), 142–149. DOI: 10.1016/j.microc.2006.01.017.
- Abdelrahman, S. T.;. Effect of Cooking Methods and Freezing Storage on the Quality Characteristics of Fish Cutlets. Advance Journal of Food Science and Technology 2014, 6(4), 468–479. DOI: 10.19026/ajfst.6.56.
- Saguy, I. S.; Dana, D. Integrated Approach to Deep Fat Frying: Engineering, Nutrition, Health and Consumer Aspects. Journal of Food Engineering 2003, 56(2), 143–152. DOI: 10.1016/S0260-8774(02)00243-1.
- Ersoy, B.; Özeren, A. The Effect of Cooking Methods on Mineral and Vitamin Contents of African Catfish. Food Chemistry 2009, 115(2), 419–422. DOI: 10.1016/j.foodchem.2008.12.018.
- Unusan, N.;. Change in Proximate, Amino Acid and Fatty Acid Contents in Muscle Tissue of Rainbow Trout after Cooking. International Journal of Food Science and Technology 2007, 42(9), 1087–1093. DOI: 10.1111/j.1365-2621.2006.01354.x.
- Weber, J.; Bochi, V. C.; Ribeiro, C. P.; Victorio, A. M.; Emanuelli, T. Effect of Different Cooking Methods on the Oxidation, Proximate and Fatty Acid Composition of Silver Catfish (Rhamdia Quelen) Fillets. Food Chemistry 2008, 106(1), 140–146. DOI: 10.1016/j.foodchem.2007.05.052.
- Castro, F.; Campos, F. M.; Costa, N. M. B.; Silva, M. T. C. Fatty Acid Composition of Three Freshwater Fishes under Different Storage and Cooking Processes. Food Chemistry 2007, 103(4), 1080–1090. DOI: 10.1016/j.foodchem.2006.10.002.
- Wu, H. Y.; Xie, W. T.; Hong, Y. X. The Evaluation of Volatile Components in Pickled Gold Fish by Using SPME-GC-MS. Food Science 2009, 18, 278–281.
- Liu, D. G.; Zhou, G. H.; Xu, X. L. A New Method to Determine the Key Flavor Compounds in Foods: “ROAV” Method. Food Science 2008, 29, 7, 370–374.
- Wang, L.; Wang, X. C. Research on Odor in Different Parts of Grass Carp. Food Research 2010, 31, 6, 158–164.
- Deng, J. C.; Wang, X. C.; Liu, Y. Dark Puffer and Red Fin Takifugu Odor Composition Differences. Food Science 2009, 30, 22, 335–339.
- Wang, X. C.; Headspace Solid Phase Micro Extraction and GC-MS Analysis in Silver Carp Meat Flavor Components. Shanghai Fisheries University Journal 2005, 14, 2, 176–180.
- Zhang, Q.; Wang, X. C.; Liu, Y. SDE-GC-Olfactometry Combined with Research of Silver Carp Fish Odor Active Volatile Substances. Anhui Agricultural Sciences 2009, 37, 4, 1407–1409.
- Feng, Q. Q.; Hu, F.; Li, P. F. SPME-GC-MS Analysis of Volatile Flavor Components in Tilapia. Food Industrial Science and Technology 2012, 33, 6, 67–70.
- Flores, M.; Grimm, C. C.; Toldra, F. Correlations of Sensory and Volatile Compounds of Spanish “Serrano” Dry-Cured Ham as a Function of Two Processing Times. Journal of Agriculture and Food Chemistry 1997, 45(6), 2178–2186. DOI: 10.1021/jf960862c.
- Machiels, D.; Saskia, M.; Ruth, V. Gas Chromatographyolfactometry Analysis of the Volatile Compounds of Two Commercial Beef Meats. Talanta 2003, 60(4), 755–764. DOI: 10.1016/S0039-9140(03)00133-4.
- Mottram, D. S.;. Flavour Formation in Meat and Meat Products: A Review. Food Chemistry 1998, 62(4), 415–424. DOI: 10.1016/S0308-8146(98)00076-4.
- Macleod, G.; Seyyedain-Ardebili, M. Natural and Simulated Meat Flavors (With Particular Reference to Beef). CRC Critical Reviews in Food Science and Nutrition, London 1981, 14(4), 309–437.