
ABSTRACT
Potato is a good source of dietary energy and several micronutrients, and the development of staple foods using potato-wheat blended powder has received much attention recently in China. A rapid and accurate method for determining the potato flour content in potato staple foods would be valuable to market regulation efforts. We developed a predictive model for the potato flour content in potato-wheat blended powders based on near-infrared spectroscopy (NIRS) analysis. The correction of the near-infrared optical path was carried out to eliminate optical path differences using multiplicative scatter correction (MSC) and smoothing of the spectra using the Savitzky-Golay smoothing first-orderderivative (S-G-1stD).The prediction model was developed based on partial least squares (PLS) combined with cross-validation(CV) within the full spectrum(850–1100 nm). The results showed that the optimal main factors of potato flour content in potato-wheat blended powder were 9, and the coefficient of determination of calibration (R2c) and standard error of cross-validation (SECV) of the prediction model reached 0.9997 and 0.51, respectively, indicating a good correlation. The repeatability standard deviation (SDr) and repeatability coefficient of variation of cross-validation (CVr) in validated samples were 0.246 and 0.967, respectively, which indicated that the prediction model had good repeatability. The bias-corrected standard error of prediction (SEP) and correlation coefficient of validation (R2P) were 0.69 and 0.9995, respectively, demonstrating good accuracy and stability. The results of this study demonstrated that this prediction model based on NIRS could determine the potato flour content in potato-wheat blended powders accurately and quickly.
Introduction
Near-infrared spectroscopy (NIRS) is a physical detection method that was developed in recent decades. This technique is based on the correlation between chemical properties and the absorption of light at specific wavelengths in the near-infrared region. When an organic substance is irradiated with near-infrared light, the light will be absorbed by specific chemical bonds at a specific wavelength, forming a specific absorption spectrum based on the chemical structure of the organic substance. Moreover, the specific absorption peak value is proportional to the quantity of specific chemical bonds in the detected substance, which is in accordance with the Beer Law. Using a predictive model based on the correlation between the NIRS spectrum and chemical components, predicted values of the chemical components in an unknown sample can be quickly determined.[Citation1–Citation3] In recent years, NIRS has been widely used to determine food component content, identify adulterated and pseudo-food products, analyze aquatic meat, and assess fruit quality. The advantages of this method include a high detection speed, a small sample amount, and non-destructive testing.[Citation3–Citation5] Some researchers have developed NIRS-based models to rapidly identify vegetable oil, fruit, milk, and honey adulteration.[Citation5–Citation7] NIRS can also be used to distinguish the species, originand authenticity of tea.[Citation8,Citation9]
Potato is a good source of dietary energy and several micronutrients,[Citation10] and the potato staple foods(such as potato noodles, potato rice noodles and so on) has become an issue in research now,[Citation11–Citation13] the development of staple foods with potato-wheat blended powder has received much attention recently in China. A rapid and accurate method for determining the potato flour content in potato staple foods would be valuable for efforts to prevent adulteration, guarantee quality, and to maintain fair competition in the potato staple food market. Recently, NIRS has been mainly used for the determination of potato components (such as potato dry matter, starch, protein, sugar content), evaluation of potato quality (pathology, breed, and grade).[Citation1,Citation14–Citation17] Li Xin successfully identified potato varieties and determined their dry matter contents using NIRS.[Citation18] and Norbert U.H. determined the protein content in potato powder using NIRS.[Citation15,Citation19] However, no study has described the use of NIRS to determine the potato flour content in a mixture. Accordingly, the present study aimed to determine whether potato flour content in a potato-wheat blended powder could be predicted by NIRS, and a predictive model was established using partial least squares (PLS) combined with cross validation.
Materials and methods
Materials
Wheat flour was purchased from the Inner Mongolia Hengfeng Group. Potato flour was purchased from the Inner Mongolia Linkage Potato Co.,Ltd.
Preparation of samples
The potato-wheat blended powder samples were prepared by mixing wheat flour with potato flour from 0% to 100% with increments of 1%, and a total of 101 samples were used in this study. In order to ensure mixing uniformity, all samples were thoroughly mixed with a MR2L mixer (Chopin (France) Technology Company). The samples were respectively labeled No. 0, 1, 2…100, based on the potato flour ratio in the potato-wheat blended powder. The samples No.8, 23, 44, 46, 77, and 93 were randomly selected and divided in half; one half were used as a modeling samples, and the other half were used as verification samples. Additionally, another nine samples (No.10, 20, 30, 40, 50, 60, 70, 80 and 90) were selected as verification samples. Overall, a total of 92 samples were used for modeling, and a total of 15 samples were used to verify the predictive model.
NIRS measurement of the modeling samples
All 92 modeling samples were scanned with an Infraneo Junior NIR Spectrometer (Chopin (France) Technology Company). Each sample was scanned with three replicates in a black sample cup. The spectra were collected from 890–1100 nm at increments of 2 nm using WinISI II software (Infra Soft International, USA).
Predictive model establishment
During NIR spectra collection, noise such as high-frequency random noise, baseline drift, and light scattering would interfere with the effective spectral analysis of the components in the samples. To improve the performance of spectral models, several spectral preprocessing methods such as Savitzky-Golay (SG) smoothing, derivative processing, multiplicative scatter correction (MSC), and variable standardization are commonly used. SG smoothing retains effective frequency and increases the signal-to-noise ratio using low-pass filtering. Derivative processing eliminates baseline drift or small background interference, enhances spectral band features, and overcomes spectral over lap.[Citation20] MSC effectively eliminates the scattering effect and enhances the spectral absorption information associated with component contents in a sample.[Citation21,Citation22]
The predictive model was established by analyzing the correlation between the NIR spectra and the actual potato flour contents in the potato-wheat blended powder samples using Grams modeling software. The raw spectra were subjected to several pre-processing methods including Savitzky–Golay first and second derivatives (S-G-1stD, S-G-2stD), and multiple scatter correction (MSC) before calibration. In addition, the calibration model was developed based on PLS and cross-validation (CV) within the full spectrum (850–1100 nm).[Citation23]
Model validation
The performance of the calibration model was evaluated using all 15 verification samples. Each sample was scanned five times to obtain the measured values, and these were compared with the actual values to verify the accuracy and reliability of the calibration model using the correlation coefficient (R2P), verifying the standard deviation (SEP), repeatability standard deviation (SDr), and repeatability coefficient of variation (CVr). Finally, the accuracy and adaptability of the predictive model were evaluated using external verification.[Citation24]
Results and discussion
NIR spectra of potato-wheat blended powders
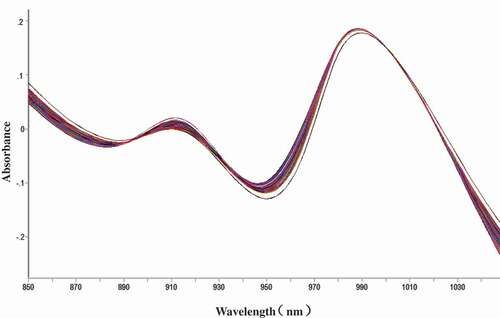
The original NIR spectra of all of 92 potato-wheat blended powder samples are shown in . The NIR spectra of the samples contained two strong absorption peaks in the ranges of 890–960 nm and 960–1100 nm. Moreover, differences in the absorption peaks were observed in samples with different potato flour contents. Near-infrared spectra mainly reveal the composition and content of a sample, and baseline drift and noise will occur in the original NIR spectra due to interference from a variety of factors (light, particle size, density, surface texture, and other physical factors).[Citation25] Because the noise is considerable at some wavelengths, the wavelength range of 850–1100 nm was selected for this study. We found that there were two characteristic absorption peaks at 890–960 nm and 960–1100 nm, and the absorption peak intensities were correlated with the proportion of potato flour in potato-wheat blended powders. Previous studies have shown that the third and second frequency doublings of the O-H stretching vibration occur at 910 nm and 980 nm and that the third and second frequency doublings of the C-H stretching vibration occur at 910 nm and 1100 nm, respectively.[Citation18] The characteristic absorption peaks shown in may have originated from O-H and C-H stretching vibrations in the samples.
Figure 1. NIR spectra of different potato-wheat blended powder samples.
Calibration model establishment
The original NIR spectra were pretreated with SG smoothing and MSC to eliminate the noise and smooth the spectra., the calibration model was accurate with high R2c and lower SECV. As shown in , by comparing R2c and SECV of several different pre-processing methods, S-G-1stD using 5 data points (6 abnormal samples excluded) and MSC pre-processing, calibration used PLS combined with CV yielded the highest R2c (0.99977)and lowest SECV(0.443), confirming a good fit for the developed models, and the principal factor was determined to be 9. Namely, method NO.5 in was the optimum pretreatment method. Using the calibration model, the predicted values of the potato flour content in potato-wheat blended powder samples were calculated. The correlations between the predicted values and actual values of the potato flour content in the potato-wheat blended powder samples are shown in . The proportions of potato flour in the 92 modeling samples ranged from 0% to 100% with increments of 1%, covering a wide range. The results showed that the calibration coefficient R2c and SECV gave at 0.99977 and 0.443respectively, which was less than the 1% increment, indicating a good correlation for the prediction model.[Citation24]
Table 1. Statistical parameters of PLS models different pre-processing methods.
Figure 2. The correlations between the actual values and predicted values of potato flour content in modeling samples.
SG smoothing is a weighted average method involving the polynomial least square fitting of acquired data, and it is commonly used for the smoothing preprocessing of spectra.[Citation18] Following SG smoothing, the derivation can amplify the characteristic spectrum band and effectively eliminate the interference of other background noise to improve the resolution. MSC mainly eliminates the effect of light scattering due to the non-uniformity in the size and density of sample particles, and it is widely used for analyzing NIR spectra of solid particle samples. Therefore, here, MSC combined with the S-G-1stD were used to pre-treat the NIR spectra to eliminate the scattering effect. The PLS method is the most widely used modeling method for NIR quantitative analysis.[Citation20] The PLS method can be used to decompose the spectral matrix as well as the concentration matrix.[Citation26,Citation27] In this study, a prediction model of the potato flour content in potato-wheat blended samples was developed based on PLS combined with CV within the full spectrum (850–1100 nm).The cross calibration standard error (SECV) and the scaling factor (R2c) were the main parameters used to evaluate the performance of the calibration model. A high R2c and small SECV indicate a good prediction model.[Citation24] In this study, the R2c of the predictive model was 0.99977, and the SECV was 0.443, which indicated that the prediction model had a good accuracy. Repeatability is an another important indicator, and the overall deviations between the actual values and predicted values of the potato flour content in the validation samples were small, indicating a good repeatability of the calibration model.
Validation of the predictive model
The predicted values and actual values of the 15 verification samples as well as the standard error of prediction (SEP), SDr, and CVr of each sample shown in . The predicted values have been eliminated the systematic deviation (−0.527).The correlations between the actual values and predicted values of the potato flour content in the 15 verification samples shown in . As shown in , the average SDr and CVr values of the 15 verification samples were 0.246 and 0.967, respectively, indicating good repeatability for the predictive model for measuring potato flour in potato-wheat blended powders. Additionally, the SEP of the predicted values and actual values was 0.69, and the coefficient of determination (R2v) reached 0.9995. Except for the No.90 sample (1.62%), the deviations between the predicted value and actual value of the 15 samples were less than 1%, indicating that the predictive model had good accuracy and stability, and that the prediction error was in accordance with expectations. Because the verification sample set prepared for this study included a wide distribution of values and good representativeness, it was appropriate for use to evaluate the performance of the predictive model.
Table 2. Actual values and predicted values of the potato flour content in the verification sample set and repeatability evaluation.
Figure 3. The correlations between the actual values and predicted values of the potato flour content in the validation samples.
Conclusion
NIRS is an environmentally friendly and rapid method for non-destructive detection. The results of demonstrated that the prediction model developed in this study performed well with a high correlation, small standard deviation, and good repeatability, which indicated that using NIRS to measure the content of potato flour in potato-wheat blended powders is feasible. This method is rapid, does not require any pretreatment, and is reliable and accurate. The results of this study demonstrate that NIR can be effectively used to measure the potato flour content in mixed powders and provide technical support for the rapid determination of the potato flour content in potato staple foods.
Additional information
Funding
Related Research Data
References
- Siesler, H.W.; Ozaki, Y.; Kawata, S.; Heise, H.M. Near-infrared spectroscopy: principles, instruments, applications, Wiley-VCH 2008; 11pp.
- Barton, F. E.; Theory and Principles of near Infrared Spectroscopy. Spectroscopy Europe 2002, 14, 1, 12–19.
- Ferrari, M.; Mottola, L.; Quaresima, V. Principles, Techniques, and Limitations of near Infrared Spectroscopy. Canadian Journal of Applied Physiology 2004, 29, 4, 463–487.
- Escuredo, O.; Gonzalez-Martin, M. I.; Rodriguez-Flores, M. S.; Seijo, M. C. Near Infrared Spectroscopy Applied to the Rapid Prediction of the Floral Origin and Mineral Content of Honeys. Food Chemistry 2015, 170, 47–54. DOI: 10.1016/j.foodchem.2014.08.061.
- Borin, A.; Ferrao, M. F.; Mello, C.; Maretto, D. A.; Poppi, R. J. Least-Squares Support Vector Machines and near Infrared Spectroscopy for Quantification of Common Adulterants in Powdered Milk. Analytica Chimica Acta 2006, 579(1), 25–32. DOI: 10.1016/j.aca.2006.07.008.
- Kumaravelu, C.; Detection, G. A. Quantification of Adulteration in Honey through near Infrared Spectroscopy. International Journal of Food Properties 2015, 18(9), 1930–1935. DOI: 10.1080/10942912.2014.919320.
- Ku, T.; Liu, Y. F.; Gao, J.-L.; Li, S.-H. Near-Infrared Spectroscopy Applications in the Quantitative Determination of Bovine Genomic DNA Content from Milk. Food Science and Technology 2015, 3, 4, 49–55.
- Zhuang, X.; Wang, L.; Chen, Q.; Wu, X.; Fang, J. Identification of Green Tea Origins by Near-Infrared (NIR) Spectroscopy and Different Regression Tools. Science China Technological Sciences 2016, 60(1), 84–90. DOI: 10.1007/s11431-016-0464-0.
- Zhao, J.; Chen, Q.; Huang, X.; Fang, C.-H. Qualitative Identification of Tea Categories by near Infrared Spectroscopy and Support Vector Machine. Journal of Pharmaceutical and Biomedical Analysis 2006, 41(4), 1198–1204. DOI: 10.1016/j.jpba.2006.02.053.
- Hu, -H.-H.; Dai, X. F.; Zhang, H. Research Status of Potato Nutrition and Health Function. Biotechnology & Business 2017, 04, 31–34. in chinese.
- Zhang, H.; Xu, F.; Wu, Y.; Hu, -H.-H.; Dai, X.-F. Progress of Potato Staple Food Research and Industry Development in China. Journal of Integrative Agriculture 2017, 16, 2–10. DOI: 10.1016/S2095-3119(17)61736-2.
- Xu, F.; Hu, -H.-H.; Dai, X.-F.; Liu, Q.-N.; Huang, Y.-J.; Zhang, H. Nutritional Compositions of Various Potato Noodles: Comparative Analysis. International Journal of Agricultural and Biological Engineering 2017, 10, 1, 218–225.
- Shen, Z.; Hu, -H.-H.; Cui, G. Y.; Zhang, H.; Zhang, H. Analysis of Nutritional Components and Evaluation of Edible Quality of Potato Rice Noodles. Food Industry. 2016, 37, 10, 55–60. in chinese.
- Tierno, R.; López, A.; Riga, P.; Arazuri, S.; Jarén, C.; Benedicto, L.; Ruiz De Galarreta, J. I. Phytochemicals Determination and Classification in Purple and Red Fleshed Potato Tubers by Analytical Methods and near Infrared Spectroscopy. Journal of the Science of Food and Agriculture 2016, 96(6), 1888–1899. DOI: 10.1002/jsfa.7294.
- López, A.; Arazuri, S.; Jarén, C.; Mangado, J.; Arnal, P.; Galarreta, J. I. R. D.; López, R. Crude Protein Content Determination of Potatoes by NIRS Technology. Procedia Technology 2013, 8, 488–492. DOI: 10.1016/j.protcy.2013.11.064.
- Haase, N. U.;. Rapid Estimation of Potato Tuber Quality by Near-Infrared Spectroscopy. Starch - Stärke 2006, 58(6), 268–273. DOI: 10.1002/(ISSN)1521-379X.
- Chen, J.-Y.; Zhang, H.; Miao, Y.-L.; Asakura, M. Nondestructive Determination of Sugar Content in Potato Tubers Using Visible and near Infrared Spectroscopy. Japan Journal of Food Engineering 2010, 11, 1, 59–64.
- Dong, Y.; Sørensen, K. M.; He, S.; Engelsen, S. B. Gum Arabic Authentication and Mixture Quantification by near Infrared Spectroscopy. Food Control 2017, 78, 144–149. DOI: 10.1016/j.foodcont.2017.02.002.
- Li, X.; Luo, L.; He, Y.; Xu, N. Determination of Dry Matter Content of Tea by near and Middle Infrared Spectroscopy Coupled with Wavelet-Based Data Mining Algorithms. Computers and Electronics in Agriculture 2013, 98, 46–53. DOI: 10.1016/j.compag.2013.07.014.
- Amorim, M. V.; Costa, F. S.; Aragão, C. F.; Lima, K. M. The Use of near Infrared Spectroscopy and Multivariate Calibration for Determining the Active Principle of Olanzapine in a Pharmaceutical Formulation. Journal of the Brazilian Chemical Society 2017, 28, 5, 920–926.
- Rinnan, S.; Fvd., B.; Engelsen, S. B. Review of the Most Common Pre-Processing Techniques for Near-Infrared Spectra. TrAC Trends in Analytical Chemistry 2009, 28(10), 1201–1222. DOI: 10.1016/j.trac.2009.07.007.
- Mantanus, J.; Ziemons, E.; Lebrun, P.; Rozet, E.; Klinkenberg, R.; Streel, B.; Hubert, P. Moisture Content Determination of Pharmaceutical Pellets by near Infrared Spectroscopy: Method Development and Validation. Analytica Chimica Acta 2009, 642(1–2), 186–192. DOI: 10.1016/j.aca.2008.12.031.
- Han, Z.; Cai, S.; Zhang, X.; Qian, Q.; Huang, Y.; Dai, F.; Zhang, G. Development of Predictive Models for Total Phenolics and Free P-Coumaric Acid Contents in Barley Grain by Near-Infrared Spectroscopy. Food Chemistry 2017, 227, 342–348. DOI: 10.1016/j.foodchem.2017.01.063.
- Buyukcan, M. B.; Kavdir, I. Prediction of Some Internal Quality Parameters of Apricot Using FT-NIR Spectroscopy. Journal of Food Measurement and Characterization 2016, 11(2), 651–659. DOI: 10.1007/s11694-016-9434-9.
- Lammertyn, J.; Nicolai, B.; Ooms, K.; De Smedt, V.; De Baerdemaeker, J. Non-Destructive Measurement of Acidity, Soluble Solids, and Firmness of Jonagold Apples Using NIR Spectroscopy. Transactions of the ASAE-American Society of Agricultural Engineers 1998, 41(4), 1089–1094. DOI: 10.13031/2013.17238.
- Schimann, H.; Joffre, R.; Roggy, J. C.; Lensi, R.; Domenach, A. M. Evaluation of the Recovery of Microbial Functions during Soil Restoration Using Near-Infrared Spectroscopy. Applied Soil Ecology 2007, 37(3), 223–232. DOI: 10.1016/j.apsoil.2007.07.001.
- Mantanus, J.; Ziemons, E.; Lebrun, P.; Rozet, E.; Klinkenberg, R.; Streel, B.; Hubert, P. Active Content Determination of Non-Coated Pharmaceutical Pellets by near Infrared Spectroscopy: Method Development, Validation and Reliability Evaluation. Talanta 2010, 80(5), 1750–1757. DOI: 10.1016/j.talanta.2009.10.019.