
 ?Mathematical formulae have been encoded as MathML and are displayed in this HTML version using MathJax in order to improve their display. Uncheck the box to turn MathJax off. This feature requires Javascript. Click on a formula to zoom.
ABSTRACT
Hyperspectral imaging technique (400–1000 nm) was used for rapid and nondestructive recognition of bruises of apples. A total of 324 hyperspectral images were collected from 108 Fuji apples and the average spectral reflectance was extracted from the region of interest (ROI) of each image. The classification results of AdaBoost for the data pretreated by various existing methods were compared. Then, the correlation-based feature selection (CFS) algorithm was used to obtain characteristic wavelengths for reducing data redundancy. After pretreating with multiplicative scatter correction (MSC) and CFS, the average accuracy of the selected wavelengths was 97.63%. Then, an image processing algorithm based on the characteristic wavelengths selected before was proposed for the visual discrimination of bruises. This algorithm performed independent component analysis (ICA) transformation of the selected wavelengths, and chose the third component image of the ICA transform, then used adaptive threshold segmentation to obtain the bruise region of apples. The results showed that hyperspectral imaging technology could discriminate apple bruise, and this study can help to develop an online apple bruises detection system.
Introduction
Apples are prone to bruises due to external forces that cause physical changes in the texture and eventual chemical alteration without breaking the skin.[Citation1] Bruises usually develop beneath the fruit skin, which are difficult to be detected in a short time period. The damaged tissues become darkened and brownish within a few hours, may soften or dry later, and may lead to the decay by microbial infections.[Citation2] The identification of bruises is also affected by time, bruise type, bruise severity, fruit variety, and storage conditions.[Citation3] Therefore, nondestructive techniques are needed to detect internal damages of apples quickly and effectively. Machine vision technology is already widely applied in the detection of external defects in the apple industry for on-line sorting automation.[Citation4] However, the signatures of the healthy and bruised regions in the visible range (400–700 nm) are very similar, so fresh bruises are usually difficult to detect when oxidative browning is limited.[Citation5] In recent decades, hyperspectral imaging (HSI) technology, which can simultaneously acquire spatial and spectral information, has been used as a powerful technique for food quality detection.[Citation6] ElMasry et al.[Citation7] investigated a hyperspectral imaging system based on a spectral region between 400 and 1000 nm for early detection of bruises on ‘McIntosh’ apples, which could detect apple bruises on different background colors (green, red, and green reddish). Lee et al.[Citation8] used hyperspectral imaging in the spectral region from 950 nm to 1650 nm for detecting physical damages of pears. The result demonstrated that the hyperspectral imaging technique with the best threshold waveband ratio algorithm could detect pear bruises accurately. Piotr et al.[Citation9] examined the applicability of hyperspectral imaging in the visible and near-infrared (400–1000 nm) and short wavelength infrared (1000–2500 nm) ranges for classification of apple bruising. They found hyperspectral imaging with supervised classification models could distinguish time after bruising respect to five varieties of apples. Martinsen et al.[Citation10] investigated the effect of recent impacts (less than 5 min old) on the light diffusely reflected from the surface of eleven apple cultivars under carefully controlled conditions could nondestructively distinguish between sound and damaged tissue.
Hyperspectral images contain lots of data, which provide sufficient information for apple bruise classification. However, the spectral wavelengths are continuous and have high similarity between the adjacent wavelengths, and due to the data redundancy and high cost, it is not feasible for HSI systems to be applied directly for the on-line detection system. Therefore, it is necessary to select characteristic wavelengths which can represent the whole wavelengths for classification. There are numerous characteristic wavelengths selection algorithms to reduce dimensionality. The successive projections algorithm (SPA) was used to identify the optimal wavelengths from the three patterns of spectra to detect the hollowness in white radishes with a prediction accuracy of 98%.[Citation11] This algorithm was also used to select the characteristic wavelengths in the classification of black beans.[Citation12] The competitive adaptive reweighted sampling (CARS) was applied to obtain optimal wavelengths for detecting blueberry internal bruising from 30 min to 12 h after mechanical impact.[Citation13] The Monte Carlo-uninformative variable elimination (MC-UVE) and successful projections algorithm (SPA) was conducted in the spectral domain for the discriminant wavelength (DW) selection to detect common defects on peaches.[Citation14]
In order to identify apple bruise at different damage times, in this paper, hyperspectral imaging technology was used to detect of apple bruise in five periods after bruising (1st minute, 1st day, 2nd day, 3rd day, and 4th day). Several preprocessing methods were used to process the initial hyperspectral data, and the correlation-based feature selection (CFS) algorithm was used to obtain characteristic wavelengths. AdaBoost algorithm was carried out in the full wavelengths and selected wavelengths. Additionally, an image processing algorithm based on the characteristic wavelengths selected before was proposed for the visual discrimination of bruises against the intact surface and showed the accurate identification results.
Materials and methods
Samples
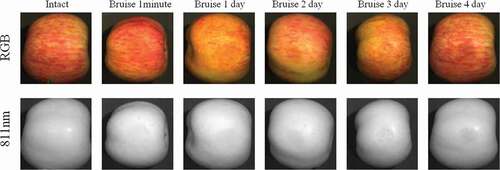
A total of 108 Fuji apples were purchased from a local supermarket in Wuxi China. The samples were randomly divided into two groups, 54 samples of the first group were dropped vertically from a height of 40 cm to the horizontal ground, and the equatorial position of the apple was bruised. The damage caused by this height was internal injury, which was difficult to be detected without breaking the skin (). The second group was the control group. During hyperspectral measurements, the apples were stored in a climate chamber at 5°C. All of the apples were taken out of the climate chamber and stored in the air-conditioned laboratory (22°C) for 2 h to allow the samples to reach room temperature. In order to find out the effects of different bruise time on apple damage classification, the bruised and intact samples were collected in five periods after bruising (1st minute, 1st day, 2nd day, 3rd day, and 4th day).
Figure 1. RGB and grayscale images at 811 nm of intact and bruise apples.
Hyperspectral imaging system
The experimental setup, depicted in , was composed of a hyperspectral imaging system, a stage, and the lighting. All of the hyperspectral images utilized were collected using a Surface Optics’ SOC710-VP Hyperspectral Imager. The hyperspectral imaging system consisted of a spectrograph (1003A-10140 Hyperspectral TM VNIR C-Series, Headwall Photonics Inc., USA) with 1392 × 1040 pixel, spectral resolution of 4.68 nm in 400–1000 nm (128 wavelengths), a CCD camera (Pixelfly QE IC*285 AL, Cooke, USA) and a lens (10004A-21226 Lens, F/1.4 FL23 mm, Standard Barrel, C-Mount., USA). Two fiber optic halogen lamps (150 W EKE, 3250 K, Techniquip, USA) were fixed above the samples from both sides of the dark chamber to reduce the shadowing effects, the exposure time of scanning camera was set to 25 ms. During image acquisition, the scanning speed of the spectrograph was 30 lines per second, and the time for acquiring a hyperspectral image was 46.4 s. All of the measurements were done at 22°C in a dark chamber to prevent the extraneous light.
Figure 2. Hyperspectral reflectance imaging system and hyperspectral image structure schematic diagram.
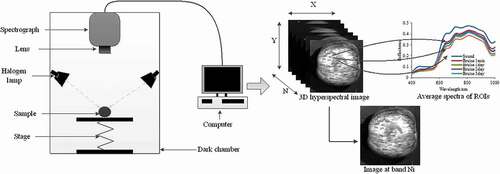
Image calibration
To eliminate the impact of inhomogeneity illumination intensity and the dark current noise, in each experiment, white and dark calibrations were done from the raw hyperspectral images according to the following formula:
where Rr was the raw hyperspectral images, Rw was the intensity of the white reference Spectralon (Specim, Oulu, Finland) with a reflectance of 99%, and Rd was the camera’s dark current which was measured with the camera lens covered.
Data analysis
Data extraction and preprocessing
The region of interest (ROI) function of ENVI 4.7 software (Exelis Visual Informationa Solutions, Boulder, CO, USA) was used to select the bruised and intact ROIs at different time intervals after the beginning of injury on the grayscale images at 811 nm because of the obvious contrast (). The area of each rectangle ROI was around 100 pixels.[Citation14] Because of the large number of pixels in hyperspectral images and each of them has a reflectance, the average spectral reflectance for all wavelengths in each ROI (containing bruised and intact samples) was calculated, respectively.
Preprocessing of spectroscopic reflectance sets is necessary to improve chemometric modeling.[Citation15]The following pretreatment methods were applied after smoothing and denoising of raw hyperspectral reflectivity by Savitzky-Golay smoothing method (the second polynomial order and 15 smoothing points) to obtain spectral characteristics of bruised and intact samples: the second derivative, standard normal variate (SNV), mean-centered (MC), multiplicative scatter correction (MSC).
Savitzky-Golay convolution method can be used to reduce random noise, improve the signal noise ratio (SNR) of data, and select several points to fit or average before and after the smoothed point.[Citation16] The second derivative can reduce the correlation between variables in hyperspectral images greatly.[Citation17] SNV is used to correct spectral errors caused by particle scattering in samples.[Citation18] The purpose of mean-centered is to eliminate the effects of dimensional differences and self-variation. MSC is used to eliminate the effects of scattering on the spectra of samples due to uneven distribution of particles and different particle sizes.
AdaBoost
AdaBoost algorithm[Citation19] trains different weak classifiers against the same training set and then assembles these weak classifiers to construct a stronger classifier. The weight of each sample is determined according to whether the classification of each sample in each training set is correct and the accuracy of the overall classification. The new data with modified weights are sent to the lower classifier for training, and then the classifier obtained from each training process is fused as the final decision classifier.
Correlation-based feature selection (CFS)
It is important to remove data that unrelated to the classification of hyperspectral images. This process is called feature selection, which was accomplished by CFS[Citation20] algorithm in this study. The algorithm is based on the assumption that good feature sets are highly correlated with the class but not related to each other. It uses the optimal priority search method to evaluate the value of the attribute subset by considering the individual predictive ability of each attribute and the redundancy between them and then selects the optimal wavelengths.
Independent component analysis (ICA)
ICA is a statistical method developed in recent years,and is an important branch of Blind Source Separation (BSS). ICA can separate unobserved, independent source signals from observed signals that are the combinations (or matrices) of the source signals.[Citation21] In the case where statistically independent additive subcomponents occur, ICA offers enhanced data analysis.[Citation22] Because of the advantage of ICA in feature extraction, it has been gradually applied to hyperspectral image processing.
In the experiments of this study, data extraction and ICA transformation were based on ENVI4.7 (Exelis Visual Informationa Solutions, Boulder, CO, USA); Data preprocessing and image processing algorithm were implemented with Matlab R2009a (The Math Works, Natick, USA, Adaboost algorithm, and CFS were implemented with Weka3.8(Waikato Environment for Knowledge Analysis).
Results and discussion
Feature extraction of the hyperspectral image of apple bruises
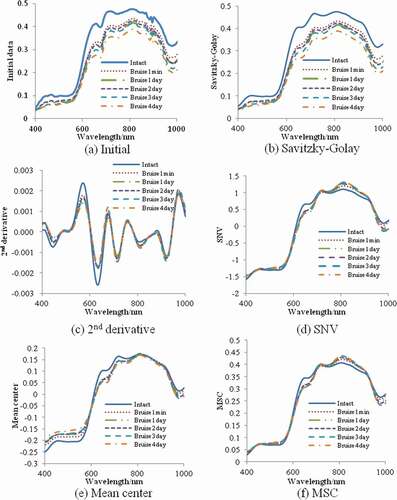
) shows the variation in the average spectral reflectance of apples at different time intervals after injury. At the beginning, the spectral reflectance of the damage sample was similar to that of the intact sample. The average spectral reflectance of damage samples began to decrease when the bruise time increased, especially in 640–700 nm and 730–900 nm. The absorption valley at 680 nm is caused by the absorption of chlorophyll in the apple surface[Citation23]. The absorption peak at 820 nm reflects the sugar content of apple samples[Citation24]. The valley near 960 nm is caused by the change of water content in apple because of the characteristic absorption peak of the second harmonic of the O-H group in water.[Citation25]
Figure 3. The initial and pretreated spectra reflectance of intact and bruise apple at different time intervals after injury.
Spectral data preprocessing
The initial data contains the information of the surface condition of the sample, but also contains interference factors such as electric noise and background scattered light. Apart from Savitzky-Golay smoothing method used in raw data shows in ), particular pretreatment transformations of the spectral characteristics are presented, including the second derivative, SNV, MC, and MSC in ).
It can be seen that after the second derivative treatment, the spectral characteristics of intact samples and damage samples are similar in 780–1000 nm. However, in the visible range of 400–780 nm, the intact samples are different from the damage samples. The difference between intact samples and damage samples is quite large in 640–700 nm and 780–900 nm after the pretreatment of SNV, and the similar conclusion was also found in MSC.
Analysis of AdaBoost-based on full wavelengths
The 108 samples were randomly divided into training set and test set according to the ratio of 2: 1. The AdaBoost algorithm was used to analyze the initial data and the preprocessed data. The results are shown in . Based on the initial data, the classification accuracy was nearly 90% for the initial data. After Savitsky-Golay convolution smoothing, the classification accuracy was slightly improved, because the noise in raw data has been removed after smoothing. The accuracy of SNV method was even lower than initial data, and only 77.78% samples were successfully classified in the first minute after bruise. After the second derivative treatment, the classification accuracy in the first day after bruise increased, but there was no significant improvement for the samples in 3 and 4 days after bruise. This may result from the difference between the damaged area and the intact area increased, but the difference between the second derivative processing and the initial data was reduced. The pretreatment of MSC obtained the best correct discrimination rate of 98.61%. And the accuracy in the first minute after bruise was increased by 15.27%, which could effectively improve the classification accuracy in the early stage of injury. The test results shown in are similar to the training set.
Table 1. Classification results based on full wavelengths and AdaBoost.
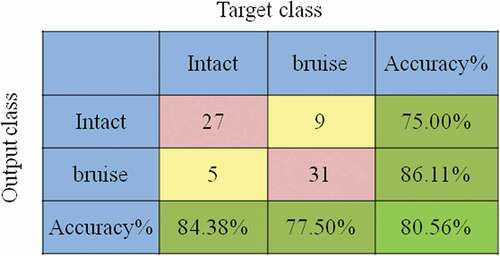
In order to illustrate the proportion of the misclassification samples, the confusion matrices were created. An example of the confusion matrix for the training set of the initial data is presented in . In this matrix, the columns represent the actual outputs, while the rows represent the predictions (target class). The last row of the matrix represents the accuracy of actual recognition for the samples. The recognition accuracy of intact samples and bruise samples is 75% and 86.11%. The last column of the matrix represents the ratio of the number of properly classified samples to the number of all classified samples. The accuracy of being recognized as intact samples and bruise samples is 84.38% and 77.5%, respectively. Therefore, the final recognition accuracy is 80.56%.
Figure 4. The confusion matrix for the training results of the initial data.
Characteristic wavelength selection and modeling analysis based on CFS
CFS algorithm was used to extract the characteristic wavelengths from 128 wavelengths of initial data and preprocessed data, respectively. The results are shown in . Among that, the second derivative selected the most wavelengths (10), and the initial data and the data preprocessed by mean center selected the least wavelengths (4). Thus, the CFS algorithm can obviously reduce the data redundancy.
Table 2. The results of CFS procedure performed on Initial data and preprocessed data.
shows the results of the training set and the test set based on the characteristic wavelengths selected by the CFS algorithm. The classification accuracy of both training set and test set was similar to that of the full wavelengths. The mean accuracy of modeling in selected wavelengths was 97.63%, which indicated characteristic wavelengths selected by the CFS algorithm could represent the whole wavelengths and detect apple bruises effectively.
Table 3. Classification results based on selected wavelengths and AdaBoost.
Analysis of apple bruise based on image processing
The above studies showed the characteristic wavelengths extracted by CFS algorithm were suitable for apple bruising discrimination. The classifier based in characteristic wavelengths could detect whether the apple was damaged or not, but due to the surface of the intact and bruised regions in the apple was very similar, the location of bruise tissues was usually difficult to detect, so the image processing algorithm was proposed to locate the damaged area.
First of all, the ICA algorithm was used to transform the full wavelengths hyperspectral image, and then to transform the characteristic wavelengths. and ) shows the transformation of apple hyperspectral images based on full wavelengths and characteristic wavelengths in the first day after bruise. Comparing the first four component images, ICA1 contained the whole apple information, but due to the reduction of redundant wavelengths, the background color in ) was dark, and sample became brighter than in ). ICA2 and ICA4 mainly reflected some of the apple’s own morphological information, such as textures, speckles, and surface profile information of apple. ICA3 showed the bruise area of apple both in ) and ). Similar to ICA1 image, because of the reduction of wavelengths, the sample and background color turned dark and the bruise area turned bright, which could identify the bruise area obviously. So ICA3 image was used to detect apple bruise. The variation results of all samples were similar to those of . shows the flowchart of apple bruise region detection algorithm. First, MSC and CFS algorithms were used to select the characteristic wavelengths.
Figure 5. ICA transform results of the bruise apples’ hyperspectral images based on the full and characteristic wavelengths. (a) The first four component images of ICA transform based on full wavelengths.(b) The first four component images of ICA transform based on characteristic wavelengths
Figure 6. Flow chart of apple bruise region detection algorithm.
Observed the average reflectance at 822 nm is the highest in ), so this wavelength was chosen to generate the mask to reduce the background interference. After that, the ICA algorithm was applied. Then, the adaptive threshold segmentation algorithm[Citation26] was applied to ICA3, and the bruise region was obtained. All 324 apple hyperspectral image samples were detected by the process, and the results are shown in . The final detection accuracy of apple bruise detection algorithm based on image processing technology was 94.75%.
Table 4. Detection results of apple slight bruise by image recognition.
Conclusion
In this study, the hyperspectral technique was used to detect the apple bruise of Fuji apple, and the initial hyperspectral data were preprocessed by various pretreatment methods. After Savitzky–Golay and MSC processing, the accuracy of AdaBoost classification model was 98.61%, and the accuracy of the initial injury was effectively increased by 15.27%. CFS algorithm was used to select the characteristic wavelengths through initial data and data after preprocessing, and the average accuracy was 97.63%, which indicated that CFS combined with AdaBoost could reduce data redundancy and detect apple bruise effectively. Then, an image processing algorithm was used to locate the damaged area, the final detection accuracy was 94.75%, which is helpful for the development of detection instruments and systems. In the online detection of apple, fungal infection is also an important part. So we will study how to increase the damage category of apples that can be detected in the future.
Additional information
Funding
Related Research Data
References
- Lu, Y.; Lu, R. Non-Destructive Defect Detection of Apples by Spectroscopic and Imaging Technologies: A Review. Transactions of the ASABE 2017, 60, 5.
- Soliva-Fortuny, R. C.; Grigelmo-Miguel, N.; Odriozola-Serrano, I.; Gorinstein, S.; Martín-Belloso, O. Browning Evaluation of Ready-To-Eat Apples as Affected by Modified Atmosphere Packaging. Journal of Agricultural & Food Chemistry 2001, 49, 8, 3685.
- Lu, R.; Detection of Bruises on Apples Using Near-Infrared Hyperspectral Imaging. Trans ASAE 2003, 46, 2, 523–530.
- Cubero, S.; Blasco, J. Advances in Machine Vision Applications for Automatic Inspection and Quality Evaluation of Fruits and Vegetables. Food & Bioprocess Technology 2011, 4, 4, 487–504.
- Kavdir, I.; Guyer, D. E. Apple Sorting Using Artificial Neural Networks and Spectral Imaging. Transactions of the ASAE 2002, 45, 6, 1995–2005.
- Park, B.; Lu, R. Hyperspectral Imaging Technology in Food and Agriculture; Food Engineering, Troy, Michigan, USA, 2015.
- Elmasry, G.; Wang, N.; Vigneault, C.; Qiao, J.; Elsayed, A. Early Detection of Apple Bruises on Different Background Colors Using Hyperspectral Imaging. LWT - Food Science and Technology 2008, 41, 2, 337–345.
- Lee, W.-H.; Kim, M.-S.; Lee, H.; Delwiche, S.-R.; Bae, H.; Kim, D.-Y.; Cho, B.-K. Hyperspectral Near-Infrared Imaging for the Detection of Physical Damages of Pear. Journal of Food Engineering 2014, 130, 130, 1–7.
- Baranowski, P.; Mazurek, W.; Pastuszka-Woźniak, J. Supervised Classification of Bruised Apples with respect to the Time after Bruising on the Basis of Hyperspectral Imaging Data. Postharvest Biology & Technology 2013, 86, 2013, 249–258.
- Martinsen, P.; Oliver, R.; Seelye, R.; Mcglone, V. A.; Holmes, T.; Davy, M. Quantifying the Diffuse Reflectance Change Caused by Fresh Bruises on Apples. Transactions of the ASABE 2014, 57, 2, 565–572.
- Pan, L.; Sun, Y.; Xiao, H.; Gu, X.; Hu, P.; Wei, Y. Hyperspectral Imaging with Different Illumination Patterns for the Hollowness Classification of White Radish. Postharvest Biology & Technology 2017, 126, 40–49.
- Sun, J.; Jiang, S.; Mao, H.; Wu, X.; Li, Q. Classification of Black Beans Using Visible and near Infrared Hyperspectral Imaging. International Journal of Food Properties 2016, 19, 8, 1687–1695.
- Fan, S.; Li, C.; Huang, W.; Chen, L. Detection of Blueberry Internal Bruising over Time Using NIR Hyperspectral Reflectance Imaging with Optimum Wavelengths. Postharvest Biology & Technology 2017, 134, 55–66.
- Zhang, B.-H.; Li, J.-B.; Fan, S.-X.; Huang, W.-Q.; Zhao, C.-J.; Liu, C.-L.; Huang, D.-F. Hyperspectral Imaging Combined with Multivariate Analysis and Band Math for Detection of Common Defects on Peaches (Prunus Persica). Computers & Electronics in Agriculture 2015, 114, C, 14–24.
- Rohart, A.; Bouveresse, J. R.; Rutledge, D. N.; Michon, C. Spectrophotometric Analysis of Polysaccharide/Milk Protein Interactions with Methylene Blue Using Independent Components Analysis. Food Hydrocolloids 2015, 43, 3, 769–776.
- Sarraguça, M. C.; Cruz, A. V.; Soares, S. O.; Amaral, H. R.; Costa, P. C.; Lopes, J. A. Determination of Flow Properties of Pharmaceutical Powders by near Infrared Spectroscopy. Journal of Pharmaceutical & Biomedical Analysis 2010, 52, 4, 484–492.
- Marquetti, I.; Link, J. V.; Bona, E. Partial Least Square with Discriminant Analysis and near Infrared Spectroscopy for Evaluation of Geographic and Genotypic Origin of Arabica Coffee. Computers & Electronics in Agriculture 2016, 121, C, 313–319.
- Ely, D. R.; Thommes, M.; Carvajal, M. T. Analysis of the Effects of Particle Size and Densification on NIR Spectra. Colloids & Surfaces A Physicochemical & Engineering Aspects 2008, 331, 1–2, 63–67.
- Yoav., F.; Schapire, R. E.; Decision-Theoretic, A. Generalization of On-Line Learning and an Application to Boosting. European Conference on Computational Learning Theory Springer, Berlin, Heidelberg, 1995.
- Hall, M.; Correlation-based Feature Selection for Machine Learning. PhD Thesis, Waikato University, 1998.
- Caiafa, C. F.; Salerno, E.; Proto, A. N.; Fiumi, L. Blind Spectral Unmixing by Local Maximization of Non-Gaussianity. Signal Processing 2008, 88, 1, 50–68.
- Zou, X.; Zhao, J.; Holmes, M.; Mao, H.; Shi, J.; Yin, X. Independent Component Analysis in Information Extraction from Visible/Near-Infrared Hyperspectral Imaging Data of Cucumber Leaves. Chemometrics & Intelligent Laboratory Systems 2010, 104, 2, 265–270.
- Huang, M.; Wan, X.; Zhang, M.; Zhu, Q. Detection of Insect-Damaged Vegetable Soybeans Using Hyperspectral Transmittance Image. Journal of Food Engineering 2013, 116, 1, 45–49.
- Zheng, Y.; Lai, X.; Bruun, S.; Ipsen, H.; Larsen, J.; Lowenstein, H.; Sondergaard, L.; Jacobsen, S. Determination of Moisture Content of Lyophilized Allergen Vaccines by NIR Spectroscopy. Journal of Pharmaceutical and Biomedical Analysis 2008, 46, 3, 592–596.
- Schwanninger, M.; Rodrigues, J. C.; Fackler, K. A Review of Band Assignments in near Infrared Spectra of Wood and Wood Components. Journal of near Infrared Spectroscopy 2011, 19, 5, 287–308.
- Ahmadi, K.; Javaid, A. Y.; Salari, E. An Efficient Compression Scheme Based on Adaptive Thresholding in Wavelet Domain Using Particle Swarm Optimization. Signal Processing Image Communication 2015, 32, 1, 33–39.