
 ?Mathematical formulae have been encoded as MathML and are displayed in this HTML version using MathJax in order to improve their display. Uncheck the box to turn MathJax off. This feature requires Javascript. Click on a formula to zoom.
ABSTRACT
In the present study, peel pectin jellies (PPJ) were isolated from banana peel Musa acuminata Colla (AAA, cv ‘Berangan’) varieties using water bath extraction; five jellies were produced, namely, PPJ_68%, PPJ_70%, PPJ_71%, PPJ_72%, and PPJ_76%. The effect of sugar content on the rheology of the PPJ and commercial fruit jelly was conducted at 25°C within 0.05–100 s−1 shear rate. Flow behaviour was evaluated on the test dispersions while frequency sweeps (Ea) to obtain the viscoelastic (G’ and G”) were performed on the jellies. PPJ dispersion showed shear thinning flow behaviour, a good fit to the Casson model. Sugar concentration does not affect Casson parameters (Kc, Koc, ɳca, and σoc). Frequency sweep decreased as viscosity increased which revealed high dependence for both G’ and G”. Tan δ for PPJ was more than unity which showed that jelly has less elastic properties. PPJ with the lowest sugar concentration, PPJ_68%, conducted at a high shear rate showed it was compatible with validation of the Cox–Merz rule.
Introduction
Pectin substance is commonly found in the primary cell wall of plants and it is classified as an anionic structural heteropolysaccharide with a range of molecular weight from 50,000 to 150,000 Da.[Citation1] Commercially, pectin obtained from agriculture wastes such as citrus peel and apple pomace contain pectin of about 20–30% and 10–15%, respectively. Pectin has been widely used as thickening, gelling, and stabilizing agents.[Citation2] Numerous studies have discovered pectin and nutritional values of agricultural wastes such as reported by Ghafar et al.[Citation3] in Moringa oleifera seed, Vriesmann et al.[Citation4] in cacao pod husk, Morales-Contreras et al.[Citation5] in tomato husks, and Serna-Cock et al.[Citation6] derived pectin oligosaccharides from mango peels. Similarly, pectin is also rich in banana peels which contain approximately 9–22% and has possibilities for jelly making.[Citation7,Citation8] The most essential function of pectin is its capability to form gels.[Citation9] Commonly, the pectin gel systems could be formed under specific conditions where the gelling mechanism is highly related to the degree of methylation (DM). High methoxyl pectin (HMP) has DM > 50% whereas low methoxyl pectin (LMP) has DM < 50% as described by several authors.[Citation10–Citation13] In addition, the HMP and LMP presented different rheological behaviours in aqueous and gelled form, thus they had different applications.[Citation14]
From this perspective, the formation of gel in pectin systems is a vigorous process, specifically in rheological changes during development of gel structure which may provide additional information on the role of different variables in gel formation.[Citation15,Citation16] Likewise in most product application, the viscoelastic properties of pectins are always been considered to ensure wide-ranging usage as a gelling or stabilizer agents.[Citation12] Several non-Newtonian food that have both viscous and elastic properties showed viscoelastic behaviour. For instances, fluid and semisolid foods exhibit viscoelastic properties with a wide variety of rheological behaviour ranging from Newtonian to time-dependent. Meanwhile, fluid food containing relatively large amounts of dissolved low molecular weight compound such as sugar and no significant amount of polymer or insoluble solids could be anticipated to exhibit Newtonian behaviour.[Citation17] The rheological behaviour in food production was determined by several parameters, such as composition of fruit, process technology, shear rate, and temperature.[Citation18] Viscosity, solubility, and gelation are typically related. For instance, increase gel strength will increase the tendency to gel, decrease solubility, and increase viscosity.[Citation9] Apart from that, rheological properties are important in evaluating the field of deformation and flow of matter.[Citation19] It is also could be used in technology operation processing such as handling, storage, and sensory assessment.[Citation20,Citation21]
Consequently, the purpose of this study is to investigate the effect of different sugar concentration of peel pectin jelly (PPJ) on their flow and viscoelastic properties. In addition, the flow properties have been modelled according to Power law and Casson model towards achieving a good viscosity prediction. The viscosity properties have been evaluated by using empirical correlation under Cox–Merz rules. Up to date, there is no reported information on rheological properties of PPJ from banana peels.
Theoretical background
Rheological properties of most fluids such as fruit juices are dependent on their molecules with different particles size and shapes which gave non-uniform size. The properties have been modified to accomplish stability due to non-flexibility of shear rate.[Citation22] High shear rates denoted by intense flow conditions are likely to be induced by the dispersed particles which resulted in structural breakdown. Yet, other authors[Citation18,Citation22] reported the food products such as purees, jam, marmalade, and jellies made from fruit juices mostly exhibit Newtonian fluids behaviour and the pectin jelly behaves as a non-Newtonian part.
Evaluation and characterization of the rheology behaviour of jelly product involved Newtonian model shown in Equation 1 and non-Newtonian models in Equations 2–4 are basic rheology characterization in food system:[Citation20]
The Newtonian model consists of µ and Ý which are Newtonian viscosity, shear stress, and the shear rate, respectively. The Newtonian behaviour contributes to linear correlation between shear stress (σ) and shear rate (Ý) and viscosity value with experimental conditions and they can be estimated from the Newtonian model.[Citation22]
Power law model as shown in Equation 2 has been widely used in food processing inspection during handling, heating, or cooling of food. Besides that, the Power law offering a great description of fluid flow behaviour across the range of shear rates to which the coefficients were fitted. Nonetheless, it also reveals poor fitting for data obtained at a wide range of shear rates. The model is shown in Equation 2:[Citation20]
where σ (Pa) is shear stress, K is consistency index, Ý (s−1) is the shear rate, and n which is flow behaviour is dimensionless. Most fruit jelly exposed structure breakdown that due to hydrodynamic forces throughout shearing which imply shear thinning or pseudoplastic behaviour (0 < n < 1).[Citation20]
The Casson model in Equation 3 had been extensively used in wide ranges of food products such as molten chocolate, fruit purees, gums, and tomato products.[Citation20,Citation22,Citation23] A straight line is produced when square root of shear rate (Ý0.5) is plotted against the square root of shear stress (σ0.5) with slope Kc and intercept Koc. This model is shown as Equation 3.[Citation24]
The Casson yield stress (σoc) is calculated as the square of intercept σoc = (Koc)2 and plastic viscosity ɳca = (Kc)2.
A few linear viscoelastic material functions measured from oscillatory testing are related to the steady shear behaviour described by May[Citation16] that provide more reliable relationships,especially at low frequencies and shear rate. Yet, numerous empirical equations have recommended the relation of viscometric functions to the linear viscoelastic region (LVR). Cox and Merz[Citation25] found that the dynamic complex viscosity (ɳ*) and steady shear viscosity (ɳ) of polymeric materials is nearly equal when the angular frequency (ω) and shear rate (Ý) are equal as shown in Equation 4. By following the Cox–Merz rules, it is possible to predict the steady shear properties of a material from the dynamic rheological properties obtained without extensive alteration of structures.[Citation13]
In order to explore the applicability of the Cox–Merz rule, ɳa, and ɳ* of PPJ are plotted versus Ý and ω, respectively.
Materials and methods
Materials
Banana sources, Musa acuminata Colla (AAA, cv ‘Berangan’) variety at the green–yellow stage were harvested within 11–13 weeks after flowering periods at alocal orchard at Banting, Selangor, Malaysia. Ripening stage bananas were collected based on visual observation, and its maturity was referred to colour indices as provided by the Ministry of Agriculture and Agro-Based Industry Malaysia. Then, the samples were analysed at Shizen Conversion and Separation Lab, Department of Chemical Process Engineering, Malaysia. Commercial fruit jelly (with 85% sugar concentration, carrageenan) was bought from the market at Wangsa Maju, Kuala Lumpur, Malaysia with a specific ingredient from the manufacturer.
Peel pectin jelly preparation
Banana peels were separated off from its pulp, freeze-dried at −55°C, and grounded in 300-μm mesh size. The powder form was soaked by water extraction process. The high methoxyl of PPJ was produced according to the method described by Mohd Rasidek et al.[Citation26] that was based on an optimized ingredient using response optimizer. The optimized parameters were the amount of sucrose sugar and citric acid. Initially, the pectin extracts were boiled for 5 min at an elevated temperature of 60°C, and sugar was added immediately and the process took 15 min. Citric acid was added to reach a desirable pH of about 3 using pH meter (HANNA 2211). Then, the solution was heated for 20 min before the heating process in water bath for 30 min until it reached the gelling desirable consistency. All the jelly samples were prepared with sugar concentration of 68–76%. The total soluble solid was measured using handheld refractometer (Atago, Japan), before the mixtures gelled in room temperature for 48 h.
Rheological measurement
All PPJ and commercial jelly in dispersion solution form (1% w/w) were prepared by freeze drying the jelly sample and dissolved in distilled water. The aqueous solution was allowed to rest for 4 h prior to the rheological experiments. The measurements for rheological properties in the steady and dynamic shear are performed by using a rheometer (Malvern Instrument Ltd, U.K). Mechanical spectra of shear stress and shear rate rotation ramp tests were done by using a 20-mm stainless steel parallel plate, with 1-mm gap width. The sample slot was operated at a temperature of 25°C using a water bath of rheometer controller system. Flow curves of ascending and descending for shear stress versus shear rate were carried out in the range of 0.05–100 s−1. The samples are also observed in steady and dynamic shear by using the same plate, with 0.5-mm gap width. Oscillation tests were done within the LVR to determine storage (G’) and loss modulus (G”). Frequency sweeps were conducted in the frequency range of 0.1–10 Hz for 8 min. All of the experiments were repeated at least twice. The reported results are the average of these multiple trials which exhibited good reproducibility.
Statistical analysis
All of the experiments were repeated at least twice. Reported results are average of multiple trials to exhibit good reproducibility. Statistical analysis and prediction of flow properties were performed by using Microsoft Excel 2016 (Microsoft Corporation, USA). Curve fitting was performed using solver function in Microsoft Excel adopting generalized reduced gradient non-linear optimization code. The best-fitted line with minimum sum of square errors (SSE) was considered as individual criteria during fitting process of curves. In addition, goodness of fit for regression coefficient (R2) was calculated as in Equation 5:[Citation27]
where SST is defined as total corrected sum of squares. In determining the effects of extraction condition on rheological parameters, several models were involved and linearized by taking logarithmic terms to obtain constants and coefficients from the equation.
Results and discussion
Predictive models on flow behaviour
Common behaviour found in most varieties of food products are to be pseudoplastic or shear thinning, by having low apparent viscosity (ɳa) with high shear rate that is frequently referred as shear thinning.[Citation20] This is an essential parameter to recognize when designing equipment for handling food.[Citation23] PPJ which contained mixture of pectin extracts and sugar undergone shear thinning, a situation that possibly considered as a sign of structural units breakdown in a food owing to hydrodynamic forces generated during shear. This finding is in agreement with previous researches[Citation20,Citation22,Citation28] that found that most of the fruit juice behave the same as PPJ. Moreover, the sugar content plays an influential role in the viscosity where high sugar content results in high viscosity as other particles such as fibre and pectin.[Citation29]
Hence, the Power law and Casson model were used to predict the flow behaviour of PPJ and commercial jelly at sugar concentration of 68–76% and 85%, respectively under the shear stress (σ) as a function of shear rate (Ý) at 25°C. According to Xiu et al.[Citation30], different concentrations gave different viscosities because the properties depend on inter-molecular forces between molecules and water solute interactions. The interaction was due to the strength of hydrogen bonds and inter-molecular spacing. From , it has been observed that the curve fitted to the Power law which gave an approximation of viscosity parameters (K) and flow index (n). These values indicate the degree of shear thinning where small n denoted high shear thinning behaviour of the product. Practically, the n is found to not change with the temperature.[Citation20,Citation22,Citation28] The values of n, K, and R2 are listed in . PPJ fit reasonably well with the Power law with R2 of 0.992–0.995 and commercial jelly gave a lower R2 of 0.957. (a), (b) shows both coefficients, n and K increased with the PPJ sugar concentration. Small n value gave large shear thinning viscosity effect and high K value gave large representative viscosity. Increasing PPJ sugar concentration decreased n value and increased the K value which are in agreement with other polysaccharides such as described by Xiu et al.[Citation31] in salecan gums and Koocheki et al.[Citation32] in gelatinous Alyssum Homolocarpum seed. The presented n value of PPJ was quite higher than commercial jelly which was 0.75–0.83, and it has been clarified by Jiang et al.[Citation33] in which polysaccharides solution had contributed to the high value of n and tended to feel slimy in the mouth. Even so, the n value of PPJ is less than unity indicating its pseudoplastic or shear thinning nature. The result was contrary to commercial jelly that has n value of 0.342 which presented strong shear thinning behaviour. Additionally, Syahariza and Yong[Citation34] also described that for a good mouth feel, polysaccharide characterized by a low n value is more required as found in selected commercial jelly.
Table 1. Parameters of power law consisted of the flow index (n), consistency index (K), and coefficient determination (R2) for banana peel pectin jellies and commercial fruit jelly.
Figure 1. Fitted flow curves of power law at different concentrations of banana peel pectin jellies and commercial fruit jelly at 25ºC.
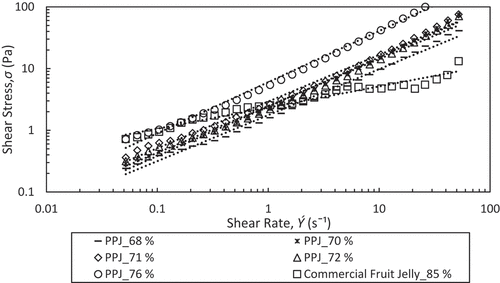
Figure 2. Power law fitted model at different concentrations of banana peel pectin jellies associated with (a) low indices (n) and (b) onsistency indices (K).
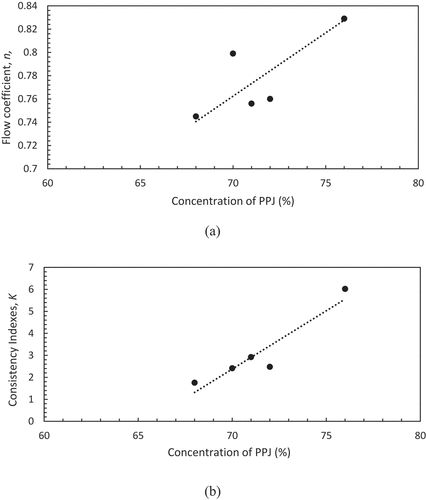
Gomez-Diaz et al.[Citation35] described that the K value is a strong function of the concentration of the polysaccharides solution. K value of PPJ at different sugar concentrations were from 1.76 to 6.02 and for commercial jelly was 2.34. Shear thinning viscosity effect for PPJ as it decreased with increased sugar concentration. From this study, Power law successfully predicts PPJ viscosity properties with R2 of more than 0.99. Meanwhile, R2 of commercial jelly is less than 0.96 which gave less viscosity prediction. Thus, according to the Power law model, the K value and viscosity of PPJ are proportionally related to each other. Dautant et al.[Citation36] also reported that further increase of K values relates to the increase of water binding capacity, thus causing the gel to become more brittle.
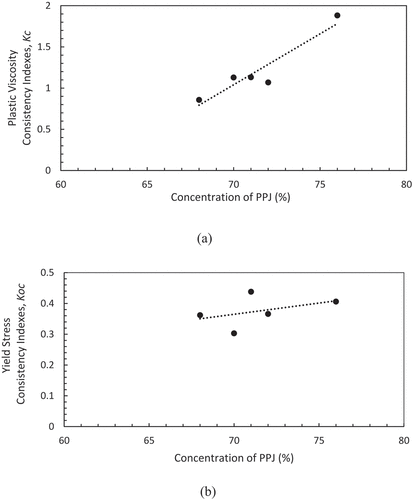
In the Casson model, the effect of particle size distribution is strongly related, which is caused by small clumps forming chain-like groups of suspension and controlling the flow behaviour.[Citation23] During shearing, the small clump structure easily breaks down and equilibrium is established at each shear rate of the attractive and disruptive forces. Originally, the Casson model was derived by Casson for prediction of flow behaviour which related to the effect of particle size distribution in pigment oil suspensions.[Citation22,Citation23,Citation37] The predicted Casson model shown in has higher R2 values of 0.999–1.000 for PPJ compared with commercial jelly which has lower R2 of0.863. The values of Kc, Koc, σoc, ɳca, and R2 are listed in , where the Kc values of PPJ were 0.86–1.88, but the value for commercial jelly was small at 0.29. Meanwhile, the Koc values of PPJ were 0.36 to 0.44 and they were lower than commercial jelly which was 1.15. (a), (b) shows both coefficients, Kc and Kocand they increased with concentration.The value of Koc was small and almost constant with respect to concentration. The Casson yield stress (σoc) were in the range of 0.131–0.165 for PPJ, and commercial jelly showed the highest value of 1.332. By considering the presence of small yield stress, the viscosity prediction could be more accurately predicted by using these models. According to Keshani et al.[Citation22], yield stress was caused by particle–particle interactions and crowding. It is postulated that PPJ has the same mechanism as sugar content plays a major role which contributed to the result of the viscosity. As a conclusion, high sugar content gave high viscosity. However, the Casson plastic viscosity ɳca was in the range of 0.734–3.542 Pa.s for PPJ, while commercial jelly showed a lower value of 0.089 Pa.s. The R2 of commercial jelly was also lower for Casson model compared to Power law, yet it has high Koc value which indicated large yield stress that influenced elasticity properties.
Table 2. Parameters of Casson model, consisted of the consistency indices (Kc,Koc), plastic viscosity (ɳca), Casson yield stress (σoc), and coefficient determination (R2) for banana peel pectin jellies and commercial fruit jelly.
Figure 3. Fitted flow curves of Casson model at different concentrations of peel pectin jellies and commercial fruit jelly at 25ºC.
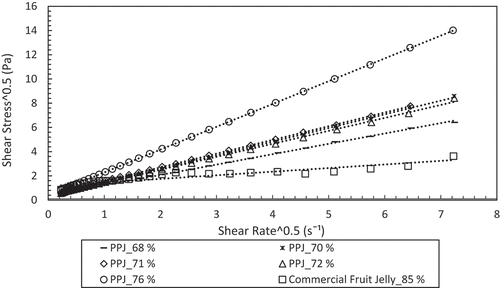
Figure 4. Casson model fitted for banana peel pectin jellies at different concentrations associated with (a) plastic viscosity consistency indices (Kc) and (b) yield stress consistency indices (Koc).
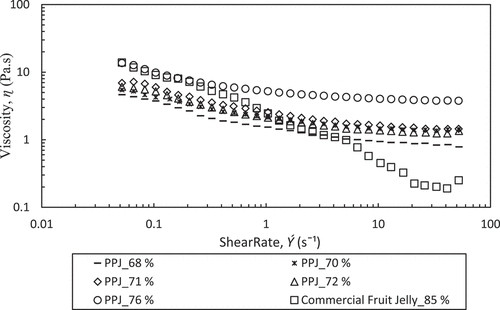
From another perspective of solid materials, the apparent viscosity of the carrier fluid must be adequately high to support material structure. If the shear rates forced on that fluid are excessive, its suspending properties will decrease and the food particles may settle in the processing equipment.[Citation38] It is further proven with the data of apparent viscosity as shown in that the commercial jelly has strong shear thinning viscosity and finally attained equilibrium viscosity. The variation of apparent viscosity at different sugar concentrations of PPJ has shown that the apparent viscosities significantly increased from 4.65 Pa.s to 13.64 Pa.s and the highest sugar concentration of commercial jelly has the highest apparent viscosity of 13.8 Pa.s. Decreasing of viscosity along with increased of shear rate, it would change the PPJ into specific phases. At this phases, the pectin molecules assumed to homogeneously disperse in dilute solution with molecules being interact each other and contributed to low viscosity values. Continued viscosity decrease indicates that the intermolecular distance has been expanded due to the increase of shear rate. Meanwhile, at low shear rates, the PPJ viscosity is much smaller than commercial jelly and the trends become reversed as shear rate increased. For that reason, the viscosity of PPJ is diverse, at low shear rate contributed to less viscous and at high shear rate contributed to high viscous.
Figure 5. Changes in apparent viscosity as shear rate increases for banana peel pectin jellies at different concentrations and commercial fruit jelly.
Viscoelastic properties
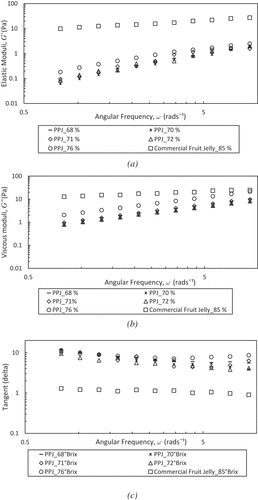
Classification of pectin gels can be categorized into two, namely, true and weak gels. True gels are free-standing as a consequence of the development of a three-dimensional network. Meanwhile, weak gels are characterized by a fragile gel-like network which is easily broken when introduced to high enough stress.[Citation39] The properties can be easily differentiated by using mechanical spectra where frequency sweep was applied and their viscoelastic properties measured.
Frequency sweep studies have been illustrated in )–6(c) showing the changes in elastic moduli (G’), viscous moduli (G”), and tangent delta (tanδ) as a function of the angular frequency (ω) at 25ºC. The PPJ have shown an increase in magnitudes of G’ and G” along with an increase of ω. The PPJ was in the form of weak gels or viscoelastic fluid, which have a higher dependence on ω for G” compared with G’ and less dependency on tanδ that is larger than unity. Meanwhile, the G’, G”, and tanδ of commercial jelly were almost constant against ω that behave as hard gel or solid. However, the viscosity dependency can be solved by diluting the jelly solution so that the values approached each other at high ω as found by Ross-Murphy.[Citation40] Positive slopes have been obtained for PPJ, while a commercial jelly shows a true gel characteristic with almost zero slopes. Strong dependence of G’ and G” on ω gave the positive slopes because all pectin sugar mixtures exhibited behaviour common to weak gels. Thus, the formation of the elastic jelly network in PPJ can be explained by the modification of water structure by sugar with dependency on the type of sugar. Also, PPJ has a low G' value was derived from determination the texture and quality of itself as a natural pectin weak behavior. In addition, the pectin gel is a biopolymer with disordered networks and generally is a weak gel. Supported by Vries et al.[Citation41] when weak gels are exposed to a large stress, the gel network is easily broken, thus accounting for a low G’ value.
Figure 6. The angular frequency, ω, for banana peel pectin jellies at different concentrations and commercial fruit jelly within three different functions (a) elastic moduli (G’), (b) viscous moduli (G”), and (c) tangent delta (tanδ) at 25°C.
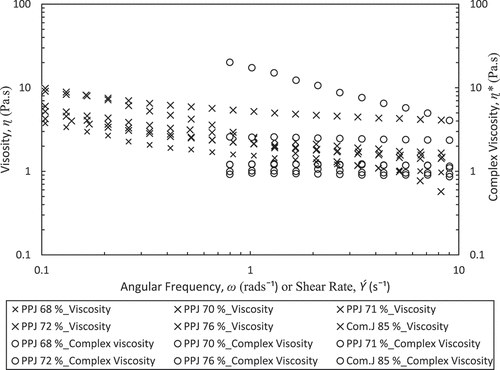
shows the plot of apparent viscosity (ɳa) and ɳ* versus shear rate (Ý) and ω, respectively. The polysaccharides dispersion followed Cox–Merz generalization as apparent viscosity (ɳa) and complex viscosity (ɳ*) are overlapping the applied shear rate and frequency ranges. Nascimento et al.[Citation42] also stated for most of fluid with homogeneous structure like polysaccharides dispersion is typically correlated with Cox-Merz rule . Hence, the applicability of the Cox–Merz rule (Equation 4) was examined. Observation for PPJ and commercial jelly had given the magnitudes of ɳ* being lower than ɳa. The PPJs with sugar concentration from 68 to 76 has not correlated with the Cox–Merz rule, which indicates that the ƞ* is higher than those of ɳa . The same trend, for commercial jelly with 85% of sugar concentration, over the tested range of shear rates and frequencies, was also observed. Conversely, only the PPJ at low sugar concentration, 68%, and high shear rate followed the Cox–Merz rule which similar to dilute polymer. However, according to Rao and Silva,[Citation14] the departure of the Cox–Merz rule is observed in two situations whereby if ɳ*> ɳa occurs with HMP dispersions in the presence of sugars and also with some other molecules associated to it from delicate weak gelled network, then the other condition of ɳ*< ɳa could be attributed to the aggregation phenomena of pectin in the solution.
Figure 7. Applicability of Cox–Merz rules for different concentrations of banana peel pectin jellies and commercial fruit jelly at 25°C.
Conclusion
Casson model has demonstrated a good agreement of shear thinning properties for PPJ with 68–76% of sugar concentration, but showed less compliance in the Power law. Conversely, the commercial fruit jelly with the highest sugar concentration of 85% contributed to a weak prediction for both models. Viscoelastic properties of PPJ showed a tendency to form a semisolid weak gel from pectin compounds, compared to the commercial fruit jelly which possessed more elastic gel properties. In addition, the variability of rheological properties for PPJ can be manipulated by its ingredients.
Nomenclature
Abbreviations
| LVR | = | linear viscoelastic region |
| TSS | = | total soluble solid |
| DM | = | degree of methylation |
| HMP | = | high methoxyl pectin |
| LMP | = | low methoxyl pectin |
| PPJ | = | peel pectin jelly |
Roman letters
| K, Kc, Koc | = | consistency index |
| n | = | flow index |
| R2 | = | regression coefficient |
| G’ | = | elastic moduli |
| G” | = | viscous moduli |
| tanδ | = | tangent delta |
Greek letters
| ɳ | = | viscosity |
| µ | = | newtonian viscosity |
| ɳ* | = | complex viscosity |
| ɳca | = | casson plastic viscosity |
| σ | = | shear stress |
| Ý | = | shear rate |
| σoc | = | casson yield stress |
| ω | = | angular frequency |
Acknowledgments
The authors would like to express their appreciation for the Prototype Research Grant Scheme with grant no. PY/2016/07750 provided by Ministry of Higher Education, Universiti Teknologi Mara for facilities provided, and Tokyo University of Agriculture Technology for technical assistance.
Related Research Data
References
- Noreen, A.; Nazli, Z.-I.-H.; Akram, J.; Rasul, I.; Mansha, A.; Yaqoob, N.; Iqbal, R.; Tabasum, S.; Zuber, M.; Zia, K.M. Pectins Functionalized Biomaterials; A New Viable Approach for Biomedical Applications: A Review. International Journal of Biological Macromolecules 2017, 101, 254–272.
- Lupi, F.R.; Gabriele, D.; Seta, L.; Baldino, N.; De Cindio, B.; Marino, R. Rheological Investigation of Pectin-Based Emulsion Gels for Pharmaceutical and Cosmetic Uses. Rheologica Acta 2015, 54, 41–52.
- Ghafar, F.; Nazrin, T.N.N.T.; Salleh, M.R.M.; Hadi, N.N.; Ahmad, N.; Hamzah, A.A.; Yusof, Z.A.M.; Azman, I.N. Total Phenolic Content and Total Flavonoid Content in Moringa Oleifera Seed. Galeri Warisan Sains 2017, 1(1), 23–25.
- Vriesmann, L.C.; Petkowicz, C.L.O. Highly Acetylated Pectin from Cacao Pod Husks (Theobroma Cacao L.). Forms Gel. Food Hydrocolloids 2013, 33, 58–65.
- Morales-Contreras, B.E.; Rosas-Flores, W.; Contreras-Esquivel, J.C.; Wicker, L.; Morales-Castro, J. Pectin from Husk Tomato (Physalis Ixocarpa Brot.): Rheological Behavior at Different Extraction Conditions. Carbohydrate Polymers 2018, 179, 282–289.
- Serna-Cock, L.; García-Gonzales, E.; Torres-León, C. Agro-Industrial Potential of the Mango Peel Based on Its Nutritional and Functional Properties. Food Reviews International 2016, 32(4), 364–376.
- Lee, E.H.; Yeom, H.J.; Ha, M.S.; Bae, D.H. Development of Banana Peel Jelly and Its Antioxidant and Textural Properties. Food Science and Biotechnology 2010, 19(2), 449–455.
- Emaga, T.H.; Andrianaivo, R.H.; Wathelet, B.; Tchango, J.T.; Paquot, M. Effects of the Stage of Maturation and Varieties on the Chemical Composition of Banana and Plantain Peels. Food Chemistry 2007, 103, 590–600.
- Sundar Raj, A.; Rubila, S.; Jayabalan, R.; Ranganathan, T.V.A. Review on Pectin: Chemistry Due to General Properties of Pectin and Its Pharmaceutical Uses. Open Access Scientific Reports 2012, 1(12), 1–4.
- Hua, X.; Wang, K.; Yang, R.; Kang, J.; Zhang, J. Rheological Properties of Natural Low-Methoxyl Pectin Extracted from Sunflower Head. Food Hydrocolloids 2015, 44, 122–128.
- Urias-Orona, V.; Rascón-Chu, A.; Lizardi-Mendoza, J.; Carvajal-Millán, E.A.; Gardea, A.; Ramírez-Wong, B.; Novel Pectin, A. Material: Extraction, Characterization and Gelling Properties. International Journal of Molecular Sciences 2010, 11, 3686–3695.
- Ström, A.; Ribelles, P.; Lundin, L.; Norton, I.; Morris, E.R.; Williams, A.K. Influence of Pectin Fine Structure on the Mechanical Properties of Calcium-Pectin and Acid-Pectin Gels. Biomacromolecules 2007, 8, 2668–2674.
- Yoo, B.; Yoo, D.; Kim, Y.-R.; Lim, S.-T. Effect of Sugar Type on Rheological Properties of High Methoxyl Pectin Gels. Food Science and Biotechnology 2003, 3(12), 316–319.
- Rao, M.A.; Silva, J.A.L. Pectins: Structure, Functionality, and Uses. In Food Polysaccharides and Their Applications, 2nd ed.; Stephen, A.M.; Philips, G.O.; Williams, P.A., Eds.; CRC Press: USA, 2006; pp 353–411.
- Grosso, C.R.F.; Rao, M.A. Dynamic Rheology of Structure Development in Low Methoxyl Pectin Ca2+ Plus Sugar Gels. Food Hydrocolloids 1998, 12, 357.
- May, C.D. Pectins. In Handbook of Hydrocolloids; Philips, G.O.; Williams, P.A., Eds.; CRC Press: Boca Raton, USA, 1990; pp 87–118.
- Gebhard, S. A Practical Approach to Rheology and Rheometer 2nd.; Gebrueder HAAKE GmbH: Germany, 2000, 291.
- Javanmard, M.; Endan, J.A. Survey on Rheological Properties of Fruit Jams. International Journal of Chemical Engineering and Applications 2010, 1(1), 31–37.
- McKenna, G.B. Deformation and Flow of Matter: Interrogating the Physics of Materials Using Rheological Methods. Journal of Rheology 2012, 56, 113.
- Rao, M.A. Application of Rheology to Fluid Food Handling and Processing in Rheology of Fluid and Semisolid Foods; Springer: USA, 2014, 415–456.
- Oroian, M. Physicochemical and Rheological Properties of Romanian Honeys. Food Biophysics 2012, 7, 296–307.
- Keshani, S.; Luqman Chuah, A.; Russly, A.R. Effect of Temperature and Concentration on Rheological Properties Pomelo Juice Concentrates. International Food Research Journal 2012, 19(2), 553–562.
- Chuah, T.G.; Hairul Nisah, H.; Thomas Choong, S.Y.; Chin, N.L.; Nazimah Sheikh, A.L. Effects of Temperature on Viscosity of Dodol (Concoction). Journal of Food Engineering 2007, 80, 423–430.
- Casson, N.; Flow, A. Equation for Pigment-Oil Suspensions of the Printing Ink Type. In Rheology Disperse System; Mill, C.C.;, Ed.; Pergamon Press: New York, 1959; pp 82–104.
- Cox, W.P.; Merz, E.H. Correlation of Dynamic and Steady Viscosities. Journal Polymer Science 1958, 28, 619–622.
- Mohd Rasidek, N.A.; Mad Nordin, M.F.; Shameli, K. Formulation and Evaluation of Semisolid Jelly Produced by Musa Acuminata Colla (AAA Group) Peels. Asian Pacific Journal Tropical Biomedicine 2016, 6(1), 55–59.
- Chin, N.L.; Chana, S.M.; Yusof, Y.A.; Chuah, T.G.; Talib, R.A. Modeling of Rheological Behaviour of Pummelo Juice Concentrates Using Master-Curve. Journal of Food Engineering 2009, 93, 134–140.
- Nindo, C.I.; Tang, J.; Powers, J.R.; Takhar, P.S. Rheological Properties of Blueberry Purees for Processing Applications. Swiss Society of Food Science and Technology 2007, 40, 292–299.
- Holdsworth, S.D. Rheological Models Used for the Prediction of the Flow Properties of Food Products: A Literature Review. Transactions of the IChemE 1993, 71(C3), 139–179.
- Manjunatha, S.S.; Raju, P.S.; Bawa, A.S. Modelling the Rheological Behaviour of Enzyme Clarified Lime (Citrus Aurantifolia L.). Juice Concentrate. Czech Journal Food Science 2012, 30(5), 456–466.
- Xiu, A.; Zhou, M.; Zhu, B.; Wang, S.; Zhang, J. Rheological Properties of Salecan as a New Source of Thickening Agent. Food Hydrocolloids 2011, 25, 1719–1725.
- Koocheki, A.; Mortazavi, S.A.; Shahidi, F.; Razavi, S.M.A.; Taherian, A.R. Rheological Properties of Mucilage Extracted from Alyssum Homolocarpum Seed as a New Source of Thickening Agent. Journal of Food Engineering 2009, 91, 490–496.
- Jiang, B.; Li, W.; Hu, X.; Wu, J.; Shen, Q. Rheology of Mung Bean Starch Treated by High Hydrostatic Pressure. International Journal of Food Properties 2015, 18, 81–92.
- Syahariza, Z.A.; Yong, H.Y. Evaluation of Rheological and Textural Properties of Texture-Modified Rice Porridge Using Tapioca and Sago Starch as Thickener. Journal of Food Measurement and Characterization 2017, 11(4), 1586–1591.
- Gómez-Díaz, D.; Navaza, J.M.; Quintáns-Riveiro, L.C. Intrinsic Viscosity and Flow Behaviour of Arabic Gum Aqueous Solutions. International Journal of Food Properties 2008, 11, 773–780.
- Dautant, F.J.; Simancas, K.; Sandoval, A.J.; Müller, A.J. Effect of Temperature, Moisture and Lipid Content on the Rheological Properties of Rice Flour. Journal of Food Engineering 2007, 78, 1159–1166.
- Chuah, T.G.; Keshani, S.; Chin, N.L.; Lau, M.C.; Chin, D.S.G. Rheological Properties of Diluted Pummelo Juice as Affected by Three Different Concentrations. International Journal of Food Engineering 2008, 4, 5.
- Heydon, C.J.; Scott, G.M.; Tucker, G.S. Applications of Tube Viscometry for the Flow Characterization of Gelatinized Food Starches under UHT Conditions. Transactions of the IChemE 1996, 74(C3), 81–91.
- Genovese, D.B.; Aiqain, Y.E.; Singh, H. High Methoxyl Pectin/Apple Particles Composite Gels: Effect of Particle Size and Particle Concentration on Mechanical Properties and Gel Structure. Journal of Texture Studies 2010, 41, 171–189.
- Ross-Murphy, S.B. Physical Gelation of Synthetic and Biological Macromolecules. In Polymer Gels Fundamentals and Biomedical Applications; DeRossi, D.; Kajiwara, K.; Osada, Y.; Yamauchi, A., Eds.; Plenum Press: New York, USA, 1991; pp 21–39.
- Vries, A.D.; Wesseling, A.; Linden, E.V.D.; Scholten, E. Protein Oleogels from Heat-Set Whey Protein Aggregates. Journal of Colloid and Interface Science 2017, 486, 75–83.
- Nascimento, G.E.; Simas-Tosin, F.F.; Iacomini, M.; Gorin, P.A.J.; Cordeiro, L.M.C. Rheological Behavior of High Methoxyl Pectin from the Pulp of Tamarillo Fruit (Solanum Betaceum). Carbohydrate Polymers 2016, 139, 125–130.