
ABSTRACT
There is a growing concern over the food safety issue related to increased incidence of cooking oil adulteration with recycled cooking oil (RCO). The objective of this study was to detect fresh palm olein (FPO) adulteration with RCO using fatty acid composition (FAC) and Fourier-transform infrared spectroscopy (FTIR) spectral analyses combined with chemometrics. RCO prepared in the laboratory was mixed with FPO in the proportion ranged from 1% to 50% (v/v) to obtain the adulterated oil samples (AO). FACs for FPO, RCO, and AO were determined using gas chromatography equipped with a flame ionization detector (GC-FID). The compositions of most fatty acids in RCO lied within the normal ranges of Codex standard, except for C8:0, C10:0, C11:0, C15:0, trans C18:1, and polyunsaturated fatty acids (PUFAs), C20:5. PUFAs showed a consistent decreasing trend with increasing magnitude of change with respect to increasing adulteration level and thus might be a good indicator for detecting FPO adulteration with RCO. The evaluation parameters (coefficient of determination, root mean standard error) of the FTIR-partial least square (PLS) model of palm oil adulteration with recycled oil are R2 = 0.995 and 3.25, respectively. For FTIR spectral analysis, the distinct variations in spectral regions and aberrations in characteristic bands between FPO and RCO were observed. The optimized PLS calibration model developed from normal spectral of the combined region at 3602–3398, 3016–2642, and 1845–650 cm−1 overpredict the adulteration level. On the other hand, the discriminant analysis classification model was able to classify the FPO and AO into two distinct groups. Improvement of the principles of combined techniques in authenticating AO from fresh oil is beneficial as a guideline to detect adulteration in cooking oil.
Introduction
Used cooking oil refers to animal- or plant-based fats and oils, which have been used for food preparation processes. They become wastes when they are no longer fit for human consumption. Fresh cooking oil is the qualified cooking oil that has never been used. Meanwhile, the fats and oils that are reprocessed from waste cooking oil through a refined, bleached, and deodorized process (RBD) are known as recycled cooking oil (RCO). This RBD process is performed to produce RCO with acceptable quality which can be reused again for industrial or non-food purposes.[Citation1,Citation2]
RCO is reprocessed from used or waste cooking oil which has undergone repeated heating. The adverse consequences of long-term consumption are similar to consuming repeatedly heated cooking oil, which promoting the production of free radicals. Higher prevalence of hypertension,[Citation3] atherosclerosis,[Citation4] and cancer[Citation5] which might be contributed with the consumption of street food that used cheap oil in food preparation. There is a growing concern over the safety issue related to increased incidence of fresh cooking oil adulteration. Fresh cooking oil adulteration with RCO has been prevalent in China in 2011,[Citation6] before it was reported in other countries, such as Taiwan.[Citation7] Neglecting this issue would further spread the problem, putting consumers at high risk as they could be the victims of the fresh cooking oil adulteration with RCO that happened anywhere. Besides, it may provoke the concern on ‘halal’ issue as well.[Citation1]
It is estimated that 50,000 tons of waste cooking oil are produced by Malaysians annually.[Citation8] Improper disposal of this huge amount of oil causes water and land pollution. To prevent this environmental damaging practice, this waste cooking oil is sold to vendors to recycle the oil for production of biodiesel, animal feeds, fertilizers, soaps, and candles.[Citation9] However, this RCO cannot be used for any food manufacturing purposes for human consumption. In relation, it is suspected that some unscrupulous traders might misuse the RCO collected in fresh cooking oil adulteration where it is believed that the traders mixed the RCO with a small portion of fresh cooking oil and then sold it as fresh cooking oil.[Citation7,Citation10] This claim was supported by a review which demonstrated that 24% of the scholarly records (n = 1034) of food adulteration from the year 1980 to 2010 were related to cooking oils.[Citation11] This shows that cooking oils are the food item which frequently counterfeited to gain profit. This practice is known as economically motivated adulteration, which involves the intentional addition of a substance in a product for economic gain.[Citation12]
In recent years, fresh cooking oil adulteration with RCO has become one of the main food safety issues in Malaysia. This issue becomes more worried as it was reported that RCO could be easily produced through several simple processes using magnesium trisilicate (Mg2O8Si3).[Citation7] In Taiwan, magnesium trisilicate is a food additive which is used as absorbent (with an allowance of <2%) to filter unwanted residual fat and impurities in used cooking oil[Citation13] to make the oil clearer in appearance. It is estimated that 1250 kg of used cooking oil could be filtered and produced into the RCO with a very low cost, but with the profit of over 60 times of the cost. Easy accessibility of magnesium trisilicate and the low cost involved could facilitate and aggravate the incidence of cooking oil adulteration with RCO and pose a greater threat to the consumers.
Different parameters have been used to examine the quality of oil, including free fatty acid (FFA) and total polar content (TPC). However, they are not accurate enough for detecting fresh cooking oil adulteration with RCO. Problems of false-negative and false-positive results might occur without using a distinctive approach. Gas chromatography (GC) and Fourier-transform infrared spectroscopy (FTIR) combined with chemometrics have been used to study on cooking oil adulterated with other low-priced cooking oils.[Citation14–Citation16] However, their properties have not been fully utilized in which they could be expanded in the application of detecting fresh cooking oil adulteration with RCO. Therefore, the present study was carried out to explore the application of the fatty acid composition (FAC) and FTIR spectral analysis combined with chemometrics in detecting the fresh palm olein (FPO) adulterated with RCO in order to combat the alarming issue of fresh cooking oil adulteration. This study focused on palm oil, which is the most commonly used cooking oil in Malaysia, can serve to fill the current knowledge gap. First, we hypothesized that both FTIR and FAC analyses were able to detect the adulteration of fresh cooking oil with RCO. Second, we hypothesized that the fresh palm oil available in the market is not adulterated with RCO in Malaysia. Specifically, the differences in FACs and FTIR spectra between FPO, RCO, and adulterated oils with increasing adulteration level were also determined. In addition, the ability of FAC and FTIR spectral analysis in combination with chemometrics in detecting FPO adulterated with RCO was also identified.
Materials and methods
Chemicals and reagents
Phosphoric acid, bleaching earth, concentrated sulphuric acid, and diethyl ether were purchased from Sigma Chemicals (St. Louis, MO, USA). Analytical-grade n-hexane, methanol, and acetone were purchased from Fisher Scientific (Leicestershire, UK), and fatty acid methyl ester (FAME) standard (Supelco 37-component FAME Mix, Bellefonte, PA, USA) was purchased from Sigma–Aldrich (Steinheim, Germany). Ultrapure water was obtained from a Milli-Q water purification unit (Millipore, Milford, MA, USA). All other chemicals and solvents used were of the highest grade commercially available.
Preparation and collection of oil samples
FPO (undisclosed brand) was purchased from a local market in Serdang, Selangor, Malaysia. RCO was prepared in the laboratory under pre-determined deep-frying procedure together with the procedures of RBD. Four vegetable oils used as positive and negative models of FPO (refined palm olein [RPO], sunflower oil [SFO], extra virgin olive oil [EVO], and corn oil [CO]) (three repetitions for each packet) in FTIR spectral analysis were obtained from the Dietetics Laboratory of the Faculty of Medicine and Health Sciences, Universiti Putra Malaysia, with their expiry date until September 2018. Five packet oil (PO) samples (three repetitions for each PO) were randomly selected and purchased from a local market in Serdang, Selangor, Malaysia, for authentication purpose.
Preparation of recycled cooking oil
Frying items such as fresh banana and frozen pre-fried chicken nuggets (NoFrills brand) were purchased from local market in Equine Park, Seri Kembangan, Selangor, Malaysia. Fresh banana and frozen pre-fried chicken nuggets were weighed and made into batches of 200 g, respectively. Coating flour mixture for fresh banana was prepared from wheat flour and rice flour with the ratio 3:1 and mixed with water by 1.3× of the weight. FPO was added into an electric deep fryer (DFT-6000) to the maximum capacity (5.5 L) and heated up for about 20 min until reaching 180°C. After the initial heating process, the first frying cycle was started with either one of the frying items, followed by the next cycle with another frying item. Subsequent frying cycles were performed at an interval of 30 min. Each batch of banana (coated with flour mixture) and pre-fried chicken nuggets were fried alternatively at every 30-min interval cycles for 6 and 2 min, respectively, until they turned into golden brown. In each frying cycle, TPC of the frying oil was measured using digital deep fry oil tester (Testo 270, Lenzkirch, Germany) 10 min after the frying item was taken out. The frying cycles were carried out for 8 h/day for several consecutive days until the TPC reached 24%. Subsequently, the frying oil was filtered and replenished with FPO.
Refined, bleached, and deodorized (RBD) procedure
A series of processes including washing, degumming, bleaching, and deodorization were performed on the frying oil collected to produce RCO. For washing, 1 L of oil was added with 12.5 ml of distilled water, stirred using a magnetic stirrer at 400 rpm for 15 min, and allowed to stand in the separatory funnel for 30 min. The separated aqueous layer was removed where the same washing process was performed on the separated oil layer for the second time. To ensure total removal of moisture, the oil was then heated at 105°C for 20 min. For the degumming process, the oil was added with phosphoric acid (0.6225% of the oil volume obtained after washing and heating) at 80°C and allowed to stand for 20 min. For the bleaching process, the oil was added with bleaching earth and left aside for overnight. Subsequently, the oil was filtered to remove the bleaching earth before the deodorization process. The oil was then deodorized at 260°C for 90 min using deodorization unit.
Determination of fatty acid compositions
Sample pre-treatment
A set of FPO and RCO samples (3 repetitions for each sample) were prepared without any adulteration. Briefly, a set of adulterated oil samples (AO) was prepared by mixing FPO with increasing concentration of RCO ranging from 1% to 50% (v/v). The concentrations of RCO used as adulterant were 1%, 2%, 3%, 5%, 10%, 15%, 20%, 30%, 40%, and 50%. These mixtures were vortex mixed to ensure complete homogenization. A set of 5 packet oil samples (3 repetitions for each sample) were also prepared for authentication purpose. Transmethylation of fatty acids into fatty acid methyl esters (FAME) was conducted according to the method of Christie[Citation17] with slight modifications. First, 50 µL of oil sample was transferred into a screw-cap test tube followed by 1 ml of toluene and 2 ml of 2% sulphuric acid. Tubes were placed in the heating block and refluxed at 80ºC for 2 hrs. Subsequently, 3 ml of n-hexane was added to stop the reaction of the test tube. The content was mixed and centrifuged for 10 min at 2500 rpm. After that, the upper layer, which is the hexane layer was removed into a test tube. The extraction was repeated with 3 ml of n-hexane. All the layers were pooled together as 10 ml of potassium bicarbonate was added and proceed with pH testing to ensure that the pH did not exceed 6.5. Subsequently, hexane was evaporated under nitrogen gas where 100 µL of n-hexane was used to reconstitute the extract. Finally, the organic layers containing the methyl esters were transferred to a vial for GC.
Gas chromatography-flame ionization detector (GC-FID)
The condition of the GC-FID performed on the oil sample was based on the pre-determined condition established in the Nutrition Laboratory, Faculty of Medicine and Health Sciences, Universiti Putra Malaysia. First, 1 μl of the sample was injected into a polar HP 88 capillary column (100 m × 0.25 mm i.d., 0.20 μm particles, Supelco, Bellefonte, PA, USA) with split ratio 1:10 and analysed using gas chromatography HP 6890 (Agilent Technologies, Waldbronn, Germany) equipped with flame ionization detector (FID). The initial oven temperature was set at 40°C and then heated up to 195°C at a rate of 25°C/min and hold for 25 min and further heated up to 205°C at a rate of 10°C/min and hold for 3 min and eventually heated up to 230°C at a rate of 10°C/min and hold for 10 min. Subsequently, the temperature of the detector and injector was maintained at 250°C throughout the analysis. The flow rate of the helium gas was set at 13.5 ml/min. Each oil sample was analysed for triplicates. Standard FAME mixture (Supelco 37-component FAME Mix; Sigma Chemicals, St. Louis, MO, USA) was used to determine the FACs. Internal normalization technique was used to determine the percentage of fatty acids.[Citation18]
Measurement of FTIR spectra
Preparation of oil samples
A set of FPO, RCO, and five vegetables oil samples (used as positive and negative models of FPO) (3 repetitions for each sample) were prepared without any adulteration. For Partial Least Square (PLS) calibration, a calibration set with 30 adulterated oil samples (CA) and a validation set with 30 adulterated oil samples (VA) were prepared with concentration of RCO ranging from 1% to 50% (v/v). For discriminant analysis (DA), a set of 15 FPO samples and a set of 15 adulterated oil samples (AO) containing 1% to 50% (v/v) of RCO were prepared. These mixtures were vortex mixed to ensure complete homogenization. Another 30 packet oil samples were also prepared for authentication purposes.
FTIR spectroscopy
FTIR spectral analysis was performed according to the method described by Rohman et al.[Citation19] with slight modifications. The spectra of all oil samples were scanned using FTIR spectrometer (Perkin Elmer, Waltham, MA, USA) equipped with HATR, which was used as a sampling compartment. First, several drops of each oil sample were added in contact with HATR on a multi-bounce plate of crystal at controlled ambient temperature (25°C). All spectra were measured at region from 4000 to 650 cm−1 at co-addition 32 scans and resolution of 1 cm−1 with strong apodization. These spectra were subtracted against background air spectrum. After every scan, a new reference air background spectrum was taken. The HATR plate was carefully cleaned in situ by using acetone for 3 times and dried with soft tissue before filling with the next oil sample. The spectra of all oil samples were recorded as % transmittance values at each data point in triplicate independent analyses.
FTIR spectral analysis combined with chemometrics
Chemometrics techniques such as PLS calibration and DA were performed on the FTIR spectral information for quantitative analysis and qualitative analysis, respectively. PLS calibration and DA were performed using The Unscrambler X software (version 10.4; CAMO AS, Oslo, Norway). The spectral regions where the variations occurred between FPO and RCO were chosen for developing PLS calibration models.[Citation20] Several PLS calibration models were developed from the calibration set of adulterated oil samples (CA) using different spectral regions and spectral treatments (normal and 1st derivative). These PLS calibration models were further used to predict the concentration of RCO in the validation set of adulterated oil samples (VA).[Citation20] The values of coefficient of determination (R2), root mean standard error of calibration (RMSEC) and root mean standard error of cross validation (RMSECV) were used as the criteria to validate the PLS calibration model. The predictability of the model was evaluated from the root mean square of prediction (RMSEP). The PLS calibration models were optimized based on the model which gave the highest value of R2 and lowest values of RMSEC and RMSECV. The spectral region and spectral treatment of the optimized PLS calibration model was used to establish the DA model. The accuracy level and lowest detectable adulteration level of the DA model in classifying the adulterated oil samples (AO) from FPO were also determined. For authentication purpose, the optimized PLS calibration model as well as the DA classification model were performed on the FTIR spectra of the 5 packet oils to detect possible adulteration of RCO in FPO.
Statistical analysis
Percentages of all fatty acids were reported in triplicate independent analyses as the mean and standard deviation. Functional groups and its modes of vibration were assigned to the respective characteristic bands appeared in FPO and RCO. Intensities of bands were rated from very weak to very strong by comparing the size of the band areas. Independent-samples t-test was performed using IBM SPSS Statistics 22 (SPSS Inc., Chicago, IL, USA) to examine the differences in FAC between FPO and RCO as well as each datapoint along the whole spectra between FPO and RCO. The significance level was set at p < 0.05.
Results and discussions
Comparison of fatty acid compositions between fresh palm olein, recycled cooking oil, and Codex standard
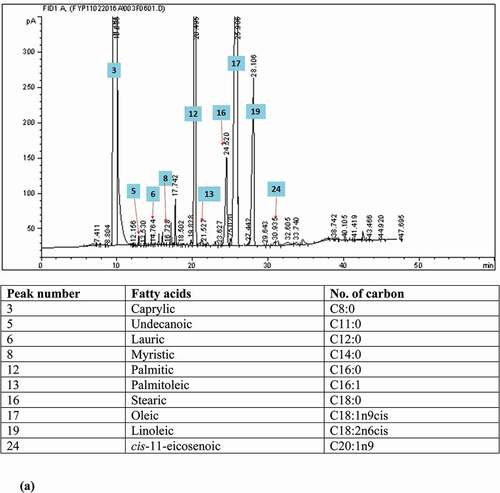
FAC of the FPO in this study was in compliance with the national and international reference standards as shown in . The predominant fatty acids found in FPO were palmitic acid (C16:0; 43.09 ± 4.64%) and oleic acid (C18:1; 39.85 ± 4.26%), followed by linoleic acid (C18:2; 9.91 ± 0.95%) and stearic acid (C18:0; 4.92 ± 1.62%). FPO is known for its rich source of saturated fatty acids (SFAs; 49.67 ± 5.28%). The unsaturated fatty acids (USFAs) accounted for half of the FAC (50.33 ± 5.27%). Several fatty acids which were not found in FPO, such as, C8:0, C10:0, C11:0, trans C18:1, and C20:5, were detected in RCO in trace amounts (<0.1%) (). The presence of C11:0 (0.02%) in RCO could be supported by a study which had demonstrated the increment of C11:0 by five to six times in heated bean oil (0.26–1.50 μg/g oil), CO (0.23–1.55 μg/g oil), and peanut oil (0.41–2.36 μg/g oil) heated at 180⁰C.[Citation23] It is noteworthy that C11:0 was then selected as one of the indicators to detect illegal cooking oil (sourced from heated vegetable oil) in China.[Citation23] However, a trace amount of C11:0 (<0.05%) was detected in FPO[Citation22] and other vegetable oils.[Citation23] Perhaps, more studies are needed to determine the exact threshold level for C11:0 to identify the presence of RCO in fresh cooking oil.
Table 1. Comparison of fatty acid compositions between fresh palm olein (FPO), recycled cooking oil (RCO), and Codex standard (as a percentage of total fatty acids).
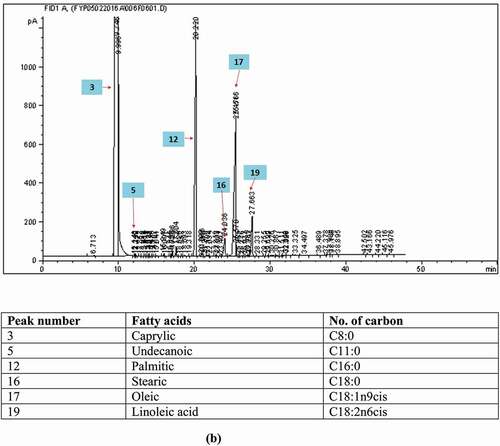
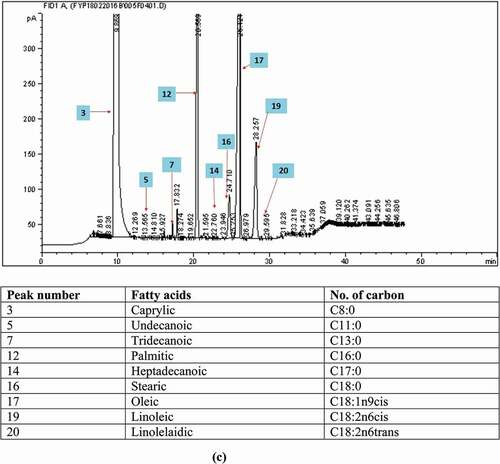
Figure 1. The gas chromatograms of the fatty acid composition analyses of (a) fresh palm oil, (b) recycled cooking oil, and (c) adulterated oil.
(continue).
(continue).
The presence of C8:0 (0.03 ± 0.02%), C10:0 (0.02 ± 0.01%), and C20:5 (0.05 ± 0.03%) in RCO () was due to the migration of fats from the fried items into the frying oil during the frying process.[Citation24] Besides, the total odd-chain fatty acid (OCFA) composition (C15:0, C17:0, and C17:1) in RCO (0.27 ± 0.03%) was significantly higher (p < 0.05) than that in FPO (0.16 ± 0.03%). It is postulated that the migration of fats is mostly from the chicken nuggets rather than from the batter-coated banana. Chicken nuggets used in the present study contained chicken fats and chicken meat where chicken fat was shown to contain 0.3% of C8:0[Citation25], while chicken meat contained <1% of C10:0.[Citation26] Moreover, fats under chicken skin also contain about 0.11% of C15:0, 0.22% of C17:0, and 0.26% of C17:1.[Citation25] Besides, C20:5 (eicosapentaenoic acid) could also be present in chicken meat depending on the quality of feed.[Citation27,Citation28] Another possible mechanism could be due to the formation of short-chain fatty acids (SCFAs) from longer USFAs, for example, oleic, linoleic, and linolenic acids during thermal oxidation reaction.[Citation23,Citation29] The SCFAs formed during this reaction were 7- to 9- carbon-numbered fatty acids attached to the glycerol backbone, where they were non-volatile and not lost in the atmosphere during frying.[Citation30,Citation31]
The presence of trans C18:1 (increased by 0.09 ± 0.01%), the only TFA detected in the RCO among the TFAs of interest (trans C18:1 and trans C18:2), could be due to the generation from the trans-isomerization occurred during the frying and deodorization processes performed under high temperature (180⁰C and 260⁰C, respectively).[Citation32] This was probably because the controlled frying process at 180–185⁰C did not increase the compositions of TFAs to a high extent.[Citation29,Citation33,Citation34] It is evident from a study that reported the total trans isomers in canola oil increased only slightly by 0.9% (from 2.4% to 3.3%) after 49 h of frying at 185⁰C.[Citation29] However, there was a significant increase in monounsaturated fatty acids (MUFAs) (p < 0.05) from 40.23 ± 3.85% (in FPO) to 44.57 ± 0.05% (in RCO), which contributed mainly by the great increment in C18:1 (from 39.85 ± 4.26–43.85 ± 0.16%). A possible explanation for the increment of C18:1 was the formation of cyclic fatty acid monomers (CFAM) from C18:2 and C18:3 during deodorization procedure.[Citation24]
Despite several noticeable alterations were observed in FAC of RCO when compared with FPO, the changes might be minor that the compositions of most fatty acids found in RCO were still lied within the normal ranges of Codex standard, except for polyunsaturated fatty acids (PUFAs), C15:0, and those fatty acids not available in Codex standard (C8:0, C10:0, C11:0, trans C18:1, and C20:5) (). This suggested that these fatty acids might be used in combination as the indicators for detecting FPO adulteration with RCO using FAC analysis. There were several possible factors that could explain on the minor changes in FACs between RCO and FPO. First, the frying procedure to prepare the RCO was less aggressive compared to the commercial frying industry, which involved more frying cycle with a greater quantity of frying items, longer frying duration, and higher temperature. Second, replenishing the fresh oil into the used frying oil could mask the effect of fat degradation by maintaining the fat degradation at a desirable level.[Citation35] Third, the RBD procedure conducted during reprocessing of RCO might have removed some interested fatty acids such as SCFAs.[Citation23]
Changes in FAC of adulterated oil with increasing adulteration
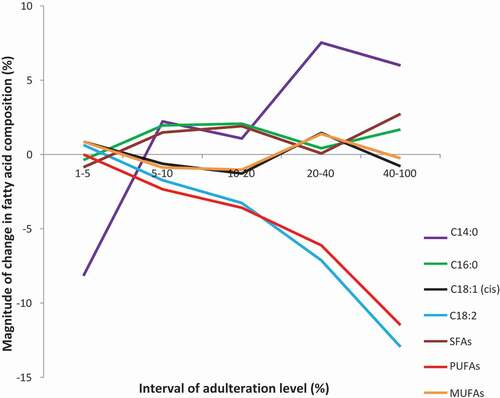
After being heated and reprocessed, FAC of RCO had experienced a certain degree of alterations. This effect was believed could be retained and expressed through the FACs of adulterated oil samples (AO) that prepared by mixing FPO with increasing concentration of RCO ranged from 1% to 50%. demonstrates the changes of the FACs with increased adulteration level. It was observed that the adulterated oil with adulteration level of 50% had several outlier values at C16:0, C18:0, cis C18:1, and C18:2, and thus, this adulterated oil sample was excluded. After excluding the adulterated oil sample with 50% adulteration level, the composition of each of the fatty acids also demonstrates a consistent increasing or decreasing trend with increasing adulteration level. However, when the changes of the FACs with increasing adulteration level were interpreted in the manner of the magnitude of change in FAC versus interval of adulteration level (), it was observed that only PUFAs demonstrated a consistent decreasing trend with increasing magnitude of change. This suggested that PUFAs is an indicator that best described the changes in FACs within the AO. This further supported that PUFAs might be a good indicator among other potentially useful indicators suggested in the previous section for detecting FPO adulteration with RCO.
Table 2. Comparison of fatty acid compositions between fresh palm olein, recycled cooking oil, and adulterated oil samples with different adulteration levels (expressed as percentage of total fatty acids).
Figure 2. Magnitude of change in fatty acid compositions versus interval of adulteration level.
FTIR spectral analysis of fresh palm olein and recycled cooking oil
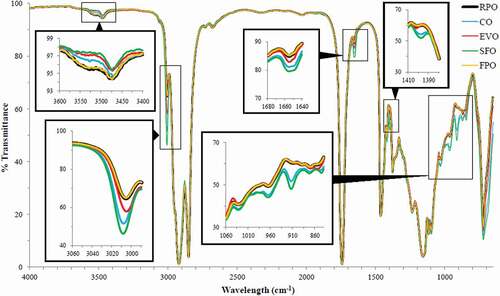
FPO was compared with its positive model (RPO) as well as its negative models (CO, EVO, and SFO) for their respective spectra at mid-infrared regions of 4000–650 cm−1 in order to demonstrate that the fingerprint technique of FTIR is effective to differentiate between different kinds of vegetable oils. shows that all spectra demonstrated typical characteristic bands of fats and oils as described in the previous study.[Citation36] This was because the main component found in these oils was triacylglycerols.[Citation19] Several studies reported that different vegetable oils had different intensities of band absorbance, especially at the fingerprint region of <1650 cm−1[Citation16,Citation37] probably due to variation in their FACs.[Citation38] shows that the spectra of the negative models (CO, EVO, and SFO) were different within the negative models as well as from the spectrum of the FPO in terms of the intensities of band absorbance, where this result is in consistent with the previous studies.[Citation16,Citation34] On the other hand, the spectrum of RPO overlapped with the spectrum of the FPO. This indicated that the FPO used in this study was a qualified product as its composition was typically a characteristic of palm olein. These results showed that the fingerprint technique of FTIR was able to differentiate between different kinds of vegetable oils.
Figure 3. Comparison of the FTIR spectra between fresh palm olein (FPO) with refined palm olein (RPO), corn oil (CO), extra virgin olive oil (EVO), and sunflower oil (SFO) at 4000–650 cm−1.
Aberrations in the FTIR spectrum of recycled cooking oil
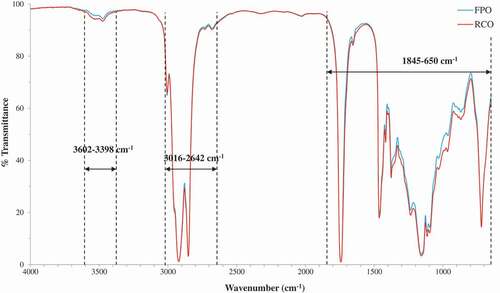
demonstrates the FTIR spectra of FPO and RCO at mid-infrared regions of 4000–650 cm−1. Both spectra were similar in terms of the shape and the position of the characteristic bands because both oils (FPO and RCO) were of the same origin, and the major constituent found in RCO was triglycerides.[Citation39] The characteristic bands found in both spectra were assigned with the respective functional groups and modes of vibration (). The intensities of band absorbance were rated from very weak to very strong by comparing the size of the band areas. Even though both FPO and RCO were of the same origin, spectral differences (variations) between both these oils could still be observed at regions of 3602–3398, 3016–2642, and 1845–650 cm−1 (), and the differences were significant (p < 0.05). By having a closer scrutiny, several noticeable aberrations in the absorbance intensities or exact positions of bands between both spectra were observed at 3529, 3442, 1655, 988, 964–968, and 908–904 cm−1 ().
Table 3. Functional group assignment responsible for the specific characteristic band.
Figure 4. Comparison of the FTIR spectra of fresh palm olein (FPO) and recycled cooking oil (RCO) at 4000–650 cm−1.
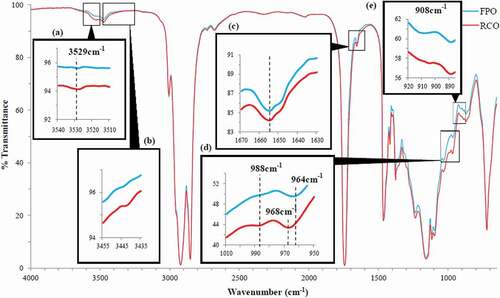
Aberrations in FTIR bands due to the formation of oxidation products
Band at 3529 cm−1 that corresponding to –OH stretching vibration[Citation40] appeared to be more intense and wider in RCO compared to FPO (), indicating a greater intensity of band absorbance. The increased absorbance intensity at band 3530–3526 cm−1 was also reported in several previous studies which involved heating the vegetable oils at 70–90⁰C for 14–35 days or at 230⁰C for 200 min. The aberration was due to the significant amounts of alcohols or secondary oxidation products formed from thermal oxidation as well as the formation of -OH functional group associated with mono- and diacylglycerols from hydrolysis according to previous studies.[Citation41–Citation44]
Band at 3442 cm−1 that attributed by -OH stretching vibration[Citation40] was not found in FPO but appeared in RCO with very weak intensity (). This finding was in agreement with the previous studies which reported that the band near 3442 cm−1 was absent in fresh non-oxidized SFO[Citation41] but found in oxidized vegetable oils heated at 70ᵒC for 14–21 days or at 230ᵒC for 200 min.[Citation41,Citation42,Citation44] Similar to the oxidized vegetable oils, the appearance of the band at 3442 cm−1 in RCO was due to the hydroperoxides or primary oxidation products formed.[Citation41,Citation42,Citation44] In fact, hydroperoxides which act as the reaction intermediaries are unstable at frying temperature.[Citation45] Thus, the amounts of hydroperoxides formed in RCO could diminish over time as these unstable molecules degraded into alcohols, aldehydes, ketones, and other secondary oxidation compounds, [Citation42,Citation43] as witnessed via the increased intensity at band 3529 cm−1 in RCO. This could then explain the band at 3442 cm−1 (with very weak intensity) found in RCO. The degradation of unstable hydroperoxides into other secondary oxidation products could be further proven by the inconsistent outcome for the peroxide values of RCOs obtained from our laboratory (unpublished results).
Aberrations in FTIR bands due to the reduction of cis double bonds
The change in unsaturation level between FPO and RCO was detected from the noticeable aberrations found in two characteristic bands, which were at 1655 and at 908–904 cm−1. and demonstrates that the absorbance intensities at bands of 1655 and 908–904 cm−1 were less intense in RCO compared to FPO. This observation was in consistent with a previous study which showed that heating vegetable oils until the advanced oxidation stage (at 70ᵒC for 21 days) would eventually lead to the extinction of the bands near 1654 cm−1 and near 914 cm−1.[Citation42] Since bands at 1655 cm−1 and at 908–904 cm−1 were associated with the stretching and bending vibrations of cis carbon–carbon double bonds, respectively, the less intense absorbance intensities at both bands in RCO might be related to the reduction in cis double bond of USFAs.[Citation36,Citation42] This could be further proven by a study which demonstrated that the absorbance intensities for bands near 1657 and 914 cm−1 became weaker after blending highly unsaturated soybean oil with saturated palm kernel olein.[Citation38]
The change of trans composition was detected through the changes occurred in bands at 968–964 and at 988 cm−1 (). The band near 968–964 cm−1 was responsible for the bending vibration of the isolated trans double bond.[Citation36,Citation40,Citation44] The band at 964 cm−1 appeared in FPO which had a less intense absorbance was probably due to small amounts of trans isomers formed upon RBD procedure during the production of fresh oil.[Citation46] Several previous studies reported that the band near 967 cm−1 was shifted to higher wavelength and the band near 969 cm−1 was formed as the advanced oxidation process due to the formation of secondary oxidation products such as aldehydes or ketones with the isolated trans double bond.[Citation42,Citation44] Consistent with the previous studies, it was observed that this similar band was shifted from 964 cm−1 (in FPO) to the higher wavelength of 968 cm−1 (in RCO). The maximum wavelength for this band could be shifted up to 976 cm−1 for oil rich in oleic acyl groups at the very advanced stage of the oxidative process.[Citation42]
On the other hand, bands at 988 cm−1 were responsible for the bending vibration of the conjugated trans-trans double bond.[Citation40,Citation42,Citation44] Several previous studies reported that 988 cm−1 was the maximum wavelength for this band, in which the wavelength had increased progressively from 982 to 985 cm−1 until 988 cm−1 as the oxidation process advanced.[Citation42,Citation44] It was also reported that the band at 985–983 cm−1 was absent in fresh non-oxidized vegetable oils which are rich in oleic acid.[Citation42] In consistent with the previous study, the band at 988–982 cm−1 was totally absent in FPO which was rich in oleic acid, but the band at 988 cm−1 was observed in RCO after being heated for 40 h at 180ᵒC. The appearance of the band at 988 cm−1 in RCO was probably due to the formation of trans isomers that contributes to the conjugated trans configuration as the consequence of prolonged frying.[Citation42]
From the discussion above, it seems that the impact of degradation reactions was noticeable via the aberrations in these FTIR bands observed in the spectrum of RCO, including the formation of oxidation products and trans double bond, as well as the reduction of cis double bond. Besides, the observation of reduced cis double bond in RCO could support the decreased composition of PUFAs as well as the suggested possibility on the formation of CFAMs which lead to increased compositions of C18:1 and MUFAs. Lastly, the formation of a trans double bond in RCO is also in agreement with the findings of FAC analysis which showed the appearance of trans fatty acids in RCO. Thus, it is suggested that these FTIR bands might be potentially useful for the detection of FPO adulteration with RCO using FTIR spectral analysis.
FTIR spectral analysis in combination with chemometrics
The spectral regions where variations were observed between FPO and RCO (3602–3398, 3016–2642, and 1845–650 cm−1) () were used to develop models for chemometrics, which involved quantitative and qualitative analyses. PLS calibrations were performed to quantify the adulteration level (concentration of RCO) in the oil samples. The power of the PLS calibration model depended on its ability to obtain the spectral information from selected spectral regions and develop the regression equation to correlate the changes in spectra with the changes in adulteration level of oil.[Citation47]
Figure 5. The FTIR spectral regions where variations between fresh palm olein (FPO) and recycled cooking oil (RCO) were significant (p < 0.05).
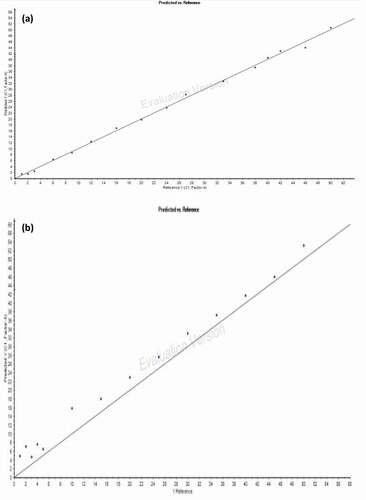
demonstrates the performances of the PLS calibration models developed using the adulterated oil samples in the calibration set (CA). It was shown that none of these PLS calibration models provided the highest value of the coefficient of determination (R2) and lowest values of RMSEC and RMSECV. In view of this, the PLS calibration model developed from the normal spectral of the combined spectral region (3602–3398, 3016–2642, and 1845–650 cm−1) was chosen as the optimized PLS calibration model. This was because it offered the most ideal model for adulteration level prediction by having the second highest R2 value (0.998), the third lowest value of RMSEC (0.796), and the second lowest value of RMSECV (1.349). Besides, it also offered the third lowest root mean square error of prediction (RMSEP = 3.218). However, due to the relatively high RMSEP, it was observed that this optimized PLS calibration model may tend to overpredict the adulteration level of the adulterated oil samples in the validation set (VA) (). The lowest FTIR-predicted adulteration level was 4.72%, while the lowest actual adulteration level was 1%.
Table 4. The performances of the PLS calibration models for quantification of adulteration level in adulterated oil samples.
Figure 6. The optimized PLS calibration model for the relationship between actual versus FTIR-predicted adulteration level using FTIR normal spectral at the combined spectral region of 3602–3398 cm−1, 3016–2642 cm−1, and 1845–650 cm−1 for (a) calibration set (CA) and (b) validation set (VA).
A similar work done previously to detect the rapeseed oil adulterated with RCO using FTIR reported that the optimized PLS calibration model had R2 = 0.9982, RMSEC = 0.494, and RMSEP = 0.627.[Citation48] It was noticed that the RMSEC and RMSEP in the previous study were relatively lower compared to the present study (RMSEC = 0.796, RMSEP = 2.810). This probably because the sources of RCO used in both studies were different. The RCO used in the previous study was supplied by food factories and restaurants which might have exposed to the harsh cooking condition. The harsh cooking condition would make the variation between fresh cooking oil and RCO more noticeable and easy to be detected.
Qualitative analysis of adulteration
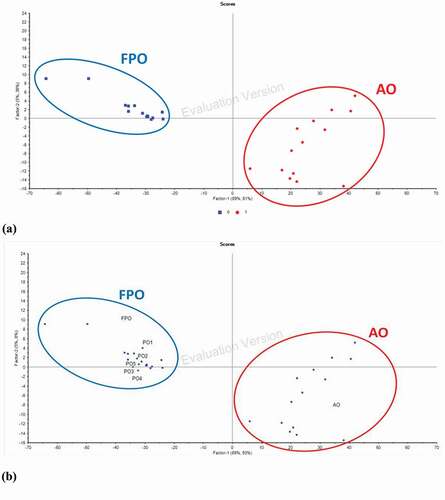
Discriminant analysis (DA) was performed to develop a classification model to classify the adulterated oil (AO) from FPO. The DA classification model was developed using the spectral region and spectral treatment which applied in the optimized PLS calibration model (normal spectral at the combined spectral region of 3602–3398, 3016–2642, and 1845–650 cm−1). and demonstrates the DA classification model that classified the FPO and AO into two distinct groups, where the percentage of variation is 42.5%. This indicated that this DA model is able to 100% accurately differentiate the oil samples (FPO or AO) according to its group, even though the AO with the adulteration level as low as 1%. This was consistent with the finding of the previous study which also showed that the DA model developed was able to accurately classify 100% of all samples into its own group.[Citation48]
Figure 7. DA score plot for (a) the classification between fresh palm olein and adulterated oil samples together with (b) the classification of different packet oils into the group of fresh palm olein.
Authentication of packet oils available in the market
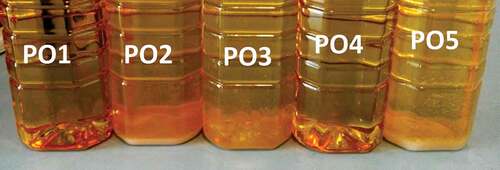
Both FAC analysis and FTIR spectral analysis combined with chemometrics (PLS and DA) were applied on five randomly selected packet oils (POs) available in the market for authentication purpose. Based on the optimized PLS calibration model, it was found that the FTIR-predicted adulteration level for PO1 (12.76%), PO2 (7.41%), and PO5 (5.28%) were more than the lowest FTIR-predicted value for validation set (4.72%) (). Precipitation was observed in PO1, PO2, PO3, and PO5 after 3 months of storage at a cool and dark place (). This suggested that PO1, PO2, PO3, and PO5 had the possibility of adulteration. These observations from the PLS calibration model and visual observation were further supported by their FAC compositions (). It was shown that the fatty acids which are not found in the Codex standard (C10:0, C11:0, C20:5, and C22:2) ( and ) appeared in PO1, PO2, PO3, and PO5 (). Besides, the compositions of C18:2 and PUFAs for PO5 were also out of the normal ranges of the Codex standard (). Based on the results from PLS calibration model and visual observation, all POs except PO4 had the possibility of adulteration. These findings suggested it is possible that POs are adulterated with RCO. However, the DA classification model with high accuracy level classified all the five POs into a group of FPO (). In other words, all the POs were still fresh and not adulterated.
Table 5. FTIR-predicted adulteration level and fatty acid compositions of different packet oils.
Figure 8. Visual observation of the packet oils purchased from the local market after 3 months of storage at a cool and dark place. The white box indicates precipitation happened in these oil samples after 3 months of storage.
The inconsistent results obtained from respective analyses were unable to give conclusive findings for the authentication of the POs available in the market. One of the possible explanations was the RCO which was prepared and used in the present study to develop models for chemometrics might be different from the RCO that produced and used in the market. The RCO prepared in the laboratory might not well resemble the waste oil or RCO produced in the commercial frying or food industries. Several factors might contribute to the deviation of the finding such as frying procedure (less harsh in the present study), frying items, RBD procedure, etc. Besides, the FPO used in the present study was obtained only from a single brand from a single local market, in which the variations in the oil due to different production date and storage condition might be overlooked. This might make the findings and models developed from FPO and RCO in this present study not so well applicable on the POs found in the market, leading to the inconsistent results for the authentication of the POs. Hence, a further refinement on the principles and concepts of both techniques (FAC analysis and FTIR spectral analysis combined with chemometrics) is needed for a more convincing outcome to resolve the issue of FPO adulteration with RCO.
Thus, two sets of experiments for self-prepared RCO and commercial RCO, respectively, should be conducted in future studies. The findings might give a new perspective on the difference of the RCO produced in home-cooking and produced from commercial frying operation as well. The findings from this study can help to provide beneficial information to the regulatory authorities to construct standard guidelines for the detection of fresh cooking oil adulteration.
Conclusion
Several noticeable alterations in FAC of RCO was observed when compared to FPO, which included (i) the appearance of short-chain fatty acids (C8:0 and C10:0), trans fatty acids (trans C18:1), and other fatty acids not found in FPO (C11:0 and C20:5); (ii) the significant increase in OCFAs; (iii) significant increase in MUFAs; and (iv) insignificant decrease in PUFAs. Thus, these fatty acid analyses are suggested to be used in combination as the indicators for detecting FPO adulteration with RCO. PUFAs might be a good indicator as it showed a consistent decreasing trend with increasing magnitude of change with respect to increasing adulteration level. The FAC analysis and FTIR spectral analysis were able to determine the differences between FPO, RCO, and AO in terms of the FACs and the FTIR spectra, respectively. Thus, both techniques were shown to be highly applicable to detect the adulteration of fresh cooking oil with RCO. However, further refinement of the principles and concepts of both techniques is needed in order to obtain a more convincing outcome to resolve the issue of FPO adulteration with RCO.
Acknowledgements
The authors gratefully acknowledge the technical assistance of the laboratory staffs from the Department of Nutrition and Dietetics, Faculty of Medicine and Health Sciences, Universiti Putra Malaysia, Malaysia. The authors declare that there are no conflicts of interest. This article does not contain any studies with human participants or animals performed by any of the authors.
References
- Daniel, S.; Wong, P.M. Many Cashing in on Business of Recycling Used Cooking Oil. The Star Online. 2013. Retrieved from http://www.thestar.com.my/news/community/2013/10/29/its-time-to-regulate-many-cashing-in-on-business-of-recycling-used-cooking-oil/
- Food and Health Bureau, Environment Bureau, Food and Environmental Hygiene Department, Environmental Protection Department, Centre for Food Safety. Legislative Proposals on Regulation of Edible Fats and Oils and Recycling of “Waste Cooking Oils”. 2015. Retrieved from http://www.fhb.gov.hk/download/press_and_publications/consultation/150707_f fats_oils/e_legislative_proposals.pdf
- Soriguer, F.; Rojo-Martínez, G.; Dobarganes, M.C.; Almeida, J.M.G.; Esteva, I.; Beltrán, M.; De Adana, M.S.R.; Tinahones, F.; Gómez-Zumaquero, J.M.; García-Fuentes, E.; Gonza´lez-Romero, S. Hypertension Is Related to the Degradation of Dietary Frying Oils. American Journal of Clinical Nutrition. 2003, 78, 1092–1097. DOI: 10.1093/ajcn/78.6.1092.
- Srivastava, S.; Singh, M.; George, J.; Bhui, K.; Saxena, A.M.; Shukla, Y. Genotoxic and Carcinogenic Risks Associated with the Dietary Consumption of Repeatedly Heated Coconut Oil. British Journal of Nutrition. 2010, 104, 1343–1352. DOI: 10.1017/S0007114510002229.
- Tan, K.X.; Omar, N.A.; Low, W.Y.; Hamzah, A.; Raj, S.; Jaarin, K.; Othman, F.; Hussan, F. Reheated Palm Oil Consumption and Risk of Atherosclerosis: Evidence at Ultrastructural Level. Evidence Based Complementary and Alternative Medicine. 2012, 1–6. DOI: 10.1155/2012/805932.
- Ramzy, A.; China Cracks down on “Gutter Oil,” A Substance Even Worse than Its Name. Time, 2011. Retrieved from http://world.time.com/2011/09/13/china-cracks-down-on-gutter-oil-a-substance- even-worse-than-its-name/
- Hong, K.C.; Lim, C.L. Jia Jian Kang You (Er): Hui Guo You Fan Lan Xue Long Zui Yan Zhong [Adding Healthy Oil (2): Recycled Cooking Oil Become Prevalent, Most Serious in Selangor and Kuala Lumpur]. Guang Ming Daily, 2012. Retrieved from http://news.sinchew.com.my/topic/node/296956?tid=901
- Loh, S.K.; Choo, Y.M.; Cheng, S.F.; Ma, A.N. Recovery and Conversion of Palm Olein-Derived Used Frying Oil to Methyl Esters for Biodiesel. Journal of Oil Palm Research. 2006, 18, 247–252.
- Toop, G.; Alberici, S.; Spoettle, M.; van Steen, H. Trends in the UCO Market: Input to DRAFT PIR. 2013. Retrieved from https://www.gov.uk/government/uploads/system/uploads/attachment_data/file/266089/ecofys-trends-in-the-uco-market-v1.2.pdf
- Tay, T.Y.; McDonalds in China, Recycled Cooking Oil in Malaysia. Sin Chew Daily, 2012. http://www.mysinchew.com/node/71687#sthash.Om3q5JJX.dpuf
- Moore, J.C.; Spink, J.; Development, L.M. Application of a Database of Food Ingredient Fraud and Economically Motivated Adulteration from 1980 to 2010. Journal of Food Science. 2012, 77(4), R118–R126. DOI: 10.1111/j.1750-3841.2012.02657.x.
- Johnson, R.;. Food Fraud and “Economically Motivated Adulteration” of Food and Food Ingredients. 2014. Retrieved from https://www.fas.org/sgp/crs/misc/R43358.pdf
- Food and Drug Administrative. Simple Manual for Safety Management of Frying Oil. 2011. Retrieved from http://www.fda.gov.tw/TC/publicationsContent.aspx?id=29&chk=dcf6b195-0fcf-4105-8f27-b9bbcf406a8c#.Vll_bHYrLIU
- Peng, D.; Bi, Y.; Ren, X.; Yang, G.; Sun, S.; Wang, X. Detection and Quantification of Adulteration of Sesame Oils with Vegetable Oils Using Gas Chromatography and Multivariate Data Analysis. Food Chemistry. 2015, 188, 415–421. DOI: 10.1016/j.foodchem.2015.05.001.
- Rohman, A.; Che Man, Y.B. Fourier Transform Infrared (FTIR) Spectroscopy for Analysis of Extra Virgin Olive Oil Adulterated with Palm Oil. Food Research International. 2010, 43, 886–892. DOI: 10.1016/j.foodres.2009.12.006.
- Rohman, A.; Che Man, Y.B. Quantification and Classification of Corn and Sunflower Oils as Adulterants in Olive Oil Using Chemometrics and FTIR Spectra. Scientific World Journal. 2012;2012:250795. doi: 10.1100/2012/250795.
- Christie, W.W.; Preparation of Ester Derivatives of Fatty Acids for Chromatographic Analysis. 1993. Retrieved from http://aocs.files.cms- plus.com/LipidsLibrary/images/Importedfiles/lipidlibrary/topics/ester_93/file.pdf
- Rohman, A.; Ariani, R. Authentication of Nigella sativa Seed Oil in Binary and Ternary Mixtures with Corn Oil and Soybean Oil Using FTIR Spectroscopy Coupled with Partial Least Square. Scientific World Journal. 2013 Nov 11;2013:740142. doi: 10.1155/2013/740142.
- Rohman, A.; Che Man, Y.B.; Hashim, P.; Ismail, A. FTIR Spectroscopy Combined with Chemometrics for Analysis of Lard Adulteration in Some Vegetable Oils. CyTA - Journal of Food. 2011, 9(2), 96–101. DOI: 10.1080/19476331003774639.
- Nunes, C.A.;. Vibrational Spectroscopy and Chemometrics to Assess Authenticity, Adulteration and Intrinsic Quality Parameters of Edible Oils and Fats. Food Research International. 2014, 60, 255–261. DOI: 10.1016/j.foodres.2013.08.041.
- Joint Food and Agriculture Organization of the United Nations/World Health Organization (Joint FAO/WHO). Codex Standard for Named Vegetable Oils CX-STAN 210 – 1999. 2015. Retrieved from http://www.fao.org/input/download/standards/336/CXS_210e_2015.pdf
- Joint Food and Agriculture Organization of the United Nations/World Health Organization (Joint FAO/WHO). Codex Alimentarius Commission. 1999. Retrieved from ftp://ftp.fao.org/codex/Meetings/CCFO/ccfo16/fo99_42.pdf
- Jin, J.; Wang, L.; Chen, J.; Tian, Y.; Zou, L.; Zhang, B.; Wang, X.; Novel, A. Method for the Identification of Illegal Cooking Oil (2): Determination of Special Odd-Chain Fatty Acids by Multidimensional Gas Chromatography-Mass Spectrometry. Chinese Journal of Chromatography. 2012, 30(11), 1100–1107.
- Boskou, D.; Elmadfa, I., Eds. Frying of Food: Oxidation, Nutrient and Non-Nutrient Antioxidants, Biologically Active Compounds, and High Temperatures. 2nd ed.; CRC Press: Boca Raton, FL, 2011.
- Méndez-Lagunas, L.L.; Siles-Alvarado, S.; Rodríguez-Ramírez, J.; Aquino-González, L.A. Fatty Acid Profile Composition of Chicken Skin. International Journal of Chemical and Biomolecular Science. 2015, 1(3), 193–196.
- Cortinas, L.; Villaverde, C.; Galobart, J.; Baucells, M.D.; Codony, R.; Barroeta, A.C. Fatty Acid Content in Chicken Thigh and Breast as Affected by Dietary Polyunsaturated Level. Poultty Science. 2004, 83, 1155–1164. DOI: 10.1093/ps/83.7.1155.
- López-Ferrer, S.; Baucells, M.D.; Barroeta, A.C.; Grashorn, M.A. N-3 Enrichment of Chicken Meat. 1. Use of Very Long-Chain Fatty Acids in Chicken Diets and Their Influence on Meat Quality: Fish Oil. Poultry Science. 2001, 80, 741–752. DOI: 10.1093/ps/80.6.741.
- Narciso-Gaytán, C.; Shin, D.; Sams, A.R.; Keeton, J.T.; Miller, R.K.; Smith, S.B.; Sánchez-Plata, M.X. Lipid Oxidation Stability of Omega-3 and Conjugated Linoleic Acid-Enriched Sous Vide Chicken Meat. Poultry Science. 2011, 90(2), 473–480. DOI: 10.3382/ps.2010-01002.
- Aladedunye, F.A.; Przybylski, R. Degradation and Nutritional Quality Changes of Oil during Frying. Journal of the American Oil Chemists’ Society. 2009, 86, 149–156. DOI: 10.1007/s11746-008-1328-5.
- Brühl, L.;. Fatty Acid Alterations in Oils and Fats during Heating and Frying. European Journal of Lipid Science and Technology. 2014, 116(6), 707–715. DOI: 10.1002/ejlt.v116.6.
- Márquez-Ruiz, G.; Dobarganes, C. Short-Chain Fatty Acid Formation during Thermoxidation and Frying. Journal of the Science of Food and Agriculture. 1996, 70, 120–126. DOI: 10.1002/(ISSN)1097-0010.
- Tsuzuki, W.; Matsuoka, A.; Ushida, K. Formation of Trans Fatty Acids in Edible Oils during the Frying and Heating Process. Food Chemistry. 2010, 123(4), 976–982. DOI: 10.1016/j.foodchem.2010.05.048.
- Chen, Y.; Yang, Y.; Nie, S.; Yang, X.; Wang, Y.; Yang, M.; Li, C.; Xie, M. The Analysis of Trans Fatty Acid Profiles in Deep Frying Palm Oil and Chicken Fillets with an Improved Gas Chromatography Method. Food Control. 2014, 44, 191–197. DOI: 10.1016/j.foodcont.2014.04.010.
- Tsuzuki, W.; Nagata, R.; Yunoki, R.; Nakajima, M.; Nagata, T. cis/trans-Isomerisation of Triolein, Trilinolein and Trilinolenin Induced by Heat Treatment. Food Chemistry. 2008, 108, 75–80. DOI: 10.1016/j.foodchem.2007.10.047.
- Schwarzinger, M.; Ahammer, W.; Gombos, J.; Reitbauer, H.; Weiland, P. Optimum Deep-Frying; German Society for Fat Science: Germany, 2012.
- Guillén, M.D.; Cabo, N. Infrared Spectroscopy in the Study of Edible Oils and Fats. Journal of the Science of Food and Agriculture. 1997, 75, 1–11. DOI: 10.1002/(ISSN)1097-0010.
- Zhang, Q.; Liu, C.; Sun, Z.; Hu, X.; Shen, Q.; Wu, J. Authentication of Edible Vegetable Oils Adulterated with Used Frying Oil by Fourier Transform Infrared Spectroscopy. Food Chemistry. 2012, 132, 1607–1613. DOI: 10.1016/j.foodchem.2011.11.129.
- Nor Hayati, I.; Che Man, Y.B.; Tan, C.P.; Nor Aini, I. Physicochemical Characteristics of Soybean Oil, Palm Kernel Olein, and Their Binary Blends. International Journal of Food Science and Technology. 2009, 44, 152–161. DOI: 10.1111/j.1365-2621.2007.01700.x.
- Shen, Y.; Chen, S.; Du, R.; Xiao, Z.; Huang, Y.; Rasco, B.A.; Lai, K. Rapid Assessment of the Quality of Deep Frying Oils Used by Street Vendors with Fourier Transform Infrared Spectroscopy. Food Measure. 2014, 8, 336–342. DOI: 10.1007/s11694-014-9194-3.
- Larkin, P.J.;. IR and Raman Spectroscopy: Principles and Spectral Interpretation; Elsevier: Waltham, MA, 2011.
- Guillén, M.D.; Cabo, N. Fourier Transform Infrared Spectral Data versus Peroxide and Anisidine Values to Determine Oxidative Stability of Edible Oils. Food Chemistry. 2002, 77, 503–510. DOI: 10.1016/S0308-8146(01)00371-5.
- Guillén, M.D.; Cabo, N. Some of the Most Significant Changes in the Fourier Transform Infrared Spectra of Edible Oils under Oxidative Conditions. Journal of the Science of Food and Agriculture. 2000, 80, 2028–2036. DOI: 10.1002/1097-0010(200011)80:14<2028::AID-JSFA713>3.0.CO;2-4.
- Navarra, G.; Cannas, M.; D’Amico, M.; Giacomazza, D.; Militello, V.; Vaccaro, L.; Leone, M. Thermal Oxidative Process in Extra-Virgin Olive Oils Studied by FTIR, Rheology and Time-Resolved Luminescence. Food Chemistry. 2010, 126, 1226–1231. DOI: 10.1016/j.foodchem.2010.12.010.
- van de Voort, F.R.; Ismail, A.A.; Sedman, J.; Emo, G. Monitoring the Oxidation of Edible Oils by Fourier Transform Infrared Spectroscopy. Journal of the American Oil Chemists’ Society. 1994, 71(3), 243–253. DOI: 10.1007/BF02638049.
- Riera, J.B.; Codony, R. Recycled Cooking Oils: Assessment of Risks for Public Health. 2000. Retrieved from http://nehrc.nhri.org.tw/toxic/news/1030905-3.pdf
- Sim, S.F.; Lee, T.Z.E.; Nurul Aida, L.M.I.L.; Samling, B. Synchronized Analysis of FTIR Spectra and GCMS Chromatograms for Evaluation of the Thermally Degraded Vegetable Oils. Journal of Analytical Methods in Chemistry. 2014, 1–9. DOI: 10.1155/2014/271970.
- Rohman, A.; Riyanto, S.; Sasi, A.M.; Mohd Yusof, F. The Use of FTIR Spectroscopy in Combination with Chemometric for the Authentication of Red Fruit (Pandanus conoideus Lam) Oil from Sunflower and Palm Oils. Food Bioscience. 2014, 7, 64–70. DOI: 10.1016/j.fbio.2014.05.007.
- Wu, Z.; Li, H.; Tu, D. Application of Fourier Transformed Infrared (FT-IR) Spectroscopy Combined with Chemometrics for Analysis of Rapeseed Oil Adulterated with Refining and Purifying Waste Cooking Oil. Food Analytical Method. 2015, 8(10), 2581–2587. DOI: 10.1007/s12161-015-0149-z.