
ABSTRACT
In an attempt to reduce the salt intake from bread consumption while maintaining acceptable sensory bread characteristics, three treatments (NaCl, Ag-NaCl, and NaCl-KCl) each having five different salt levels were used to formulate fifteen versions of white pita bread. Results showed that decreasing salt levels significantly lowered dough stability and time to breakdown and increased the mixing tolerance index. Bread acceptability was independent of salt content; however, ratings on the Just-About-Right scale showed 0.9% NaCl as optimal salt level in bread. Breads with lower salt content had higher ratings for sweetness, yeasty odour, and flavour with decreased saltiness perception. Amount of 0.67% Ag-NaCl and 1.13% NaCl-KCl were needed to achieve an equivalent saltiness to 0.9% NaCl, suggesting a respective 25.6% and 12.1% sodium reduction without compromising taste. Results suggested that a 60% sodium reduction in white pita bread was achieved with acceptable mixing and sensory characteristics.
Introduction
The evidence between excessive dietary sodium consumption and development of chronic diseases such as hypertension and cardiovascular diseases is widely accepted.[Citation1,Citation2] Populations around the world consume much more sodium than is physiologically necessary. In developed countries, average daily salt intake ranges between 7.5 and 11.5 g[Citation3], exceeding the recommended level of 5–6g/day.[Citation4] Likewise, salt intake levels per person per day amount to 7.8 g in Canada, 8.4 g in France, 8.6 g in the US, 9.5 g in the UK, and 12 g in China.[Citation5] Similarly, sodium intake exceeded optimal levels of <2000 mg/day in all Arab countries, and high systolic blood pressure was the leading risk factor for cardio-metabolic diseases deaths in these countries.[Citation6] In Lebanon, an increasing trend in the prevalence of hypertension was reported, reaching an alarming rate of 36.9%.[Citation7] Most studies confirm the positive effect of a low salt diet on reducing hypertension.[Citation8] Therefore, any reduction in salt level in foods could provide an opportunity to positively impact populations’ health and decrease hypertension prevalence.[Citation5] In high and middle-income societies, processed foods contribute to 75% of dietary sodium, as salt enhances flavour and extends shelf-life of these food products.[Citation9,Citation10] A better indicator of sodium ingestion is the frequency of consumption of foods high in sodium; and in many societies, bread is one of the major contributors to dietary sodium. Although bread may not contain high amounts of sodium, its major contribution to salt intake is due to its characteristic as a widely consumed staple food.[Citation11,Citation12] In Lebanon, processed foods contribute to about 72% of the average daily salt intake, of which 25% is provided from bread- and dough-based foods.[Citation13] Pita bread, also known as Arabic bread, is a two-layered type of round or oval flat baked dough, made using slightly leavened wheat.[Citation15] Arabic bread takes part of almost every meal in the Lebanese diet, and represents around 35% of the total average caloric intake per day.[Citation16] Reducing sodium content of bread is challenging as a major cut back could negatively impact the product [Citation10], especially its taste, an essential determinant of food choice and consumption, whereby a drop in flavour could result in unpalatability.[Citation14] Sodium chloride (NaCl) fulfils various important rheological, technological, and sensory properties in bread manufacturing. It imparts flavour, controls yeast growth and fermentation rate, improves product’s texture and reduces physical and microbiological spoilage.[Citation17,Citation18]
A successful approach for lowering sodium content in bread consists of slowly adapting consumers’ preference for less salty taste.[Citation10] A gradual sodium reduction of 25% in bread was achievable without affecting consumer acceptability[Citation11], and a reduction of 30% did not impact sensory properties of bread.[Citation19] This method adapts people to reduce their liking of very salty foods.[Citation20] However, there is a point where further reductions will become noticeable, and this process, although efficient, is lengthy. Consequently, other alternatives have been proposed to lower sodium levels while sustaining perception to saltiness. A partial substitution of NaCl with other mineral salts that do not contain sodium is commonly implemented; however, these salts were shown to affect wheat dough and bread characteristics differently. Potassium chloride (KCl) is one of the most popular salt replacers used in bread. However, its main disadvantage is the unpalatability resulting from high concentrations use, causing an undesirable bitter and metallic after-taste.[Citation20] Additionally, agglomerated NaCl (Ag-NaCl) is another salt with the ability to increase perception to saltiness. Ag-NaCl microspheres are NaCl crystals that are spray-dried and transformed into hollow crystalline microspheres of smaller particle size and density. It is claimed to be a salt-reducing ingredient that provides a clean salty taste. Ag-NaCl could, in principle, reduce Na levels up to 25–50% in many products without compromising flavour.[Citation21]
In an effort to reduce the salt intake resulting from the consumption of the highly popular bread products in Lebanon, this study aimed at determining the equivalent amount of salt replacers needed to induce the same degree of “ideal” saltiness provided by NaCl. The influence of three types of salt of different concentrations on the empirical rheological properties of wheat dough and its resulting sensory properties was investigated in white pita bread.
Materials and methods
White pita bread processing
White pita bread samples were produced as described by Toufeili et al.[Citation22] The experimental bread formulation consisted of 1000 g of wheat flour, 560 g of water, 30 g of sugar, 10 g of yeast, and 15 g of salt. Ingredients were mixed for 15 min in a dough mixer (0016, Solarco Equipment, Beirut, Lebanon) until a smooth and continuous dough was obtained. The dough was sprinkled with flour, covered with a damp cloth and placed in an incubator for 15 min (GCA Corporation, Bedford, Pennsylvania) at 40°C The dough was then cut, rounded into small balls (40 g) and fermented for another 30 min under the same conditions. Sheeting and proofing of the dough at 40°C for 15 min preceded the baking step, which was done using a conveyor Pita bread oven (TOS, Bramco SARL, Choueifat, Lebanon) set at a temperature of 500°C.[Citation22] The bread loaves were baked for about 50 to 55 s, i.e., until an optimal golden-brown colour was obtained.[Citation22] Three types of food-grade salts (commercial NaCl, KCl, and Ag-NaCl) were added at five different levels (0.3%, 0.6%, 0.9%, 1.2%, and 1.5%) based on a weight by weight (wt/wt) flour basis to result in a total of fifteen different formulations. A 30% NaCl substitution was used for the KCl treatment based on previous research.[Citation23] Samples were cooled to room temperature, placed in polyethylene bags and stored at – 18°C until all analyses were performed. It should be noted that the bread formulations were not repeated. Only one experimental batch of bread loaves was considered for analyses.
Chemical analysis & empirical rheology of dough
Chemical determinations of bread samples were conducted in triplicates for moisture, sodium, and potassium. Sodium and potassium contents were determined by Atomic Absorption Spectrophotometry as given in the AACC Method 40–71. The moisture content of the flour was obtained using the procedure suggested by AACC official method 44–15.02, whereby the flour’s weight used in the farinograph was standardized to 300 g based on 14% moisture content. Mixing properties of doughs resulting from unified flour (Protein 10.36%, 78–80% extraction, Ash 0.59%) and containing five levels of salt (0%, 0.3%, 0.6%, 0.9%, 1.2%, and 1.5% wt/wt on a flour basis) for all three types were recorded in duplicates using the Brabender farinograph and following the constant flour weight procedure as described by the AACC official method 54–21[Citation24–Citation26]
Hedonic evaluation
A consumer acceptability test was conducted on all bread samples with a sample of seventy-two panellists (27 males and 45 females between 18 and 40 years of age) recruited from the American University of Beirut (AUB), as described in Srour et al.[Citation27] Panellists were recruited by a direct approach, whereby they were asked to participate in the acceptability test depending on their willingness to take part in the study and the frequency at which they consume Arabic bread. Participants who were not familiar with the product were excluded from the study. Participants attended three evaluation sessions over a period of three days, during which they assessed a total of fifteen samples (three types × five levels) with five samples served at each session.
Bread samples were sliced into uniform rectangular pieces (5 x 2 cm) and consisted of two layers. These samples were placed in 50 closed transparent sensory plastic cups, each labelled with a three-digit random number. Samples were prepared a day prior to serving and stored at 4°C in a refrigerator. On the day of evaluation, samples were taken out of the refrigerator 15 min prior to the test. The sample sequence was randomized and counterbalanced. Compusense-at hand® sensory evaluation software was used in the evaluation.
Panellists rated the bread samples according to overall acceptability, appearance, colour, odour, taste, saltiness, and texture on the nine-point hedonic scale. A just-about-right (JAR) scale was also administered to get an indication about how the panellists felt about the saltiness of the samples. This was done using a seven-point scale, whereby one indicated “too low” saltiness, four signified “just-about-right” saltiness and seven suggested “too high” saltiness.
Descriptive analysis
Descriptive Analysis was conducted to characterize the differences between bread samples as described in Srour et al. [Citation27] The panel was composed of twelve female judges (21–36 years) recruited from AUB, who were familiar with white pita bread and its sensory characteristics. Participants were trained over six one-hour long sessions, during which a fifteen-cm line scale descriptive ballot was developed consisting of sixteen attributes along with their definitions, anchor words, and reference standards (). Panellists also attended nine evaluation sessions (20 min each) over a period of five days, with daily sessions separated by a minimum of three hours to prevent sensory fatigue. Sample sequence was randomized and counterbalanced, and bread samples were assessed in triplicates over nine sessions, i.e., forty-five evaluations [three types of salt × five levels of salt × three replicates], with five different samples served at each session.
Determination of equivalent saltiness by magnitude estimation
The salting potency of the different types of salt was assessed by determining their equivalent saltiness relative to NaCl using the magnitude estimation method. The panel consisted of ten female judges (21–36 years) recruited from AUB using the same inclusion criteria as in the descriptive analysis and trained over five one-hour long sessions to develop their quantitative skills. Panellists attended six evaluation sessions (15 min each) over three days. Samples were assessed in duplicates over six sessions, i.e., thirty evaluations [three types × five levels × two replicates] with five different samples served at each session. Judges were instructed to numerically rate the saltiness of the experimental bread samples with respect to a reference sample having a value of 100 (0.9% NaCl). As such, a sample perceived to be twice as salty as the reference would take a rating of 200, while one perceived to be half as salty would take a rating of 50. The “Power Function” was obtained for all levels of NaCl, NaCl-KCl, and agglomerated NaCl, defined as:
S = a.Cn
where S is the sensation perceived, C the concentration of the stimulus, a the antilog of the y-intercept and n the slope of the linear function.
Statistical analysis
Analysis of variance using the GLM procedure of SPSS statistics for windows software (version 23, IBM Corporation, Armonk, NY, USA) was performed. In the model for descriptive analysis, the response variable was the sensory attribute. Factors in the model were type of salt, level of salt, panellist, replicate, and their two-way interactions. The panellist effect was considered as a random effect, whereas the type, level and replicate effects were fixed effects. Means were separated by Tukey’s honestly significant difference test. Significance was established at α < 0.05. The principal component analysis was performed, as described in Srour et al.[Citation27], to extract the main factors that summarize several sensory attributes, using the thirty means from descriptive analysis. This analysis was performed using the SAS® (version 8.02; SAS Institute, Cary, NC, USA) statistical software.
Results and discussion
Chemical analysis
summarises the least squares means of the chemical analyses performed on the white pita bread samples. These results confirm and support the salt levels added during processing. As expected, at the same levels, bread samples prepared with Ag-NaCl contain more sodium than samples prepared with NaCl or NaCl-KCl. Breads prepared with NaCl and Ag-NaCl provide on average 1.8 g kg−1 of potassium regardless of the salt level, while they would supply 3.0 g kg−1 when a 30% sodium substitution with KCl is implemented.
Table 1. Terms used in the descriptive analysis of white pita bread.
Table 2. Sodium, potassium, and moisture contents of the experimental white pita bread samples.
Empirical rheology of dough
The results of the mixing properties of dough recorded by the farinograph are displayed in Table S1. Dough mixed with 30% substituted KCl had a significantly lower water absorption (WA) than the two other treatments which showed no differences between each other. Similar results were reported in the literature when a 25% KCl replacement was implemented.[Citation28] In our study, stability was significantly higher in the dough mixed with Ag-NaCl than the dough containing KCl, but no differences were observed between dough with NaCl and NaCl-KCl. In agreement with Kaur et al.[Citation28], development time, time to break down (TTB) and mixing tolerance index (MTI) did not differ significantly between the salts. Dough with 0.3% salt obtained the highest WA value and was significantly different from dough containing 0.9%, 1.2% and 1.5% salt. This is consistent with other findings showing that decreasing salt levels from 4% to 0% significantly increased WA.[Citation20] Moreover, an addition of 1.5% NaCl to flour (wt/wt) was shown to decrease WA by 1.4%.[Citation29] Adding salt to the dough seems to increase protein association by the means of ionic, hydrophobic, and hydrogen bonds that cause a decrease in WA.[Citation18] It is widely accepted that addition of salt (at 1.2% and 1.5%) increases dough stability[Citation20–Citation29]. Salt-reduced doughs tend to be relatively firm at the beginning of the mixing process, but can easily become over-mixed, resulting in a less stable and weak dough. In addition, TTB and MTI are directly related to added salt levels and dough stability. Our results showed that 1.5% salt level significantly increased TTB of dough when compared with 0.6% and 0.3% salt levels which obtained significantly higher values on MTI, an indication of the degree of softening during mixing. Salt enhances the strength of the dough, and the mixing time can last longer with minimal degradation of the gluten structure. When the stability is low, the dough will start to break down early and will lead to a higher degree of softening.[Citation31] Generally, dough with low MTI is known to possess good tolerance towards mixing. However, even with the addition of salt, the obtained dough was weak, probably due to the medium protein quality of the flour typically used in pita bread processing. Unlike the results obtained in other studies[Citation29], neither type nor level of salt induced any changes in the dough development time. According to Belz et al.[Citation18], increasing salt levels caused less water to be available for the development of the gluten network, thereby increasing dough development time.
Hedonic evaluation
summarises the least squares means of the consumer acceptability test for the type × level interaction. Bread produced with 0.9% NaCl and 1.2% Ag-NaCl received the highest acceptability ratings for all attributes, showing no difference between each other. Samples with 0.9% NaCl and 1.2% Ag-NaCl were significantly different from those with 0.3% and 0.6% NaCl-KCl on all acceptability variables and different from 0.3% Ag-NaCl on all attributes except for odour and colour. Overall, no major differences were observed between appearance, odour, and colour except for low salt levels of the KCl treatment. Interestingly, reducing NaCl levels in the NaCl treatment from 1.5% to 0.3% did not affect consumer acceptability of bread samples on all attributes. Moreover, reducing NaCl levels from 1.2% to 0.6% had no significant effect on the liking of bread flavour, but a further reduction has been shown to significantly influence it as reported by other studies.[Citation30] On the other hand, bread with 0.4% NaCl still showed acceptable sensory properties.[Citation18] Other studies assessed consumer acceptability and purchase intent of 25% and 30% reduced-Na bread and reported no impact of these reductions on overall acceptability, colour, flavour, and texture acceptability, even when compared with control bread.[Citation11, Citation19–Citation32] However, these studies did not show how further reductions would affect consumer liking of bread. An assessment of sodium in breads from bakeries across Lebanon showed fluctuations in salt levels of white pita bread ranging from 0.19% to 2.72%, with an average of 1.3%. These findings suggest that white pita bread consumers may be used to consuming bread with a very wide range of salt levels. Around 24% of our participants frequently consumed white pita bread from Bakery A (average NaCl level of 0.2% in above study) and 50% from Bakery B (average NaCl level of 0.92%), which could explain why the 0.9% NaCl treatment received the highest acceptability ratings. It is worth mentioning that bakery B enjoys a large market share, thus indicating a good reflection of market segmentation in our consumer/panellists sample. Decreasing salt levels from a level of 1.5% for each type of salt affects saltiness acceptability of the bread samples for low levels only. As a matter of fact, there seems to be a decreasing trend in the liking of bread with reduced salt levels although not significantly different, except for samples produced with 0.3% and 0.6% NaCl-KCl and 0.3% Ag-NaCl. Girgis et al.[Citation11] reported a progressive trend towards lower acceptability ratings for Na-reduced bread when compared with control bread.[Citation11] However, this observed trend was not significant and was applicable for 25% Na-reduced bread, unlike the present work. In general, there does not seem to be a universal consensus or sufficient evidence on the amount of sodium to reduce in bread without affecting taste, consumer acceptability, and purchase intent. It is, therefore, necessary to assess a population’s socio-demographic, economic, cultural, and dietary characteristics before implementing a sodium reduction strategy for bread.
Table 3. Least squares means of the acceptability scores of white pita samples for the type × level interaction.
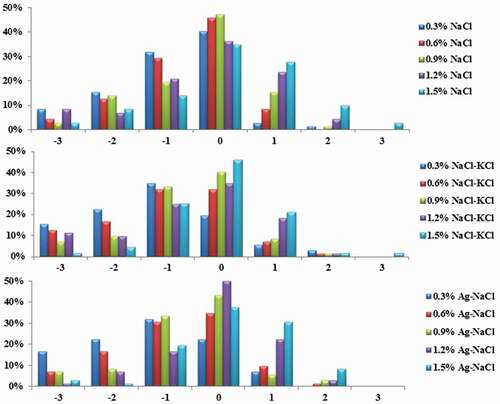
The JAR scale ratings for the different samples on saltiness are illustrated in . High proportions of ratings in the −1 to + 1 range indicate an optimal level of taste intensity relative to the liking of panellists, while a high percentage of lower and upper ratings indicates low or high intensity relative to the liking of taste, respectively. Bread with 0.9% NaCl, 1.5% NaCl-KCl and 1.2% Ag-NaCl seem to be the best samples, as evident by the highest percentage of subjects who found those samples to have the optimal salty taste to their liking. Samples with 0.3% and 0.6% of all three types of salt seemed to have a tilt for higher percentages of participants who gave lower ratings for saltiness, while the opposite was true for 1.2% NaCl, 1.5% NaCl and 1.5% Ag-NaCl. The present results support those of saltiness liking and the acceptability ratings. They are also contradictory since the saltiness intensity of Ag-NaCl should, in theory, be higher than that of regular NaCl for the same percentage, as expected from this type of salt (Ag-NaCl) that should deliver a higher saltiness for the same percentage. When replacing NaCl with Ag-NaCl at the same salt level in pizza crust, no differences in saltiness were observed, due to a possible loss of functionality during processing.[Citation21] Bread samples produced with high and intermediate salt levels, namely 1.5% for all three treatments, 1.2% NaCl-KCl and Ag-NaCl treatments as well as 0.9% NaCl were significantly different form breads containing low salt levels, i.e., 0.3% and 0.6% NaCl-KCl and 0.3% Ag-NaCl. However, JAR scaling poses several challenges that might have affected our findings and resulted in biases, namely: incorporating consumer acceptability and measurement of attribute intensity at the same time[Citation33]; accounting for three main factors – perception of attribute intensity, finding of ideal point on the scale and comparison of the difference between intensity and ideal point[Citation34]; assuming that a participant has an optimal level of saltiness in bread which may not be relevant if he/she is truly indifferent to variations in saltiness in the product; effect of sample portion size on attribute rating[Citation35]; and sensory fatigue and carry-over effects in participants.
Figure 1. Just-About-Right (JAR) ratings for saltiness for white pita bread samples produced with NaCl (A), NaCl-KCl (B), and Ag-NaCl (C); −3: Too Little, 0: Just-About-Right, 3: Too Much.
Descriptive analysis
summarises the least squares means of the descriptive analysis for type and level of salt. Bread produced with 30% substituted KCl obtained the highest ratings for smoothness of surface, yeasty odour, rollability, and yeasty flavour. Breads containing Ag-NaCl were significantly different from those with NaCl for rollability only, and were perceived as the saltiest of all treatments. Bread with 0.6% salt was significantly darker in colour than bread containing 0.9% and 0.3% salt. However, there is a decreasing trend with decreasing salt levels, except for 0.6%. A WA above 57% has been shown to result in the formation of sticky dough and breads that were most likely to have a light crust colour upon baking [Citation36], while WA of 55% has been shown to result in an optimal baking consistency. Furthermore, bread with decreasing salt levels has a lighter coloured crust due to the decreased Maillard reaction that can be attributed to the reduced amount of free sugars available because of a lower yeast activity.[Citation18] Experimental bread samples have moisture contents ranging from 24.1% to 29.6% due to the challenge of obtaining narrow moisture level margins with the different salt levels. The analysis showed that bread samples receiving high colour ratings were lower in moisture than samples with low colour ratings. Bread prepared with 1.5% added salt had a significantly saltier taste and aftertaste than the rest of the samples. These results indicated that bread samples produced with Ag-NaCl were perceived as saltier than breads produced with either NaCl or NaCl-KCl for the same levels. Both samples with 1.5% and 0.6% salt had a smoother surface than samples with 0.3% salt. Reducing the salt content yields very sticky dough that is difficult to handle and sheet, resulting in bumpy surfaces.[Citation36] Salt added at 1.5%, 1.2%, and 0.6% produced bread that was significantly more rollable than the 0.9% level which received the lowest score. One would expect that low salt levels should negatively impact the ability of bread sample to fold and roll. However, the sample with the lowest salt level was not different from the other treatments with regard to this attribute. The percentage of salt in the formulation does not seem to have a major impact on rollability; variations might be rather due to differences in baking conditions, such as unevenness in dough thickness and oven temperature below 600°C.[Citation36] Interestingly, none of the texture attributes were significant for both type and level of salt, explaining the lack of major differences in the liking of texture in the acceptability test. Bread samples produced with 0.3% and 0.6% salt were significantly sweeter than all samples, as sodium in low concentrations enhances the sweetness of amino acids glycine, alanine and serine[Citation18–Citation37]
Table 4. Least squares means of descriptive sensory attributes for type and level for white pita bread samples.
Principal components analysis
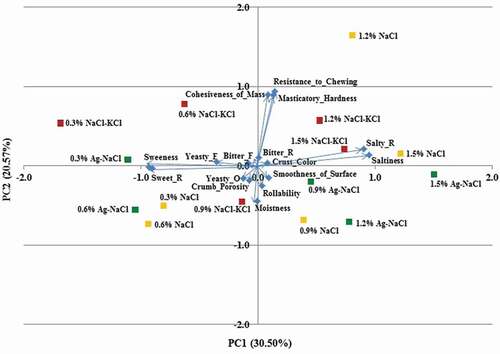
illustrates the principal component (PC) analysis for the first two components which explained 51.07% of the variation in the scores for the sensory attributes, with PC1 and PC2 accounting for 30.50% and 20.57%, respectively. PC1 separated the attributes based on salt level. The positive side of PC1 included eight bread samples prepared with high and intermediate salt levels (1.5% and 1.2% for all three types of salt and 0.9% NaCl and Ag-NaCl). These samples were mostly defined by the appearance and texture attributes, saltiness and salty residual and bitter aftertaste. The negative side of PC1 included seven bread samples of low and intermediate salt levels (0.9% NaCl-KCl, 0.6% and 0.3% for all three types of salt). These samples were characterized by eight attributes: moistness, crumb porosity, yeasty odour and flavour, sweetness and sweet residual, bitterness and bitter residual. However, the coordinates of moistness, bitter residual, cohesiveness of mass, resistance to chewing, masticatory hardness, and rollability lay on the border of both sides, therefore characterising all bread samples. These results clearly show the impact of salt levels on the taste and flavour characteristics of bread samples. Adding salt to bread increases the perception of saltiness, whereas its reduction increases the perception of yeasty odour and flavour, sweetness, and bitterness. PC2 separated the attributes based on the type of salt. The positive side of PC2 mainly included four bread samples produced with NaCl-KCl (high and low levels) as well as two samples produced with NaCl (1.5% and 1.2%) and one sample with Ag-NaCl (0.3%). These were characterized by the flavour and aftertaste attributes, crust colour, cohesiveness of mass, resistance to chewing, and masticatory hardness. The negative side of PC2 mainly included four samples produced with Ag-NaCl (high and intermediate levels), three samples produced with NaCl (intermediate and low levels) and the 0.9% NaCl-KCl treatment. These samples were defined by smoothness of surface, rollability, moistness, crumb porosity, yeasty odour, and sweetness (taste and residual). The coordinates sweetness, yeasty, bitterness, and saltiness lay on the border of both sides of PC2, therefore characterizing all samples. This also suggests that the type of salt used does not affect the taste attributes like the level of salt does.
Figure 2. Principal components plot of white pita samples and sensory attributes. F = Flavour; O = Odour; M = Mouthfeel; R = Residual.
Determination of equivalent saltiness by magnitude estimation
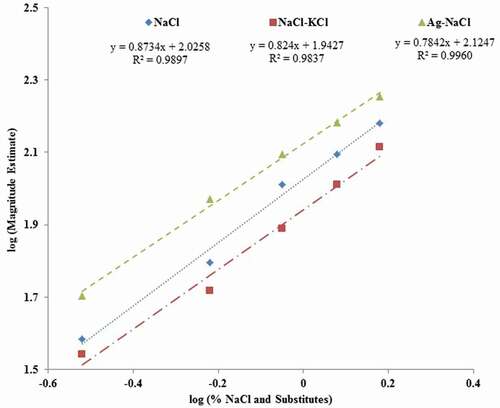
Table S2 summarises the power function obtained for NaCl and NaCl substitutes from which the equivalent amount of saltiness required to provide the same salty taste as 0.9% NaCl in white pita bread was determined. The lowest substitute concentration in white pita bread when compared with 0.9% NaCl was observed for Ag-NaCl (0.67%) followed by NaCl-KCl (1.3%), showing both substitutes were viable in white pita bread. As illustrated in , substituting NaCl with 30% KCl lowers the salting power when compared to Ag-NaCl, since a higher level of NaCl-KCl is required to provide the same saltiness intensity. These results also confirm the enhancing effect of the microcrystalline structures of Ag-NaCl in bread that provide an increased surface area to volume of the salt particles and support the panelists’ ratings observed in descriptive analysis. The lower potency of non-Na substitutes compared with NaCl suggest that 75% of the salty taste perceived in food products is attributed to the Na cation.[Citation37–Citation38] The average daily intake of bread in the adult Lebanese population accounts for approximately 136.8g/day providing around 1.78 g salt per day.[Citation14] Since the optimal NaCl level in white pita bread is 0.9%, there would be a contribution of 1.01 g of salt/day from bread in the Lebanese diet. Bread prepared with 0.68% Ag-NaCl and 1.13% NaCl-KCl would, respectively, provide 0.73 and 0.9 g of salt/day, therefore achieving 25.6% and 12.1% sodium reduction, respectively, for the same saltiness perception. This indicates an interesting Na reduction strategy, since using Ag-NaCl as a salt substitute could not only cut down on sodium, but also prevent the loss of flavour that usually occurs in bread.
Figure 3. Results of the linear power function in white pita samples produced with NaCl (blue), NaCl-KCl (red) and Ag-NaCl (green).
Conclusion
The results of this study indicated that reducing salt content from 1.5% to 0.6% in bread is achievable. Although there was a perceived difference in saltiness between 0.6% and higher levels, sensory evaluation tests revealed no major differences in texture, which remained acceptable to consumers. Ag-NaCl seems to be an effective salt substitute to NaCl since it has the ability to both prevent loss of flavour and reduce sodium content in bread. It is preferable not to recommend substituting NaCl with high KCl levels since large quantities of potassium may not be suitable for everyone.
Acknowledgments
The authors would like to thank Sibelle El Labban, Nour Chaaban, Soha Abi Raad, Elisa Samaha, Lama Abi Mosleh, and Lorène Georges for their technical assistance and Caroline Rajeh and Myra Zeineddine for their research contribution. Funding by the University Research Board and the Vascular Medicine Group, Faculty of Medicine, AUB is gratefully acknowledged. The authors declare that there is no conflict of interest regarding the publication of this article.
References
- Adrogué, H. J.; Madias, N. E. Sodium and Potassium in the Pathogenesis of Hypertension. N. Engl. J. Med. 2007, 356(19), 1966–1978. DOI: 10.1056/NEJMra064486.
- He, F. J.; MacGregor, G. A. Reducing Population Salt Intake Worldwide: From Evidence to Implementation. Prog Cardiovasc Dis. 2010, 52(5), 363–382.
- Ha, S. K.;. Dietary Salt Intake and Hypertension. Electrolytes & Blood Pressure. 2014, 12(1), 7–18.
- World Health Organization (WHO). Diet, Nutrition and the Prevention of Chronic Diseases. Report of Joint WHO/FAO Expert Consultation. World Health Organ Tech Rep Ser. 2003, 916, 100–149.
- Webster, J. L.; Dunford, E. K.; Hawkes, C.; Neal, B. C. Salt Reduction Initiatives around the World. J. Hypertens. 2011, 29(6), 1043–1050.
- Afshin, A.;Micha, R.; Khatibzadeh, S.; Fahimi, S.; Shi, P.; Powles,J., ... & Farzadfar, F. The Impact of Dietary Habits and Metabolic Risk Factors on Cardiovascular and Diabetes Mortality in Countries of the Middle East and North Africa in 2010: A Comparative Risk Assessment Analysis. Br. Med. J. Open. 2015.
- Mehio Sibai, A.; Nasreddine, L.; Mokdad, A. H.; Adra, N.; Tabet, M.; Hwalla, N. Nutrition Transition and Cardiovascular Disease Risk Factors in Middle East and North Africa Countries: Reviewing the Evidence. Ann. Nutr. Metabolism. 2010, 57, 193–203.
- Aburto, N. J.; Ziolkovska, A.; Hooper, L.; Elliott, P.; Cappuccio, F. P.; Meerpohl, J. J., Effect of Lower Sodium Intake on Health: Systematic Review and Meta-Analyses. Br Med J. 2013, 346, f1326. DOI: 10.1136/bmj.f1326.
- Mattes, R.; Donnelly, D. Relative Contributions of Dietary Sodium Sources. J. Am. Coll. Nutr. 1991, 10(4), 383–393.
- Dötsch, M.; Busch, J.; Batenburg, M.; Liem, G.; Tareilus, E.; Mueller, R.; Meijer, G. Strategies to Reduce Sodium Consumption: A Food Industry Perspective. Crit Rev Food Sci Nutr. 2009, 49(6), 841–851.
- Girgis, S.; Neal, B.; Prescott, J.; Prendergast, J.; Dumbrell, S.; Turner, C.; Woodward, M. A One-Quarter Reduction in the Salt Content of Bread Can Be Made without Detection. Eur J Clin Nutr. 2003, 57(4), 616–620. DOI: 10.1038/sj.ejcn.1601583.
- Fischer, P. W.; Vigneault, M.; Huang, R.; Arvaniti, K.; Roach, P. Sodium Food Sources in the Canadian Diet. Applied Physiology. Nutrition, and Metabolism. 2009, 34(5), 884–892.
- Almedawar, M. M.; Nasreddine, L.; Olabi, A.; Hamade, H.; Awad, E.; Toufeili, I.; Arnaout, S.; Isma’eel, H. A. Sodium Intake Reduction Efforts in Lebanon. Cardiovasc. Diagn. Ther. 2015, 5(3), 178–185.
- Breslin, P.; Beauchamp, G. Salt Enhances Flavour by Suppressing Bitterness. Nature. 1997, 387(6633), 563.
- Williams, P.; El-Haramein, F. J.; Nelson, W.; Srivastava, J. P. Evaluation of Wheat Quality for the Baking of Syrian-Type Two-Layered Flat Breads. J. Cereal Sci. 1988, 7(2), 195–207.
- Nasreddine, L.; Hwalla, N.; Sibai, A.; Hamzé, M.; Parent-Massin, D. Food Consumption Patterns in an Adult Urban Population in Beirut, Lebanon. Public Health Nutr. 2006, 9(2), 194–203.
- Beck, M.; Jekle, M.; Becker, T. Sodium Chloride–Sensory, Preserving and Technological Impact on Yeast‐Leavened Products. Int. J. Food Sci. Technol. 2012a, 47(9), 1798–1807.
- Belz, M. C.; Ryan, L. A.; Arendt, E. K. The Impact of Salt Reduction in Bread: A Review. Crit Rev Food Sci Nutr. 2012, 52(6), 514–524.
- La Croix, K. W.; Fiala, S. C.; Colonna, A. E.; Durham, C. A.; Morrissey, M. T.; Drum, D. K.; Kohn, M. A. Consumer Detection and Acceptability of Reduced-Sodium Bread. Public Health Nutr. 2015, 18(8), 1412–1418.
- Beck, M.; Jekle, M.; Becker, T. Impact of Sodium Chloride on Wheat Flour Dough for Yeast‐Leavened Products. I. Rheological Attributes. Journal of the Science of Food and Agriculture. 2012b, 92(3), 585–592.
- Mueller, E.; Koehler, P.; Scherf, K. A. Applicability of Salt Reduction Strategies in Pizza Crust. Food Chem. 2016, 192, 1116–1123.
- Toufeili, I.; Ismail, B.; Shadarevian, S.; Baalbaki, R.; Khatkar, B.; Bell, A.; Schofield, J. D. The Role of Gluten Proteins in the Baking of Arabic Bread. J. Cereal Sci. 1999, 30(3), 255–265.
- Charlton, K. E.; MacGregor, E.; Vorster, N. H.; Levitt, N. S.; Steyn, K. Partial Replacement of NaCl Can Be Achieved with Potassium, Magnesium and Calcium Salts in Brown Bread. Int. J. Food Sci. Nutr. 2007, 58(7), 508–521.
- AACC International Approved Methods of Analysis. 11th Ed. Method 40-71.01. Sodium and Potassium by Atomic Absorption Spectrophotometry; Approved November 3, 1999a AACC International:St. Paul, MN, U.S.A., 1999a.
- AACC International Approved Methods of Analysis. 11th Ed. Method 44-15.02. Moisture Air-Oven Methods; Approved November 3, 1999b AACC International:St. Paul, MN, U.S.A, 1999b.
- AACC International Approved Methods of Analysis . 11th Ed. Method 54-21.02. Rheological Behavior of Flour by Farinograph: Constant Flour Weight Procedure; Approved November 3, 1999c AACC International:St. Paul, MN, U.S.A, 1999c.
- Srour, N.; Daroub, H.; Toufeili, I.; Olabi, A. Developing a Carob‐Based Milk Beverage Using Different Varieties of Carob Pods and Two Roasting Treatments and Assessing Their Effect on Quality Characteristics. J. Sci. Food Agric. 2016, 96(9), 3047–3057.
- Kaur, A.; Bala, R.; Singh, B.; Rehal, J. Effect of Replacement of Sodium Chloride with Mineral Salts on Rheological Characteristics of Wheat Flour. Am. J. Food Technol. 2011, 6(8), 674–684.
- Farahnaky, A.; Hill, S. The Effect of Salt, Water and Temperature on Wheat Dough Rheology. J Texture Stud. 2007, 38(4), 499–510.
- Lynch, E.; Dal Bello, F.; Sheehan, E.; Cashman, K.; Arendt, E. Fundamental Studies on the Reduction of Salt on Dough and Bread Characteristics. Food Res. Int. 2009, 42(7), 885–891.
- Bassett, M. N.; Pérez-Palacios, T.; Cipriano, I.; Cardoso, P.; Ferreira, I. M.; Samman, N.; Pinho, O. Development of Bread with NaCl Reduction and Calcium Fortification: Study of Its Quality Characteristics. J Food Qual. 2014, 37(2), 107–116.
- Brinsden, H. C.; He, F. J.; Jenner, K. H.; MacGregor, G. A. Surveys of the Salt Content in UK Bread: Progress Made and Further Reductions Possible. Br. Med. J. Open. 2013, 3(6), e002936. DOI: 10.1136/bmjopen-2013-002936.
- Moskowitz, H. R.; Muñoz, A. M.; Gacula, M. C., Jr. Viewpoints and Controversies in Sensory Science and Consumer Product Testing; John Wiley & Sons, Blackwell, 2008.
- Li, B.; Hayes, J. E.; Ziegler, G. R. Just-About-Right and Ideal Scaling Provide Similar Insights into the Influence of Sensory Attributes on Liking. Food Qual Prefer. 2014, 37, 71–78.
- Lawless, H. T.; Heymann, H. Sensory Evaluation of Food: Principles and Practices; Springer-Verlag: New York, 2010.
- Qarooni, J.;. Flat Bread Technology; Springer US, 1996; 67–119.
- Liem, D. G.; Miremadi, F.; Keast, R. S. Reducing Sodium in Foods: The Effect on Flavor. Nutrients. 2011, 3(6), 694–711.
- Silva, T. L.; Souza, V. R.; Pinheiro, A.; Nunes, C. A.; Freire, T. V. Equivalence Salting and Temporal Dominance of Sensations Analysis for Different Sodium Chloride Substitutes in Cream Cheese. Int. J. Dairy Technol.. 2014, 67(1), 31–38.