
 ?Mathematical formulae have been encoded as MathML and are displayed in this HTML version using MathJax in order to improve their display. Uncheck the box to turn MathJax off. This feature requires Javascript. Click on a formula to zoom.
ABSTRACT
Currently, edible walnuts are either eaten fresh or being processed as walnut oil. However, the walnut dregs produced after the oil is pressed from the walnuts cannot be used for comprehensive utilization. Instead, they are often used as animal feed after simple treatment or directly used as waste landfill. The walnut dregs contain >20% of high-quality plant protein. Walnut protein consists of gluten, prolamin, albumin, and globulin. Poor function of walnut protein has been reported. Therefore, the gluten in walnut cake protein was modified by enzymatic method and the microstructure of walnut protein was changed, thereby improving the functional properties of walnut protein. It is generally believed that walnut protein modified by enzymatic method might be more suitable for industrial production. Our study showed that the modified walnut glutelin (WG) increased the solubility by ~1.33 times, the water holding capacity by ~0.23 times, the emulsifiability by ~0.32 times, and the emulsion stability by ~0.75 times. The oiliness was slightly lowered and the foaming characteristics were not greatly changed. Therefore, our study concluded that the microscopic structure of the protein had undergone certain changes based on the spectrum and electron microscopy. The modification of the microstructure also provides a theoretical basis for the comprehensive utilization of walnut protein, which could broaden the application of walnut protein in the industrial food production.
Introduction
Since 1950s, many food researchers have started to modify the vegetable protein by physical, chemical, enzymatic, and genetic modification methods. The modification treatment can change the structure of the vegetable protein to prepare a protein with specific functional properties or nutritional value to meet the needs of food industrialization development.[Citation1] For the change of protein structure and functional characteristics[Citation2], enzymatic method has the advantages of mild reaction and easy operation.[Citation3] The hydrophobic group outside the walnut protein is strong, and the enzymatic hydrolysis can gradually expose the deep hydrophilic group. When the protein is gradually unfolded from the curled state, hydrogen bonding, disulfide bond cleavage. These are proteins or peptides that are modified to remove the corresponding groups, thereby improving the functional properties of the protein.[Citation4] The deamidation group studies using enzymatic methods are mostly investigated from the reaction temperature, reaction time, pH and enzyme dosage. Enzymatic modification of proteins can be achieved by deamidation or when the protein is enzymatically modified to produce parts of the polypeptide. The hydrolysis of the peptide bond in the polypeptide is double-sided, and the exposure of amino acid residues such as glutamic acid and aspartic acid improves the amphipathic property of the internal structure of the protein. This improvement has also directly or indirectly affected other functional properties such as protein emulsification and foaming.[Citation5]
Currently, there are many studies on plant proteins such as soybean, rice, and peanut, but limited research studies have been reported on walnut protein (gluten). Walnut protein is rich in gluten and prolamin, which makes it poor functional properties and not widely used in the food industry. Using walnut meal as raw material and walnut glutelin (WG) as the main research object, the enzymes with limited enzymatic hydrolysis were screened by reaction temperature, reaction time and enzyme dosage factors. Nitrogen solubility index (NSI) and the degree of hydrolysis (DH) were used as indicators to evaluate the response surface. The central combination experimental design was employed in our study and the modification of walnut gluten by enzyme would be analyzed based on the solubility, functional characteristics and other indicators, while the unmodified WG was used as a control. Our experiments were combined with the spectrogram analysis of modified walnut protein in order to determine the functional characteristics change of WG. The results of our study would then provide theoretical reference guidance for the comprehensive utilization, industrial production and high-quality deep processing of walnut protein.
Materials and methods
Materials and equipment
Materials used were walnut dregs (were obtained after pressing walnut oil in our laboratory) (Xinjiang Zhongya Food Co., Ltd., Xinjiang, China), WG (the Xinjiang Agricultural University, Xinjiang, China), and soybean oil (Xinjiang Friendship Group Co., Ltd., Xinjiang, China)
Reagents used were as follows: papain, alkaline protease, and neutral protease were supplied by Shanghai Yuanye Biotechnology Co., Ltd., Shanghai, China; complex protease, flavor protease, pepsin, trypsin were purchased from Nanning Pangbo Biological Engineering Co., Ltd., Nanning, China, and other reagents were of analytical grade.
Equipment used were as follows: PL203 electronic balance (METTLER TOLEDO Instrument (Shanghai) Co., Ltd., Shanghai, China); DZKW-S-6 electric heating constant temperature water bath (Beijing Yongguangming Medical Instrument Co., Ltd., Beijing, China); TDL-5-A low speed centrifuge (Shanghai Anting Scientific Instrument Factory, Shanghai, China); DHG-9140A electric blast drying oven (Shanghai Yiheng Scientific Instrument Co., Ltd., Shanghai, China); ALPHA 1–2 vacuum freeze dryer (Germany Marin Christ, Germany); RSH-1DR timing constant temperature magnetic stirrer (Shanghai Beilun Instrument Equipment Co., Ltd., Shanghai, China); SENS-9003 fluorescence spectrum analyzer (Beijing Zhuoli Hanguang Instrument Co., Ltd., Beijing,China); TU-1810PC UV-visible spectrophotometer (Beijing Pu Analysis General Instrument Co., Ltd., Beijing, China); and S5500 scanning electron microscope (Hitachi, Japan).
Preparation of WG
After degreasing the walnut dreg, deionized water was added. After the mixture was centrifuged, the supernatant was extracted and the remaining precipitate was added with NaCl. The supernatant was re-extracted after centrifugation. The extract was added with 70% ethanol and NaOH to adjust pH. After centrifugation, the supernatant was added with HCl to adjust the pH to isoelectric point. The extract was washed to neutral pH and vacuum freeze-dried to obtain WG.[Citation6]
Preparation of enzymatically modified WG (CPMP)
WG was added to the preparation solution (protein concentration 6–8%, W/V) followed by stirring and pH was adjusted to 7.0. Enzyme was then added to the mixture under the following conditions: reaction temperature 40°C, reaction time 40 min, enzyme dosage (U/mg) 0.3%. After that, the mixture was placed into a water bath for 10 min at 90°C to deactivate enzymes and allowed to cool. The mixture was washed to neutral pH followed by vacuum freeze-drying to obtain enzymatic modified WG (CPMP).
Protease screening
Papain, alkaline protease, neutral protease, complex protease, flavor protease, pepsin, and trypsin were used to carry out under different reaction temperatures, different pH values, reaction time of 40 min and enzyme dosage of 0.3% (U/mg). The enzyme was dehydrated in a water bath at 90°C for 10 min, and the degree of hydrolysis (DH) was determined after cooling to room temperature. The hydrolyzed product was lyophilized and stored at −20°C for the determination of NSI.
Determination of degree of hydrolysis (DH)
The pH-Stat method was used with some modifications[Citation7], and DH was calculated as in Formula (1): DH (%) = Vc/amhtot x 100, where V is the volume of lye consumed (mL); c is the concentration of alkali (mol/L); α is the degree of dissociation of α-amino group; α = BNb/aMphtot, where PK is the average value of the α-amino group, and the pH is the starting reaction pH value; m is the protein content (g) in the substrate; htot is the total number of peptide bonds in the substrate protein (mmol/g). In this study, WG was taken as htot = 8.0.[Citation6]
Determination of nitrogen solubility index (NSI) (solubility)
The nitrogen solubility index was determined according to the modified methods by Liao et al.[Citation8] A 2 g of the hydrolyzed product was accurately weighted after lyophilization. The product was then dispersed in deionized water and diluted to 50 mL. After shaking at room temperature for 2 h, the mixture was centrifuged at 4500 r/min for 20 min, and a 5 mL of supernatant was taken for measurement. The protein content was determined by the Kjeldahl method. NSI was calculated as in Formula (2): NSI (%) = 10 x (N1/N2) x 100, where NSI is the nitrogen solubility index (%) of the enzymatic hydrolysate; N1 is the soluble nitrogen (mg) in 5 mL of the supernatant; N2 is the total nitrogen (mg) in the 2 g sample.
Single factor enzymatic test
The enzymatic hydrolysis conditions used were: reaction temperature 40°C, reaction time 40 min, and enzyme dosage (U/mg) 0.3%. NSI and DH were used as indicators to select reaction temperatures (i.e. 30°C, 40°C, 50°C, 60°C, and 70°C) and reaction times (i.e. 0, 20, 40, 60, 80, and 100 min). For single factor experiments of 0.1%, 0.2%, 0.3%, 0.4%, and 0.5% enzyme dosages, the effects of various factors on their NSI and DH were investigated. Each sample was measured in triplicate.
Multifactorial enzymatic test
According to the results of single factor test, the protein concentration was set to 6–8%, the pH was 7.0; the reaction temperature (A), reaction time (B) and enzyme dosage (C) were selected as independent variables; and NSI (Y) was used as response value for the response surface optimization experiment. A three-factor three-level response surface analysis experiment was designed. The experimental data were analyzed using Design Expert 8.0.6 software in order to determine the optimal limited enzymatic hydrolysis process.
Fluorescence scanning
The sample was accurately weighed and dissolved in phosphate buffer (pH 7.0) in order to prepare a protein sample at a concentration of 0.2 mg/mL, which was determined based on the literature and equipment used (i.e. between 0.1% and 0.3%). After standing at room temperature for about 3 h, the sample was measured by fluorescence spectroscopy. After taking a four-way quartz cuvette, 5 ml of sample solution was poured into it. The excitation spectrum of the selected fluorescence spectrum was 310 nm; the emission wavelength was 410–460 nm; and the slit was 5 nm. All samples are measured in triplicate.
Ultraviolet scanning
The sample was accurately weighed and dissolved in phosphate buffer (pH 7.0) in order to prepare a protein sample at a concentration of 0.1 mg/mL. After taking a quartz cuvette, 5 mL of sample solution was poured into it. The absorbance of the sample was measured by a spectrophotometer at a wavelength of 200–400 nm.[Citation9]
Scanning electron microscope (SEM)
The microstructure of the sample was observed with a SEM. The original protein and the modified protein were immobilized on the sample stage, and the gold plating thickness of the raw material coating was about 10 nm by the ion sputtering method, and the gold plating conditions were 15 kV, 15 mA, and 1.5 min. The sample was then scanned under a SEM (20 kV) voltage, and its microstructure was observed and a sample image was taken.[Citation10]
Determination of water-holding capacity
Each 0.10 g of WG and modified protein samples were added into a centrifuge tube and 10 mL deionized water was added into the samples. After centrifuging at 4500 r/min for 15 min, the samples and centrifuge tubes were weighed.[Citation11] The water holding capacity was calculated using Formula (3): water holding capacity = (M2-M1)/M0, where M0 is the sample mass (g); M1 is the centrifuge tube and the total mass of the sample (g); M2 is the centrifuge tube and the mass of the precipitate (g).
Determination of oil-holding capacity
Each 0.10 g of WG and modified protein was added into a centrifuge tube and added with 5 mL of soybean oil. After being vortexed for 60 s, the mixture was centrifuged at 3300 r/min for 15 min.[Citation12] The paper was used to remove residual grease, and the oil holding capacity was calculated as in Formula (4): oil holding capacity = (M2-M1)/M0, where M0 is the sample mass (g); M1 is the total mass (g) of the centrifuge tube and the sample; M2 is the total mass (g) of the centrifuge tube and the sample after the oil absorption.
Determination of emulsification and emulsion stability
For the emulsification test, a 5 mL protein sample was added into a test tube followed by the addition of 25 mL deionized water and 20 mL soybean oil. This is because the protein solubilization is at an optimum level when the concentration of the protein sample was between 6% and 8%. After shaking for 1 min, the mixture was centrifuged for 2 min at 2500 r/min. The emulsion layer was distinguished. The emulsifiability was calculated using Formula (5): emulsifiability = (the height of the emulsified layer in the centrifuge tube/the height of total liquid in the centrifuge tube) x 100.
Determination of emulsion stability was determined according to the method by Madhusudhan and Singh.[Citation13] A 5 g of sample was dissolved in 100 mL of deionized water (adjusted to pH 7.0) and added with 50 mL of soybean oil. The mixture was homogenized for 1 min at high speed. The height of the emulsion layer (H0) was measured by placing in a 45°C water bath for 45 min, and the height of the emulsion layer (H1) was measured again after 30 min. The emulsion stability was calculated using Formula (6): emulsion stability = (H0/H1) x 100.
Foaming and foaming stability
WG and modified protein samples were dissolved in phosphate buffer pH 7.0 and added with 10 mL sample solution (V0) followed by high-speed emulsion homogenization for 2 min.[Citation14] The total volume (V1) was quickly measured and the total volume (V2) was measured again in 30 min. Foaming was calculated using Formula (7): foaming = (V0/V1) x 100; and foam stability was calculated using Formula (8): foam stability = (V1/V2) x 100.
Statistical analysis
Data were compared and analyzed using ANOVA (SPSS 18.0, SPSS Inc, Chicago, IL, USA). MS Excel 2003 software was used to draw a line chart and Design-Expert version 8.0.6 software was used to draw contour maps for factor interactions. All experiments were conducted in triplicate.
Results and discussion
Enzyme screening
The papain, alkaline protease, neutral protease, complex protease, flavor protease, pepsin, and trypsin were used to digest the walnut protein. NSI (solubility) and DH were used as indicators in order to determine the most suitable hydrolyzing protease. Seven enzymes were selected to be fully released the highest enzyme activity of the enzyme under optimal conditions (). By measuring NSI and DH, the highest DH of the complex protease was 6.61%, followed by the flavor enzyme (5.77%); the NSI of the complex protease was 55.28%, followed by trypsin (54.57%). Therefore, complex protease was selected to enzymatically modify WG.
Table 1. NSI and DH of different enzymes
Effect of single factor experiment on modified protein
When the reaction time was 40 min and the enzyme dosage was 0.3%, the selected reaction temperatures were at 30°C, 40°C, 50°C, 60°C, and 70°C. When the reaction temperatures were 40°C and the enzyme dosage was 0.3%, the selected reaction time was at 0, 20, 40, 60, and 100 min. When the reaction temperatures were 40°C and reaction time was 40 min, the selected enzyme dosage was at 0.1%, 0.2%, 0.3%, 0.4%, and 0.5%. Investigate the influence of different factors on its NSI.
It can be seen from that the NSA of CPMP had the highest value at a reaction temperature of 40°C. After that, the NSI showed a downward trend as the temperature continued to rise. This might be because the increase in temperature caused the enzyme activity to be affected to some extent, and the loss of the corresponding enzyme limited the degree of reaction. When the temperature continuously raised to 70°C, the NSI dropped to the lowest point. This might be due to the fact that some parts of the protein were thermally aggregated or partially thermally deformed by heat. Therefore, the response surface optimization analysis of the modified protein was performed at 30°C, 40°C, and 50°C.
Figure 1. Effect of single factor experiment on NSI of modified protein. When the reaction time was 40 min and the enzyme dosage was 0.3%, the reaction temperatures were selected to be 30°C, 40°C, 50°C, 60°C, and 70°C. When the reaction temperature was 40°C and the enzyme dosage was 0.3%, the reaction time was selected to be 0, 20, 40, 60, 80 and 100 min. When the reaction temperature was 40°C and the reaction time was 40 min, the enzyme dosage was 0.1%, 0.2%, 0.3%, 0.4%, and 0.5%. Three replicates were performed for each sample
When the reaction time was 40 min, the NSI of CPMP had the highest value (). In the initial range of 0–40 min, the NSI increased slowly from the beginning to the rapid rise; when at 40 min, the NSI started to decline, firstly from rapid decline to slow decline. This decline might be due to the fact that the enzyme-restricted hydrolyzed protein reached a certain degree of equilibrium over time. Since the polypeptide chain formed by enzymatic hydrolysis and the degree of relaxation of the macromolecular peptides made the corresponding NSI saturated, this led to a downward trend in the NSI when the cleavage site of the complex protease and the enzyme activity began to gradually decrease. Therefore, the response surface optimization analysis of the modified protein was performed at 20, 40, and 60 min.
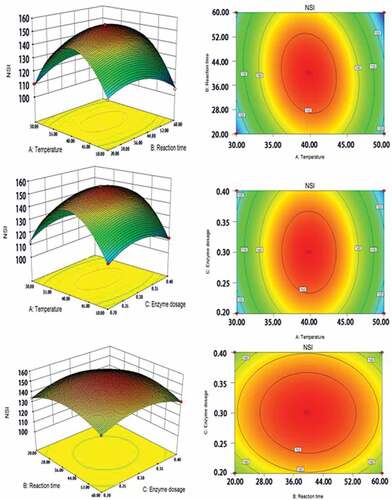
Figure 2. Response surfaces and contour maps of complex proteases affecting NSI of the modified protein
When the amount of the enzyme was 0.3%, CPMP had the highest NSI (). In the two intervals of 0.1%-0.3% and 0.3%-0.5% of the enzyme, the former showed a rapid increase in NSI with increasing enzyme dosage, while the latter showed a rapid decline in NSI with increasing enzyme dosage. These two trends form a sharp contrast when the amount of enzyme was 0.3%, which may be because a certain amount of enzyme reacted with the corresponding protein to undergo catalytic hydrolysis, resulting in hydrolysis of the peptide chain and structural unfolding of the protein, thereby increasing NSI. When too many enzymes were present in the solution or both the enzyme and protein were fully active, the hydrolyzed protein produced a portion of the hydrophobic polypeptide, which might lead to a decrease in NSI. Therefore, the response surface optimization analysis of the modified protein was performed at 0.2%, 0.3%, and 0.4%.
Figure 3. Fluorescence spectra of WG and CPMP
Establishment of response surface analysis test
Based on the single factor experiment, the reaction temperature (A), reaction time (B) and enzyme dosage (C) were labeled as independent variables; NSI were labeled as the response value. A three-factor three-level response surface experiments were designed for the response surface optimization experiment. The experimental data were analyzed by Design Expert 8.0.6 software. The factor levels are shown in .
Table 2. Response surface test factor level for enzymatically modified treatment
Response surface test results and analysis
The test was conducted according to the level of the response surface factor, and the results of the response surface analysis are shown in . Regression analysis of the experimental data was performed using Design Expert 8.0.6 software, and the quadratic polynomial regression model was obtained as follows:
Table 3. Response surface optimization test results for complex protease
The regression equation of the nitrogen-soluble index of the enzymatically modified protein was analyzed by variance, and the results are shown in . As can be seen from , the significance of the model was P < 0.001, R2 = 0.9573, indicating that the model was highly significant. The feasibility of the equation was good, with a fitting degree of 90.24%, and the missing term was not significant (P > 0.05), indicating that the regression equation had no missing factors. The regression model and the actual experiment were well fitted; the data were accurate and reliable, and the model was highly reliable and accurate.
Table 4. Regression model analysis of variance table
It can be seen from that the influence of the A2 term on the level difference of the NSI was extremely significant (P < 0.001), indicating that there was a complicated secondary relationship. The AB and B2 terms had a significant effect on the level difference of NSI (P < 0.01), indicating a highly significant interaction between the reaction temperature and the reaction time. The A, B, AC, BC, and C2 terms had significant effects on the level difference of NSI (P < 0.05), indicating that there was a significant interaction between enzyme dosage with reaction temperature and reaction time. The other factors were not significantly affected (P > 0.05). Therefore, combined with the relevant significance, the influence of each factor on the response value was as follows: reaction temperature>reaction time>enzyme dosage.
The steep level of the response surface and the shape of the contour line reflected the interaction of various factors and the influence on the response value. The contour line was oblate and the interaction between the two factors was significant. shows the effect of significant interactions on the solubility of the modified protein.
The reaction temperature was the main factor affecting protein NSI, so the response surface was steeper than the reaction time and enzyme dosage (). Compared with temperature, the effect of enzyme dosage on protein solubility was not the most prominent, and the response surface was somewhat gentle. The change in reaction time factor was between temperature and enzyme dosage and there was no major change trend.
Effect of optimization experiment on modified protein
The optimal process conditions for CPMP were obtained from the model: reaction temperature was 38.81°C, reaction time was 39.99 min, and enzyme dosage was 0.325%. However, considering the feasibility of the actual operation, the process parameters were adjusted to: the reaction temperature was 38°C, the reaction time was 40 min, and the enzyme dosage was 0.3%. Under this condition, the experiments were performed in triplicate. For CPMP, NSI was 158.32%, 149.84%, and 156.07%, respectively, and the average value was 154.41%.with a relative error of 0.11. Since the model was consistent with this optimization experiment, the model could be used to better predict the preparation of CPMP.
Fluorescence spectroscopy
WG and the modified protein were analyzed using a fluorescence spectrophotometer. The fluorescence spectrum generated at the excitation wavelength of 310 nm was mainly caused by the presence of a certain amount of tryptophan in the gluten, and the fluorescence peak shown on the spectrum was substantially a tryptophan group (). The electron transition caused by photoexcitation which resulted in the position of the peak was fixed at 431 nm. However, it can be seen from the comparison of the fluorescence intensity that the intensity of the WG was 6.6 × 10³, while the fluorescence intensity of the CPMP was 1.7 × 10³. This obvious change in fluorescence intensity also indicated that the tryptophan had a large amount of attenuation after modification, and the dissociated tryptophan to some extent indicated that the hydrophilic group was gradually destroyed.
The addition of enzymatic hydrolyzed protein molecules into peptides and peptide chains, which opened up the structure of protein coils. Protein molecules gradually expanded into molecular chains, and changes in protein side chains affected the changes in protein tertiary structure. As a result, this caused a large decrease in tryptophan in the protein, resulting in a decrease in fluorescence intensity. Another reason might be due to the change of the external environment. For example, the protein was gradually expanded from the original folded state, and the protein at this time also changed from the ordered structure to the disordered structure, and the phenomenon of unfolding occurred.
By changing the internal structure of the protein and the microenvironment in which the protein was located, the amino acids in the protein could be changed accordingly. The amino acid residues in the protein molecules and on the surface of the protein molecules determined the hydrophilicity and hydrophobicity of the protein.[Citation15] Hydrophilic amino acids form a hydrophilic region outside the protein, while hydrophobic amino acids form a hydrophobic region inside the protein. Some parts of tryptophan were released from the hydrophobic region to the hydrophilic region, and its amino acid residues were exposed to a polar environment, resulting in a decrease in fluorescence intensity.[Citation16] Another part of tryptophan was gradually “embedded” inside the molecule, and its microenvironment was reduced in polarity, which led to a decrease in fluorescence intensity. Therefore, the exposure of the hydrophilic group and the embedding of the hydrophobic group greatly enhanced the hydrophilicity and solubility.
UV spectrum
Currently, UV spectroscopy has become an effective tool for detecting intermolecular interactions and molecular structure changes.[Citation17] The hydrophobicity of the protein surface plays an important role in the changes of protein tertiary and quaternary structure. The most important factor for UV absorption in protein is the tryptophan, tyrosine and phenylalanine residues on the side chains of protein as well as histidine and cysteine groups.[Citation18] The presence of the first three amino acids in the protein and the quantitative nature of the protein directly determine the level of UV absorption of the protein, while the influence and correlation of the histidine and cysteine groups are weaker than the three amino acids. Changes in protein surface hydrophobicity and UV absorption also reflect changes in protein conformation.
The maximum UV absorption wavelength of WG was 284 nm (). This reflected that the UV absorption of WG was mainly due to the tryptophan and tyrosine residues in its protein. The highest UV absorption peak of WG appeared at 0.47 at 284 nm, while modified protein was 0.50. The absorption peaks of all modified proteins appeared between 275 and 284 nm, and the blue peak of protein UV absorption peak appeared, indicating that the polarity state of the microenvironment in which the residue group such as tyrosine had changed.
Figure 4. UV-visible spectroscopy of WG and CPMP
Scanning of electron microscope
The proteins before and after the modification as well as the proteins with different modification methods had obvious differences in microstructure ()). The WG without any modification treatment exhibited spherical small particles, which were agglomerated together in a scattered manner. Even if there are larger pieces of particles, they were produced by small particles in a mutual aggregation, and there was no large block shape. ) is a modified complex protease protein. Although the dense globular structure of WG was destroyed, there were still some small particles that were agglomerated with each other because of the effect of enzyme modification. These small particles were loose and obvious. Many large massive structures were formed, and the formation of these structures was not tight. Therefore, it is possible that these structures would be further lysed.
Figure 5. SEM of WG and CPMP (5000 X)
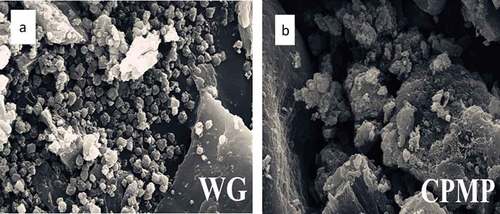
By examining the microstructure before and after modification, it can be concluded that the modification of gluten caused the original globular protein structure to shift to a sheet-like or massive structure. This might be because WG was formed by the expansion of the peptide chain due to modification. The expanded sheet-like or massive structure of the surface area was more favorable for promoting protein solubility and water-holding capacity.
Determination of functional indicators
The functional indexes of WG before and after modification were determined, and the indicators were compared horizontally and vertically. The results are shown in . The NSI of unmodified WG and CPMP by complex protease was 66.22% and 154.30%, and NSI was increased by 132.99%. The water-holding and oil-holding properties of unmodified WG were 4.27 g/g and 4.81 g/g, respectively. The water-holding and oil-holding properties of CPMP by complex protease were 5.26 g/g and 3.51 g/g, respectively. The modified WG had a significantly higher water-holding capacity than unmodified WG, and the water holding capacity was increased by 23.37%. Studies have shown that the use of enzymes has a certain degree of enzymatic hydrolysis of proteins, which enhances the ability of proteins to bind with water.[Citation16,Citation19] This may be because enzymatic hydrolysis exposes hydrophilic amino acids, and more hydrophilic amino acids continuously bind to surrounding water molecules, resulting in an increasing hydrophilic capacity. The modified WG had a significantly lower oil-holding property than unmodified WG, and its oil holding capacity was only 73.01% of unmodified gluten. This may be because the enzymatic modification was mild and the reaction was not chemically intense. Therefore, the hydrophobic amino acid could not be completely exposed. Another reason may be due to the specificity of the enzyme itself, which had a certain difference in the order of peptide chains and peptide bonds in the hydrolyzed protein.[Citation20] Therefore, after the hydrophobic amino acid was exposed, the hydrophilic amino acid, which was subsequently exposed prevented the exposure of the hydrophobic amino acid. As a result, the hydrophobic amino acid was not being completely exposed, causing in poor oil retention.
Table 5. Comparison of functional properties of WG before and after modification
In terms of emulsifying properties and foaming properties, it could be concluded from that both emulsifying properties and emulsion stability were greatly improved. The emulsification and emulsion stability of unmodified WG was 31.91% and 64.58%, respectively, while the emulsification and emulsion stability of CPMP was 42.06% and 113.04%, respectively. The emulsification properties of CPMP were higher than those of the unmodified WG, and the emulsion stability was improved by 75.04%. This also indicated that the WG treated by enzymatic modification had an improved emulsification characteristics and an increased nitrogen solubility index. Guan et al. pointed out that in general, the solubility of protein was better, and other functional properties of protein were correspondingly better.[Citation19] While Shen et al. reported that although the emulsifying property was improved when WG was modified by enzymatic method, the emulsion stability showed a significant decrease. The decrease may be due to the enzymatic hydrolysis that destroyed the internal structure of the walnut protein, causing its internal structure to be opened. Subsequently, this would result in the gradual exposure of non-polar groups. Because enzymatic hydrolysis also produced peptides and small peptides, these peptides sticked to the surface of oil molecules, preventing the emulsion stability of walnut protein.[Citation20] The modified WG had no significant changes in foaming and foaming stability. Foaming characteristics were not significant because the enzymatic modification was mild, and this mild property does not change the foaming characteristics. Kong et al. suggested that limited enzymatic hydrolysis allowed protein molecules to be converted to polypeptides, while polypeptide chains had a higher surface activity than proteins, and this activity promoted improved functional properties of walnut proteins.[Citation21]
Conclusion
Using enzymatic method for deamidating a vegetable protein is relatively efficient, and the modified protein with specific functional properties is also relatively easy to obtain. In the modification treatment, the degree of exposure of the group, the degree of exposure, and the catalytic sites and enzymatic cleavage sites of the enzymatic hydrolysis directly or indirectly affected the functional properties of the modified protein. Therefore, moderate and appropriate enzymatic hydrolysis plays an important role in the improvement of protein in food products.[Citation22]
In this study, the optimal conditions for modified protein were determined by single factor and response. The optimal conditions for CPMP were as follows: reaction temperature was 38°C, reaction time was 40 min and enzyme dosage was 0.3%. Under these conditions, the NSI of CPMP was 154.30%, which was increased by 132.99%; the water holding capacity was increased by 23.37%; the emulsifying property was improved to some extent and the emulsion stability was improved by 75.04%. There was no major change in foaming and foaming stability. Based on the above discussion, the modification of walnut protein by complex protease had improved NSI, emulsifying property and foaming property of walnut protein. Also, this study found that the enzymatic method is suitable for industrial production because of its simple operation, mild conditions and low cost. It also makes the modified walnut protein to be more suitable for food processing and production, which helps to expand its application in food and other food-related fields.
Conflict of interest
The authors declare that they have no conflict of interest.
Additional information
Funding
References
- Xiong, L.; Sun, Q.; Liu, J.; et al. Study on the Process of Transglutaminase Modified Peanut Protein Isolate [J]. J. Chin. Cereal. Oils Assoc. 2012, 27(4), 44–49.
- Shen, L.; Wang, C.; Tang, C. Effects of High Pressure Microfluidization on the Conformation and Functional Properties of Soy Protein Isolate [J]. Food Sci. 2012, 33(3), 72–76.
- Ma, T.; Wang, Q.; Wu, H. Optimization of Extraction Conditions for Improving Solubility of Peanut Protein Concentrates by Response Surface Methodology. LWT - Food Sci. Technol. 2010, 43(9), 1450–1455. DOI: 10.1016/j.lwt.2010.03.015.
- Foegeding, E. A.; Davis, J. P. Food Protein Functionality: A Comprehensive Approach. Food Hydrocolloids. 2011, 25(8), 1853–1864. DOI: 10.1016/j.foodhyd.2011.05.008.
- Schlichtherle-Cerny, H.; Amadò, R. Analysis of Taste-Active Compounds in an Enzymatic Hydrolysate of Deamidated Wheat Gluten. J. Agric. Food Chem. 2002, 50(6), 1515–1522.
- Sze-Tao, K. W. C.; Sathe, S. K. Walnuts (Juglans Regia L): Proximate Composition, Protein Solubility, Protein Amino Acid Composition and Protein in Vitro Digestibility. J. Sci. Food Agric. 2000, 80(9), 1393–1401. DOI: 10.1002/1097-0010(200007)80:9<1393::AID-JSFA653>3.0.CO;2-F.
- Chi, Y.; Cui, M.; Cui, X. Enzymatic Hydrolysis of Skin Shavings for Preparation of Collagen Hydrolysates with Specified Molecular Weight Distribution. J. Chem. Soc. 2012, 77(1), 16–20.
- Liao, L.; Zhao, M.; Ren, J.; Zhao, H.; Cui, C.; Hu, X. Effect of Acetic Acid Deamidation‐Induced Modification on Functional and Nutritional Properties and Conformation of Wheat Gluten. J. Sci. Food Agric. 2010, 90(3), 409–417. DOI: 10.1002/jsfa.3830.
- Tong, P.; Gao, J.; Chen, H.; Li, X.; Zhang, Y.; Jian, S.; Wichers, H.; Wu, Z.; Yang, A.; Liu, F. Effect of Heat Treatment on the Potential Allergenicity and Conformational Structure of Egg Allergen Ovotransferrin. Food Chem. 2012, 131(2), 603–610. DOI: 10.1016/j.foodchem.2011.08.084.
- Zhang, Q.; Tu, Z.; Xiao, H.; Wang, H.; Huang, X.; Liu, G.; Liu, C.; Shi, Y.; Fan, L.; Lin, D. Influence of Ultrasonic Treatment on the Structure and Emulsifying Properties of Peanut Protein Isolate. Food Bioprod. Process. 2014, 92(1), 30–37. DOI: 10.1016/j.fbp.2013.07.006.
- Paredes-Lopez, O.; Ordorica-Falomir, C.; Olivares-Vazquez, M. Chickpea Protein Isolates: Physicochemical, Functional and Nutritional Characterization. J. Food Sci. 1991, 56(3), 726–729. DOI: 10.1111/j.1365-2621.1991.tb05367.x.
- Pedroche, J.; Yust, M.; Lqari, H.; Girón-Calle, J.; Alaiz, M.; Vioque, J.; Millán, F. Brassica Carinata Protein Isolates: Chemical Composition, Protein Characterization and Improvement of Functional Properties by Protein Hydrolysis. Food Chem. 2004, 88(3), 337–346. DOI: 10.1016/j.foodchem.2004.01.045.
- Madhusudhan, K.; Singh, N. Effect of Heat Treatment on the Functional Properties of Linseed Meal. J. Agric. Food Chem. 1985, 33(6), 1222–1226. DOI: 10.1021/jf00066a052.
- Agyare, K. K.; Addo, K.; Xiong, Y. L. Emulsifying and Foaming Properties of Transglutaminase-Treated Wheat Gluten Hydrolysate as Influenced by pH, Temperature and Salt. Food Hydrocolloids. 2009, 23(1), 72–81. DOI: 10.1016/j.foodhyd.2007.11.012.
- Moure, A.; Sineiro, J.; Domínguez, H.; Parajó, J. C. Functionality of Oilseed Protein Products: A Review. Food Res. Int. 2006, 39(9), 945–963. DOI: 10.1016/j.foodres.2006.07.002.
- Valueva, T. A.; Revina, T. A.; Mosolov, V. V.; Mentele, R. Primary Structure of Potato Kunitz-Type Serine Proteinase Inhibitor. Biol. Chem. 2000, 381(12), 1215–1221. DOI: 10.1515/BC.2000.149.
- Sengupta, B.; Chakraborty, S.; Crawford, M.; Taylor, J. M.; Blackmon, L. E.; Biswas, P. K.; Kramer, W. H. Characterization of Diadzein–Hemoglobin Binding Using Optical Spectroscopy and Molecular Dynamics Simulations. Int. J. Biol. Macromol. 2012, 51(3), 250–258. DOI: 10.1016/j.ijbiomac.2012.05.013.
- Marzban, G.; Herndl, A.; Pietrozotto, S.; Banerjee, S.; Obinger, C.; Maghuly, F.; Hahn, R.; Boscia, D.; Katinger, H.; Laimer, M. Conformational Changes of Mal D 2, a Thaumatin-Like Apple Allergen, Induced by Food Processing. Food Chem. 2009, 112(4), 803–811. DOI: 10.1016/j.foodchem.2008.06.051.
- Guan, X.; Yao, H.; Chen, Z.; Shan, L.; Zhang, M. Some Functional Properties of Oat Bran Protein Concentrate Modified by Trypsin. Food Chem. 2007, 101(1), 163–170. DOI: 10.1016/j.foodchem.2006.01.011.
- Shen, M.; Wang, W.; Liu, L.; et al. Study on the Technology of Limited Enzymatic Hydrolysis and Solubilization Modification of Walnut Protein [J]. Chin. J. Cereal. 2015, 30(8), 93–98.
- Kong, X.; Zhou, H.; Qian, H. Enzymatic Hydrolysis of Wheat Gluten by Proteases and Properties of the Resulting Hydrolysates. Food Chem. 2007, 102(3), 759–763. DOI: 10.1016/j.foodchem.2006.06.062.
- Liao, L.; Zhao, M.; Wang, S.; et al. Research Progress on Deamidated Proteins and Peptides [J]. Food Sci. 2013, 34(9), 340–345.