
 ?Mathematical formulae have been encoded as MathML and are displayed in this HTML version using MathJax in order to improve their display. Uncheck the box to turn MathJax off. This feature requires Javascript. Click on a formula to zoom.
ABSTRACT
In this study, Sea Water Bread (SWB), made with food grade sea water was compared with control bread made with Tap Water (TWB). Sea water’s influence on chemical-nutritional properties of bread was investigated. Contents of salt, macro/micro-elements, basic nutrients, polyphenols, antioxidant activity, olfactory characteristics, and volatile components were analyzed. Chlorides’ analysis showed SWB had a lower salt content than TWB and it was confirmed by ICP-OES investigation. An electronic nose confirmed differences between the groups of aromatic molecules of the bread typologies, as well as the profiles of the volatile molecules by GC-MS.
Introduction
Bread is a baked product whose ingredients are flour, water, salt, and yeast. During bread making, biochemical and chemical-physical processes of changes occur, which affect various constituents.[Citation1] Water and flour are the main ingredients in a bread recipe and they affect texture and crumb the most. Another ingredient like salt has become a common component in baked products and performs a number of sensory and technological functions. The sensory function is related to flavor while the technological functions are related to changes in dough properties during bread making and to yeast. The added of salt affects the volume or height of the dough. Reduction of salt level could have an adverse effect on consumers’ perception on the flavor-fullness of bread. It could lead to a reduction in the consumption of bread products since they contribute many positive benefits to a healthy diet, for example, fiber (especially whole meal), calcium, iron, and vitamins.
After baking, bread usually presents some pleasant characteristics such as a brownish and crunchy crust, a pleasant aroma, a soft and elastic crumb texture, and a moist mouthfeel.[Citation2] Bread provides also essential dietary minerals, mostly magnesium, calcium, potassium, sodium, and iron. It could be an ideal supplier of micronutrients in those cases where it is eventually fortified with them.[Citation3] This is especially valid for countries with an increased bread consumption.
Bread flavor is affected not only by the salt but also by the baking process through the formation of colored crust from the Maillard reaction and by the development of acidity in the crumb through fermentation.[Citation4] For these reasons it is necessary, when referring to the quality characteristics of a food product in terms of sensorial profile, chemical composition, physical properties, and microbiological flora, to consider its safety as a prerequisite.[Citation5]
The bread described in the present work derives by an innovative idea to use sea water without added salt in substitution of tap water. The sea water which is richer in important mineral salts contains as many as 92 elements of the Mendeleev Table. The use of seawater is recommended for those who have to follow a low sodium diet and allows to enrich important diet components such as iodine. Iodine is a precious mineral for our health. In fact, it is essential for the functioning of the thyroid gland, and must be introduced with the diet. The presence of iodine in food and water, however, is very variable and often it is scarce compared to human needs. For this reason, one might think that the Italian territory, surrounded as it is by the waters of the sea, guarantees us a sufficient supply of food iodine. Instead, it will surprise you to know that as many as 5–6 million Italians are exposed to an environmental iodic deficiency.
In this project, bread was produced by a company in the Vesuvian countries with microbiologically pure sea water supplied by Stralman srl, the only Italian company to produce sea water for food use thanks to a patented purification process. The bread produced with sea water has been compared to the bread obtained with the same raw materials but with tap water (control) and the following analyzes have been carried out on them: proximate analysis, content of sodium chloride, concentration of macro and microelements, antioxidant activity, polyphenolic content, volatile molecules profile, olfactory characteristics by means of an electronic nose.
Materials and methods
Materials
The wheat (Triticum aestivum L.) with a Type 1 refining grade, was used in this study. Wheat was purchased from by the Italian food Baronia Group S.r.l. di Grottaminarda, Avellino, June 2017. Seawater was kindly supplied from Steralmar srl (Bisceglie, BT, Italy).
Bread making
Bread samples were produced using the recipes on . The experimental samples were prepared by Filosa Domenico Bakery, Via Masseria Monaco Aiello, 80040 San Sebastiano Al Vesuvio, NA (Italy). The ingredients were mixed for 15 min in a mixer (Bomann KM 383 CB, Deutschland). This was followed by a rest period of about 15 min in order to relieve residual stress that occurred during mixing. The dough was molded into cylindrical shape to fit into a 0.2-mm thick aluminum container. The dough was prepared, proofed in baking pans for 8 h at 35°C and RH, 85% and then introduced into the oven after it had attained and maintained baking temperature (about 265°C) for 45 min, introduced centrally into the baking oven according to the bakery internal method. Bread samples were stored in a plastic container and preserved at room temperature 25°C ± 10°C and relative humidity 70 ± 5% RH. Bread samples were cut slices on the crust that were used for the experiments.
Table 1. Recipe used for bread dough preparation
Proximate analyses
The proximate analysis of the samples was performed using the Official Methods of Analysis of AOAC International.[Citation6] Oven drying, Kjeldahl’s, Soxhlet and gravimetric methods[Citation6] were used to analyze moisture, crude protein, crude fat, crude fiber contents, respectively. The carbohydrate content was estimated by difference.
Polyphenols extraction
The extraction of total polyphenols was carried out according to the method reported by Yu, Nanguet, and Beta,[Citation7] slightly modified. Aquantity of 10 mL 1 N HCl/95% ethanol (v/v, 15/85) solvent was added to a 1 g of dried and grounded TWB SWB samples. After vortexing, the mixture was performed in a temperature-controlled water bath (Branson 1800 CPX), at 65°C and under continuous stirring for 80 min. The resulting mixtures were centrifuged at 4000 rpm for 20 min. The supernatant was paper filtered to remove solid particles and stored in the dark at −20°C until their use for determination of total phenolic content (TPC) and free radical scavenging activities by means the DPPH (1,1-diphenyl-2-picrylhydrazyl) radical. They were stored at −20°C until analyzed.
Evaluation of total phenolic compounds (TPC) and antioxidant activity (DPPH test)
Total polyphenols analysis was performed by Folin–Ciocalteau method as described by Singleton and Rossi[Citation8] and by Yu et al.,[Citation7] to determine the total phenolic content (TPC) of the samples. A 10-fold dilution of Folin-Ciocalteau reagent was prepared just prior to use and then, 1.5 mL of diluted Folin-Ciocalteau reagent was used to oxidize 0.2 mL sample extracts. After leaving the mixture to equilibrate for 5 min, the reaction was then neutralized with 1.5 mL sodium carbonate solution (60 g/L). The absorbance of the resulting solution was estimated at 725 nm using a UV/Vis spectrophotometer (Model DU 730, Beckman Coulter, Brea, CA) after 90 min against a blank of acidified ethanol (1 N HCl/95% ethanol, v/v, 15/85). Ferulic acid was used as a standard. Therefore, the total phenolic content of samples was expressed as milligrams of ferulic acid equivalents/g of dried sample.
The free radical scavenging capacity was determined by the DPPH assay.[Citation9] A 7.5 μmol/L DPPH• reactant was made in methanol. Then, 3.9 mL of DPPH• solution was added to 0.1 mL of sample and the absorbance at 515 nm was measured at t = 10 min. The absorbance was determined at t = 0 min and measurement was taken after adding 3.9 mL of DPPH• solution to 0.1 mL methanol. The antioxidant activity was calculated as:
Mineralization of samples
Acid digestion of bread samples was carried out in accordance with Volpe et al.,[Citation10] slightly modified. To 0.5 g of dried sample, 5 mL of HNO3 and 2.5 mL of H2O2 were added. The mixture was digested to 220°C until the solution became transparent (Heating digester DK VELP Scientifica). After cooling, the solution was diluted to 25 mL in a volumetric flask. The resulting was analyzed with Inductively Coupled Plasma-Optical Emission Spectrometers (ICP-OES).
ICP-OES analysis
The elemental analysis of macro, micro, and trace elements were measured by ICP-OES with iCAP 7000 Series (Thermo Scientific), equipped with ASX-520 autosampler (CETAC™). A calibration curve was constructed using a standard mix solution containing all analyzed elements. The element contents were calculated by using standard curves and the final concentrations were expressed as mg element kg−1 dry weight.
Evaluation of bread by electronic nose
Volatile compounds of low molecular weight, which in humans stimulate the olfactory system, can be studied with the electronic nose. Our device (PEN 3, Air sense Analytics Inc., Schwerin, Germany) is equipped with a series of 10 MOS (Metal Oxide Semiconductor) sensors that are able to send signal changes to the computer. The acquired data are processed using software that allows multivariate analysis and highlighting homogeneous groups (clusters), the specific olfactory fingerprint of the products under examination. The two typologies of bread obtained with the same flour but different water (water from tap or water from the sea) were analyzed by electronic nose. A quantity of 2 g of each sample were placed in 45 ml glass vials, closed with a screw cap with PTFE/silicone septum, kept at 25°C for 30 min and analyzed at room temperature of 22 ± 2°C and 50 ± 5% relative humidity (RH). Each sample was analyzed as whole bread (crust and crumb) or only crumb without the crust, in five replicates. To discriminate among clusters, the principal component analysis (PCA) and the linear discriminant analysis (LDA) were applied to the responses of the MOS sensors.
Solid phase microextraction gas chromatography/mass spectrometer analysis of volatile compounds (SPME-GC/MS)
Volatile compounds of bread samples were determined by solid phase micro-extraction (SPME) coupled with gas-chromatography/mass spectrometry (GC/MS), according to Di Renzo et al.[Citation11] Bread crust and crumb were cut into pieces of 2–3 mm and mixed in the crumb to crust ratio of 3:1. For each SPME analysis, 2 g of samples were placed into a 20 mL headspace vial, and added 5 µL of 4-methyl-2-pentanol (internal standard, 100 mg/L standard solution). The vial was placed in a thermostatic block (40°C) for 3 min (incubation time) on a stirrer and the fiber was inserted and maintained in the sample headspace for 30 min (extraction time), then it was removed and immediately inserted into the GC/MS injector for the desorption of molecules. For the analyses, a silica fiber, coated with 85 mm of Carboxene Polydimethylsiloxane (Carboxen/PDMS) was used (Supelco, Bellefonte, PA, USA). Gas chromatography analysis was carried out using a 7890 Agilent GC system coupled to an Agilent 5975 inert quadrupole Mass Spectrometer (MS) equipped with a Gerstel MPS2 autosampler. The capillary column employed was an HP-Innowax (Agilent technologies) (30 m x 0.25 mm i.d. x 0.50 μm film thickness) and the carrier gas was Helium. Splitless injections were used. The oven parameters were as follows: initial temperature was 40°C held for 5 min, followed by an increase to 240°C at a rate of 5°C/min, then held for 10 min. Injector temperature was 240°C. Mass spectrometer operated in scan mode over mass range from 33 to 300 amu (2 s/scan) at an ionization potential of 70 eV. Identification of volatile compounds was achieved by comparing mass spectra with the Wiley library (Wiley7, NIST 05). The data are expressed like relative peak area respect to internal standard. Blank experiments were conducted in two different modalities: blank of the fiber and blank of the empty vial. These types of control were carried out every four analyses. The mean values are obtained by triplicate determinations on two distinct bread-making replicates (two distinct loaves).
Statistical analysis
The mean and standard deviation were calculated for each experimental parameter. Differences among the sample bread were determined for each volatile compound by analysis of variance (ANOVA), and the results were considered significant if the associated p values were below 0.05 (Tanagra 1.4 software).
Results and discussion
Among the raw materials used for the production of bread, water plays a key role both in terms of dough and product, not only for the shelf life of bakery products but above all for its sensory characteristics. The medium hardness (100–200 mg/L CaCO3) in relation to the optimal presence of Ca2+, Mg2+, and other mineral salts is considered the most suitable for the strengthening effect of gluten, in fact too hard or too sweet waters determine the formation of doughs too rigid or too soft. The salt instead, present in all the dough, has the role of strengthening the structure of the dough through interaction, similar to other salts, with the protein fraction, to control the microbial activity during fermentation, to make a contribution to the volume and aroma of bread. So replacing these two raw materials with only seawater meant first of all to identify the optimal conditions of both fermentation and chemical and sensory characteristics of the product.
NaCl content and proximate composition
In , the proximate composition of the two typologies of bread is reported. The results of the proximate analysis of the two typologies of bread show that all the samples are richly endowed with carbohydrates, moisture, protein, lipids, fiber. In general, the values of the single component are similar between of them, while they differ in the NaCl content, a significantly lower result in the sample prepared with sea water (SWB). In fact, NaCl concentration for SWB samples was 1.6% while was 2.5% for TWB samples. This decrease of Sodium Chloride is very important as in the Mediterranean populations bread is the basic food, in Italy, it comes consumed by 96% of the population bringing a significant amount of sodium chloride. The World Health Organization (WHO) recommends a salt intake target of no more than 5 g day−1. In the United Kingdom (UK) the Food Standards Agency (FSA) recommends for a reduction in adult salt consumption to 6 g day−1.[Citation12] Recent evidence, emerging from the international scientific panorama, confirms that excess sodium in the daily diet is a risk factor not only for hypertension but also for other disorders, including cardio-cerebrovascular diseases, tumors, gastric cancer, osteoporosis, cataracts, kidney stones, and diabetes.[Citation13] The reduction of salt in food is a priority of WHO and the European Union, in the context of prevention strategies for chronic non-communicable diseases. Impact on Italian food habits, reducing the daily intake of salt, is an achievable goal and the diffusion of hyposodic bread is a valid way to help reduce intake.
Table 2. Proximate analysis, total polyphenolic content (TPC) and antioxidant activity (DPPH assay) in bread samples: Tap water bread (TWB) and seawater bread (SWB)
Total phenolic content and antioxidant activity
Ferulic acid was used as a standard as the major phenolic acid found in wheat. The results of total phenolic content were expressed as milligrams of ferulic acid equivalent (FAE) per gram (mg/g) of dry samples. Values are reported in . TPC was different in the two types of samples, they are lower in TWB (0.67 mg FAE/g) and slightly higher in SWB (0.75 mg FAE/g). These results are lower than ones (0.87 mg FAE/g) reported by Yu et al. (2013). The average content of total polyphenols decreases as the cooking develops and produces changes in chemical composition as well as in the nutrients content and in bioactive substances, in comparison to flour. These modifications are connected with the addition of salt and yeast, with their activity during dough fermentation and with the entire bread-making process, but the results obtained are analogs to those reported for wheat bread in other studies. So, the concentration of phenolic acids decreased during the process of sourdough fermentation, which represents a possible negative aspect of the designed bread. On the other hand, sourdough fermentation may have other health-promoting effects such as improving mineral availability, decreasing the amount of gluten, and retarding starch bioavailability as well as improving the taste, texture, and shelf-life of the bread.[Citation14] The antioxidant activity instead showed significantly higher values in the samples prepared with sea water. This result can probably also be attributed to the presence of antioxidant elements present in higher concentrations compared to bread prepared with tap water.
Macro and microelements
In the macro and microelements contained in the seawater bread and in the control are reported. SWB had the highest concentration of potassium (7650 ± 1.57 mg Kg−1) and calcium (365.15 ± 0.09 mg Kg−1), while the same elements resulted lowest in TWB sample (6980 ± 1.51 mg Kg−1) and 274.95 ± 0.08 mg Kg−1 respectively. Magnesium content resulted significantly higher in seawater bread (917 ± 0.18 mg Kg−1) while in the control was 289.1 ± 0.11 mg Kg−1. Calcium and magnesium results are higher than those reported by Nalepa et al.[Citation15] Potassium, calcium, and magnesium develop vital cell functions, particularly in the excitability of the heart. It is a key element for myocardial movement and activation of enzymatic systems.
Table 3. Mineral content of seawater bread (SWB) and Tap water bread (TWB)
Magnesium is contained in many foods, however, thanks to the spread of processed and processed foods by industry, the food shortage of this important mineral is a very common phenomenon. In fact this mineral activates over 300 different biochemical reactions all necessary for the body to function properly. Most minerals, including calcium, potassium, and sodium, require the presence of magnesium to best perform its function.
Potassium is an essential mineral found mainly in the intracellular fluid (98%) where it is the most important positive ionic strength and it constitutes 5% of the total mineral amount in the body; it helps to preserve the skin healthy and to maintain the pressure stable blood. Potassium helps the transformation of glucose into glycogen, a form in which glucose can be preserved in the liver and then used by the body for its functioning. The metabolism of carbohydrates and proteins depends on potassium. Stimulates the elimination of toxic residues in the kidneys. Potassium acts together with sodium to normalize the heartbeat. Potassium is an essential mineral found in intracellular fluid (98%) where it is the most important positive ionic strength, making up 5% of the total mineral content in the body.
As expected, the Iodine content was significantly higher in SWB samples respect to TWB, with concentrations equal to 0.041 and 0.010 mg/kg, respectively. Iodine is an important micronutrient element and is required for the synthesis of thyroid hormones that regulate a variety of important physiological processes. An iodine-deficient diet causes a wide spectrum of illnesses, including goiter and mental retardation. The possibility of iodine oral intake with bread is a valid means to enrich the diet of this element.
Zinc and copper are also essential elements for human body and they result in chronic and acute effects in case of their deficiency.[Citation16] Respect to microelements concentration, Fe, Sr, Zn, Cu showed a higher content in SWB samples with values equal to 17.690, 4.607, 14.095 and 2.905 mg/kg, while values of TWB were 11.735, 1.970, 11.130, and 2.179 mg/kg. Our results about iron concentrations were lower than those reported by Al-Mussali and Al-Gahri,[Citation16] while zinc concentrations were higher. Moreover, Zn and Ca play an important role in the human body .[Citation17,Citation18] These data indicate that the consumption of SWB may be able to increase uptake of essential micronutrients in populaces respect to the use of bread obtained with tap water. Finally, Cd and Pb concentrations were minor of 0.005 μg Kg−1 for all samples, showing no environmental contamination.
Evaluation of bread by electronic nose
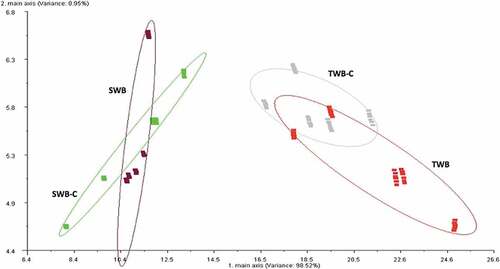
The results of the data acquired and analyzed by PCA of the two types of bread obtained with tap water or sea water are shown in . To decide if one class could be separated against each other we used the discrimination power, whose values range from 0 to 1. High values indicate a good severability of classes. The results displayed that the clusters representing the two types of bread were well separated with discrimination power, between TWB and SWB, equal to 0.93. Similarly, between the two crumbs (TWB-C and SWB-C) the discrimination power was equal to 0.87. These results indicated that the olfactory fingerprints of the two products were significantly different. Instead, the clusters of “whole bread” and its crumb of both types of bread overlapped almost entirely with discrimination power values, between TWB and TWB-C as well as between SWB and SWB-C samples, of 0.30 and 0.25, respectively. The values suggested that the two products (whole bread and its crumb) obviously have common characteristics. Furthermore, the analysis showed that the differences between the clusters of the two types of bread were attributed to the first main axis that explained more than 98% of the variance.
Figure 1. Plot of the PCA on samples of “whole bread” with tap water (TWB) or sea water (SWB) and respective crumbs (TWB-C, SWB-C)
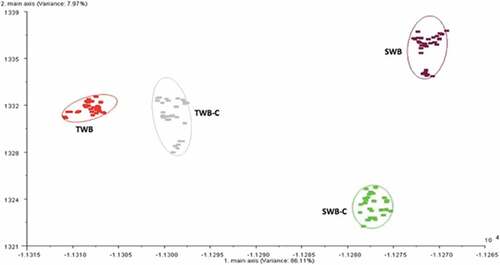
The results of the application of LDA on the data of the two types of bread are reported in . The LDA demonstrated a clear separation of the clusters, indeed it also separated the clusters related to the “whole bread” and crumb of both types of bread. The analysis showed also that the differences within the same sample, between the clusters of the “whole bread” and the respective crumb of the two types of bread, were due to diverse components. In fact, the differences between TWB and TWB-C must be attributed to the first main axis, while the differences between SWB and SWB-C must be assigned to the second main axis. It was evident that the LDA improved the resolution of the classes, separating the “whole bread” from the respective crumb, in both types of bread. Therefore, these preliminary results clearly indicated that the electronic nose was able to discriminate the two types of bread and suggested that seawater induced modifications on the aromas of bread that could be monitored during production.
Figure 2. Plot of the LDA on samples of “whole bread” with tap water (TWB) or sea water (SWB) and respective crumbs (TWB-C, SWB-C)
Solid phase microextraction gas chromatography/mass spectrometer analysis of volatile compounds (SPME-GC/MS)
Among 40 Volatile Organic Compounds (VOCs) were identified in bread samples by SPME-GC/MS. Bread aroma results from the complex combination of many volatile compounds derived from raw materials as flour and other ingredients, and originated or modified during leavening and baking steps. These 40 VOCs have been commonly reported in bread samples by several authors[Citation19,Citation20] and belonging to different chemical classes furans, aldehydes, ketones, alcohols, acids, sulfuric compounds, esters, pyrazines. In were reported the volatile compounds significantly different, p < 0.05 (control bread vs. hyposodic bread). The hyposodic bread showed higher amount of compounds originated from Maillard reaction and lipid oxidation. The non-enzymatic Maillard reactions involve the reaction between amino acids and sugars, leading to the formation of brown pigments (melanoidines) and a large number of volatile compounds like furan derivatives (2-methylfuran, 2-pentylfuran, 2-acetylfuran), furfural derivatives (furfural and 5-methylfurfural), 2-furanmethanol, 2,3-pentanedione and methylpyrazine (). Some compounds can result from Strecker degradation, one of the main stages in the Maillard reaction, where amino acids react with dehydroreductones to produce aldehydes, in particular 2-methylpropanal from valine, 2-methylbutanal from isoleucine and 3-methylbutanal from leucine; the dimethyl disulfide derives from methionine via decomposition of the Strecker aldehyde methional. Among the hexanal, 2-heptenal (E), benzaldehyde and hexanoic acid can origin from lipid oxidation, also increased through baking because of the cleavage of hydroperoxides generated by lipoxygenases during the fermentation stage.[Citation21] In conclusion, as suggest Pico et al.[Citation20], the larger amount of compounds originated by Maillard reaction and lipid oxidation in the hyposodic bread, could be due to a different bread’s baking process.
Table 4. Volatile organic compounds (VOCs) significant different (p < 0.05) identified in seawater bread (SWB) vs tap water bread (TWB)
Conclusion
The bread prepared with seawater showed a lower salt percentage and an increased macro and micronutrients content. In fact, the use of seawater increases the concentrations of some macro and essential elements such as potassium, magnesium, iron, zinc, copper, and iodine. Moreover, sea water’s use increases the antioxidant activity of bread and makes it significantly different in the olfactory quality appreciated with electronic nose and volatile molecule profile. In conclusion, the use of seawater in bread making can ensure improved nutritional properties and a minor absorption of added salt of one of the most common products in the diet of the Mediterranean populations. Subsequent evaluations with a trained panel will also highlight the sensorial aspects and the acceptability of the product.
Acknowledgments
The authors would like to appreciate the technical support of Mr Domenico Filosa owner of the Bakery in Via Masseria Monaco Aiello, 80040 San Sebastiano Al Vesuvio, NA (Italy). The authors declare no conflict of interest. This article does not contain any studies with human or animal subjects.
References
- Goesaert, H.; Brijs K.; Veraverbeke, W.S.; Courtin, C.M.; Gebruers, K.; Delcour, J.A. Wheat Flour Constituents: How They Impact Bread Quality, and How to Impact Their Functionality. Trends Food Sci. Technol. 2005, 16(1–3), 12–30.
- Martin, P. Controlling the Breadmaking Process: The Role of Bubbles in Bread. Cereal Foods World. 2004, 49(2), 72–75.
- Isserliyska, D.; Karadjov, G.; Angelov, A. Mineral Composition of Bulgarian Wheat Bread. Eur. Food Res. Technol. 2001, 213(3), 244–245. DOI: 10.1007/s002170100331.
- Cauvain, S. P. Reducing Salt in Foods: Practical Strategies; Kilcast, D., Angus, F. Ed. Woodhead Publishing Series in Food Science, Technology and Nutrition. 2007, 283-295. Doi: 10.1533/9781845693046.3.283.
- Giannou, V.; Kessoglou, V.; Tzia, C. Quality and Safety Characteristics of Bread Made from Frozen Dough. Trends Food Sci. Technol. 2003, 14(3), 99–108. DOI: 10.1016/S0924-2244(02)00278-9.
- AOAC International. Official Methods of Analysis, 20th ed.; AOAC International: Rockville, MD, 2016.
- Yu, L.; Nanguet, A. L.; Beta, T. Comparison of Antioxidant Properties of Refined and Whole Wheat Flour and Bread. Antioxidants. 2013, 2(4), 370–383. DOI: 10.3390/antiox2040370.
- Singleton, V. L.; Rossi, J. A. Colorimetry of Total Phenolics with Phoshomolybdic-Phosphotungstic Acid Reagents. Am. J. Enol. Viticult. 1965, 16(3), 144–158.
- Blois, M. S. Antioxidant Determination by the Use of a Stable Free Radical. Nature. 1958, 4617(181), 1199–1200. DOI: 10.1038/1811199a0.
- Volpe, M.G.; Nazzaro, M.; Di Stasio, M.; Siano F.; Coppola, F.; De Marco, A. Content of Micronutrients, Mineral and Trace Elements in Some Mediterranean Spontaneous Edible Herbs. Chem. Cent. J. 2015, 9, 57. DOI: 10.1186/s13065-015-0137-9.
- Di Renzo, T.; Reale, A.; Boscaino, F.; Messia, M. C. Flavoring Production in Kamut®, Quinoa and Wheat Doughs Fermented by Lactobacillus Paracasei, Lactobacillus Plantarum, and Lactobacillus Brevis: A SPME-GC/MS Study. Front Microbiol. 2018, 9, 429. DOI: 10.3389/fmicb.2018.00429.
- SACN. Salt and Health; Scientific Advisory Committee on Nutrition: London, 2003.
- Thomson, B. M. Nutritional Modelling: Distributions of Salt Intake from Processed Foods in New Zealand. Br. J. Nutr. 2009, 102(5), 757–765. DOI: 10.1017/S000711450928901X.
- Katina, K.; Arendt, E.; Liukkonen, K. H.; Autio, K.; Flander, L.; Poutanen, K. Potential of Sourdough for Healthier Cereal Products. Trends Food Sci. Technol. 2005, 16(1–3), 104–112. DOI: 10.1016/j.tifs.2004.03.008.
- Nalepa, B.; Siemianowska, E.; Skibniewska, K. A. Influence of Bifidobacterium Bifidum on Release of Minerals from Bread with Differing Bran Content. J. Toxicol. Environ. Heal A. 2012, 75(1), 1–5. DOI: 10.1080/15287394.2011.615106.
- Al-Mussali, M. S.; Al-Gahri, M. A. Nutritive Value of Commonly Consumed Bread in Yemen. E-J. Chem. 2009, 6(2), 437–444. DOI: 10.1155/2009/975960.
- Casé, F.; Deliza, R.; Rosenthal, A.; Mantovani, D.; Felberg, I. Produção de ‘leite’ de soja enriquecido com calcio. Ciênc. Tecnol Aliment, Campinas. 2005, 25(1), 86–91.
- Rebellato, A.P.; Bussi, J.; Siqueira Silva, J.G.; Greiner, F.; Joy Steel, C.; Azevedo, J; Pallone, L. Effect of Different Iron Compounds on Rheological and Technological Parameters as Well as Bioaccessibility of Minerals in Whole Wheat Bread. Food Res. Int. 2017, 94, 65–71. DOI: 10.1016/j.foodres.2017.01.016.
- Giannone, V.; Giarnetti, M.; Spina, A.; Todaro, A.; Pecorino, B.; Summo, C.; Caponio, F.; Paradiso, V. M.; Pasqualone, A. Physico-Chemical Properties and Sensory Profile of Durum Wheat Dittaino PDO (Protected Designation of Origin) Bread and Quality of Re-Milled Semolina Used for Its Production. Food Chem. 2018, 15(241), 242–249. DOI: 10.1016/j.foodchem.2017.08.096.
- Pico, J.; Martínez, M. M.; Bernal, J.; Gómez, M. Evolution of Volatile Compounds in Gluten-Free Bread: From Dough to Crumb. Food Chem. 2017, 227, 179–186. DOI: 10.1016/j.foodchem.2017.01.098.
- Pico, J.; Bernal, J.; Gómez, M. Wheat Bread Aroma Compounds in Crumb and Crust: A Review. Food Res. Int. 2015, 75, 200–215. DOI: 10.1016/j.foodres.2015.05.051.