
 ?Mathematical formulae have been encoded as MathML and are displayed in this HTML version using MathJax in order to improve their display. Uncheck the box to turn MathJax off. This feature requires Javascript. Click on a formula to zoom.
ABSTRACT
Quantitative profiling of total phenolic content (TPC) and antioxidant activity (AOA) in seeds, sprouts, and grasses of corn (Zea mays L.), wheat (Triticum aestivum L.), and barley (Hordeum vulgare L.) were performed. TPC and AOA were strongly correlated and increased with days. Grasses between 10 and 13 days showed the highest TPCs and AOA. The AOA in sprouts and grasses were a fifth and two-thirds of ascorbic acid (AA) standard, respectively, which are higher than in several popular natural antioxidants. Further cell-based studies or in vivo studies could be considered in future to draw more valuable information related to human health.
Introduction
Cereal grains are the storage organ that comprise proteins, carbohydrates, vitamins, minerals, and oils required for metabolic activity during growth and development of a new plant.[Citation1] The nutritional property of whole grains is largely enhanced during germination and sprouting.[Citation1,Citation2] Recently, sprouts and grasses of cereals have received growing attention as functional foods because of their health-promoting factors and high nutritive values including amino acid, fiber, trace elements, vitamins, flavonoids, and phenolic acids.[Citation3–Citation7] Cereal grasses (1–2 weeks of age), also called as microgreens[Citation8], are increasingly being used as natural health supplements in the form of fresh produce, tablets, frozen juice, and powder.[Citation4–Citation6]
Phenolic compounds are secondary metabolites generated naturally during steeping and sprouting.[Citation9,Citation10] These are further synthesized during normal growth and development[Citation8,Citation10] as well as in response to mild stress conditions like sub- or supra-optimal radiation, salinity, water potential, minerals, and heavy metals.[Citation10,Citation11] Phenolic compounds have antioxidant properties such as reactive oxygen species scavenging and inhibition, electrophile scavenging, and metal chelation.[Citation12,Citation13] Phenolic hydroxyl groups are good hydrogen donors and can react with oxygen and nitrogen species of organic radicals. The reaction forms stable radicals delaying or disrupting the oxidation of organic radicals.[Citation14] Due to their antioxidative properties, phenolic compounds are beneficial against diabetes, cardiovascular, and neurodegenerative diseases, mutagenesis and carcinogenesis.[Citation11,Citation15–Citation17]
Phenolic compounds in seeds, sprouts, and grasses of various cereals and legumes have been widely studied.[Citation2,Citation5,Citation7,Citation12,Citation18,Citation19] A number of studies report total phenolic contents (TPC) and antioxidant activities (AOA) in sprouts and grasses at specific days[Citation4,Citation8,Citation18] or heights of plants.[Citation3,Citation6] Quantitative time series profiling of TPC and AOA in sprouts and grasses of cereals is lacking. In addition, most of these studies have quantified TPC and AOA based on extracts[Citation6,Citation18], fresh weight basis[Citation2,Citation8,Citation10], or juices.[Citation3,Citation13] A major limitation of these approaches is the difficulty in quantifying TPC in the product dry matter. Dry matter content can vary with sprouting and germination conditions, like light, temperature, and humidity[Citation7], and water, salt, and mineral stresses.[Citation2,Citation5,Citation8,Citation19] Quantification on dry matter is important for assessment and comparison of the nutritional content in different products especially when the moisture contents are different.
In this study, quantitative profiling of TPC and AOA were performed in seeds of corn, wheat, and barley, sprouts of corn and wheat, and grasses of wheat and barley. First, the levels of TPC and AOA were determined and compared among seeds, sprouts, and grasses. Unlike previous studies, TPC levels were estimated on a dry matter basis. To find optimal harvest time for maximal TPC and AOA, the change in TPC and AOA levels of sprouts and grasses were studied with the number of days. Finally, the correlation between TPC and AOA in sprouts and grasses with number of days was analyzed.
Materials and methods
Reagents
All reagents were of analytical grade. DPPH (Sigma-Aldrich Company, Germany), Folin-Ciocalteau (F-C) reagent (Finar Limited, India), Gallic acid (LOBA Chemie, India), Ascorbic acid (AA) (Fisher Scientific, India) and Methanol (Fisher Scientific, India) were used.
Sprouting and germination
Seed grade corn, wheat, and barley kernels were obtained from Food Research Division, Nepal Agriculture Research Council. The grains were washed in tap water, soaked for 24 h in ambient temperature and the remaining water was drained. For sprouts, the soaked grains were cultivated in dark by placing them between wet woven cotton clothes. For continuous moistening, additional wet woven cotton clothes were placed over them twice every day. The whole seedling was collected for analysis on 4, 7, and 10 days. The sprouts of wheat on day 10 were discarded because of mold growth.
To grow grass, homogenous mixture of soil was prepared by thorough mixing. The soil was filled in trays to the thickness of 8 cm. The soaked grains were spread on soil surface and were covered by another 1 cm layer of the same soil. Adequate water was added daily so that the soil remained moist but not wet. Sprouting and germination were carried out in an uncontrolled temperature (average 19°C) and relative humidity (average 66%). The room was subject to diurnal cycle with fluctuations of temperature, humidity, and light. The grasses were grown in the laboratory with daylight but no direct sunlight, for better growth.[Citation7] To evaluate the reproducibility of results, the study was carried out in two blocks with a gap of 16 days between the blocks.
Preparation of sample extract
Sample extraction was carried out as described by Stankovic[Citation20] with some modifications. Briefly, 5 g samples were macerated for approximately 10 min using pestle and mortar, and 10% (weight/volume) extracts were prepared with 95% methanol. After 24 h of shaking in water bath at room temperature, the extract was filtered through Whatman No.1 filter paper. The filtrate was then concentrated to dryness using rotary evaporator at 40°C. The dried extracts were dissolved with 95% methanol as a stock solution to make 50 ml and stored at 4 ± 2°C. From the stock solution, working solutions of different concentrations were prepared.
Determination of TPC
TPC was determined by using F-C reagent spectrophotometrically as described before.[Citation20,Citation21] The methanolic extract at the sample size of 0.5 ml was mixed with 2.5 ml of 10% F-C reagent. After 5 min, 2.5 ml of sodium carbonate (7.5%, w/v) was added, mixed and incubated at 45°C for 45 min. The absorbance was measured using spectrophotometer at 765 nm against the blank solution containing 0.5 ml 95% methanol, 2.5 ml 10% F-C reagent and 2.5 ml 7.5% of sodium carbonate. Each sample was measured five times. TPC was calculated from a calibrated curve (R2 = 0.991), using gallic acid as standard (0.001–0.006 mg/ml).
DPPH (2,2-diphenyl-1-picrylhydrazyl) free radical scavenging assay
Free radical scavenging activity of the extracts was measured in vitro by DPPH assay as described before[Citation22] with some modifications. Ninety-five percent methanol was used throughout the experiment and the volume ratio of sample and DPPH solution of 0.004% (w/v) was 1:10. The absorbance was measured by using spectrophotometer at 517 nm. For comparison, AA was used as a standard. The free radical scavenging activity was calculated using the equation:
where Abs blank is the absorbance of sample solution without extract and Abs sample is the absorbance with different dilutions of standard and plant extract. IC50 value is the concentration of the sample required to scavenge 50% of DPPH free radical. It was calculated from the non-linear regression analysis of DPPH radical scavenging activity against various concentrations of samples.[Citation18] The IC50 values were expressed as mg sample (DM)/ml of DPPH solution.
Statistical analysis
The data were analyzed by one-way analysis of variance (ANOVA) and sample means were compared by Tukey’s test. P-values less than 0.05 were considered significant in all cases. Linear and quadratic lines of fit (R2) were used for the graphical expression of the results. Pearson's correlation coefficient (R) was used to study the correlation. The JMP Pro 13, SAS Institute Inc., software was used for statistical analysis.
Results and discussion
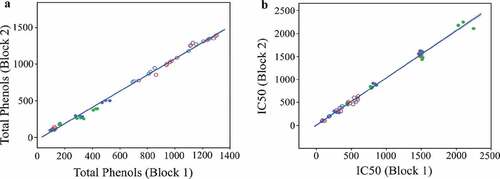
Quantitative profiling of TPCs and AOA in seeds of corn, wheat, and barley, sprouts of corn and wheat, and grasses of wheat and barley on dry matter basis were performed from the methanolic extract. The methanolic extracts were prepared from macerated samples obtained from seeds, sprouts, and grasses after filtering through Whatman No.1 filter paper. The study was performed in two blocks at a difference of 16 days between the two blocks. TPCs and AOA were highly correlated between two blocks (R = 0.997, p < 0.05 for TPCs and R = 0.996, p < 0.05 for AOA) as shown in . The linear line of fits (R2) for TPCs and AOA were 0.995 and 0.992, respectively.
Figure 1. Correlation of TPC and IC50 between two blocks. (a) Correlation of TPC between Block 1 and 2, (b) Correlation of IC50 between Block 1 and 2
TPC quantification in seeds, sprouts, and grasses
TPCs were lowest in seeds (98.45, 109.06, and 127.40 mg/100 g DM in corn, wheat, and barley, respectively) (). These TPC levels are consistent with previous studies in corn[Citation23,Citation24], wheat[Citation19,Citation24,Citation25], and barley[Citation24,Citation26] seeds. shows TPC levels in seeds and the sprouts and grasses at different days. TPC levels are slightly higher in sprouts, and highest in grasses, consistent with previous findings.[Citation5,Citation6,Citation8] TPC in sprouts is significantly affected by the number of days of growth (p < 0.05). The linear line of fit for TPC with days of sprouting was 0.94 (R2) for corn and 0.98 (R2) for wheat sprouts (). The TPCs in wheat sprouts are comparable to those reported on fresh matter by Zilic et al.[Citation27] In corn, however, TPCs were lower than previously reported (sprouting at 35°C).[Citation10] Low TPC may be due to the reduced rate of germination at our experimental temperature (average 19°C).
Figure 2. TPC, moisture content, height, and IC50 in seeds, sprouts, and grasses. (a) TPC, (b) moisture content, (c) height, and D: IC50. Each bar in the plot is an average of six samples collected from two blocks and three replicates in each block. The error bars indicate the standard deviation of the six samples. Different alphabets above the bars indicate a significant difference between the means (p < 0.05)
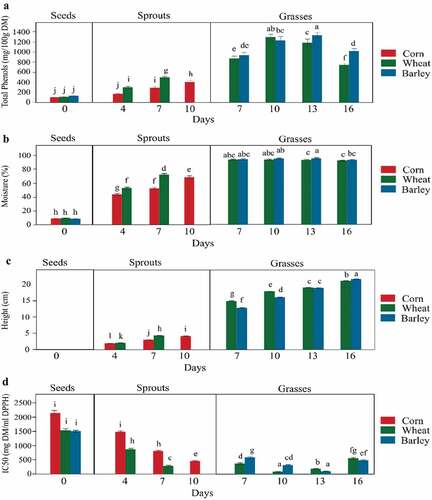
Figure 3. TPC and IC50 values in seeds, sprouts of corn and wheat, and grasses of wheat and barley. (a) TPC in sprouts, (b) TPC in grasses, (c) IC50 in sprouts, (d: IC50 in grasses. Each point in the plot is an average of six samples collected from two blocks and three replicates in each block. The error bars indicate the standard deviation of the six samples. Day 0 in each of the plots represents values for seeds
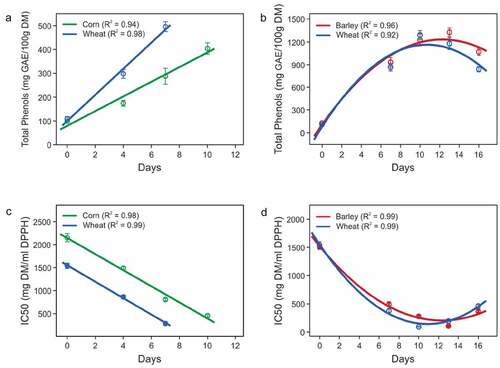
In grasses, TPCs increased with the number of days and reached a maximum between days 10 −13 and decreased thereafter (). The trend was characterized by a strong quadratic relation for both wheat (quadratic line of fit, R2 = 0.92) and barley (quadratic line of fit, R2 = 0.96). The maximum TPC in wheat and barley were 1290.51 ± 56.45 and 1325.50 ± 58.14 mg GAE/100 g DM, respectively. The decrease in TPC after the maxima was significant in both wheat and barley (p < 0.05). Extensive TPC profiling of grasses grown in daylight has not been studied previously. Previous studies of TPC levels in grasses grown in sunlight showed that TPCs in barley grass reached a maximum level later than wheatgrass[Citation2,Citation28,Citation29] as observed in this study in daylight conditions. Nutrient levels in grasses are maximum at jointing stage[Citation4,Citation30] and decrease with the development of non-phenolic structural components like cellulose and hemicellulose in leaves, leaf veins, stems, and nodes.[Citation30] Further, phenolic compounds are also involved in strengthening plant cell walls by polymerization and cross-linking into lignans and lignins[Citation11,Citation31] making phenolic compounds bound and less extractible with organic solvents.[Citation32] TPC levels measured in this study are likely underestimates because only TPCs extractible with the organic solvent (methanol) using F-C reagent were measured. In addition, certain phenolics such as chlorogenic acid, pseudohypericin, hyperforin, and isoquercetin could have degraded during evaporation at 40°C.[Citation33] A 10% decrease in TPCs was estimated due to evaporation at 40°C for 8 h.[Citation21] The samples were evaporated for 12 h in this study. Loss of TPCs in experimental conditions could not be estimated, but a decrease in TPCs is anticipated.
TPC comparison between corn, wheat, and barley
The TPC levels in corn, wheat, and barley were compared. The average TPCs in seeds of all three species were similar (p > 0.05), but numerically barley > wheat > corn (). In wheat sprouts, the increase in TPC was significantly higher than in corn sprouts (p < 0.05). The rate of TPC increase in corn was slower as demonstrated by the lower TPC levels in day 10 corn sprouts (404.05 ± 24.16 mg GAE/100 g DM) than day 7 wheat sprouts (495.66 ± 20.49 mg GAE/100 g DM). The slower rate of TPC increase may be due to short germination time and faster rate of germination of wheat sprouts. The germination of corn does not occur below basal temperature (10°C), and the time for the germination and emergence is 84 degree days.[Citation34] Whilst, the basal temperature and the time for germination and emergence of wheat are 4°C and 35 degree days, respectively.[Citation35] This demonstrates a higher rate of germination of wheat compared to corn.
In grasses, TPC levels were maximum at day 10 in wheat and day 13 in barley, however, there was no significant difference in the maximum TPCs in the two species (p > 0.05). It is of note that TPCs in wheatgrasses reached the maximum earlier than barley which may be due to delayed growth of barley. Similar results were observed previously[Citation2,Citation28,Citation29], although in sunlight condition. Soaking the seeds before sowing may have favored the growth of wheatgrasses because the rate of water adsorption and effect of pre-sowing water treatment on germination potential is higher in wheat than in barley.[Citation10,Citation12,Citation36]
TPC in day 10 corn sprouts was higher than in sprouts of lentils[Citation37] and amaranth[Citation38], comparable to mungbean sprouts[Citation39], and lower than the sprouts of barley[Citation40], wheat, and buckwheat.[Citation38] TPC in corn sprouts was about half of sprouts of broccoli[Citation39] and oats.[Citation41] The TPC of corns germinated at optimum temperatures (35°C) was however comparable with broccoli[Citation39] and oat[Citation41] sprouts. Wheat sprouts of day 7 have TPC level comparable to barley[Citation40], but lower than sprouts of buckwheat[Citation38], oat[Citation41] and broccoli.[Citation39] TPCs in wheat and barley grasses were comparable to rice grasses[Citation42] and were higher than all above-mentioned sprouts. shows the TPC levels in sprouts and grasses of various species reported in this and previous studies.
Table 1. TPC levels in sprouts and grass of various cereals. TPCs are expressed as mg GAE/100g DM
Effects of moisture and growth rate on TPC
Availability of free water promotes metabolism, enzyme synthesis, and kernel modification during germination.[Citation8,Citation12] To study the effect of moisture on TPC levels, the moisture content in sprouts and grasses were analyzed. The moisture content in sprouts varied at different days of sprouting (). Significant correlations of both corn (R = 0.96, p < 0.05) and wheat (R = 0.984, p < 0.05) sprouts was observed with the moisture content of sprouts. Overall in sprouts, TPC level showed a higher correlation with moisture content (R = 0.963, p < 0.05) than with days of sprouting (R = 0.663, p < 0.05). Hence, the estimation of TPCs in sprouts in this study may have been influenced by moisture content. However, in grasses, the moisture content was consistent and had no effect on TPC levels ().
To examine the relation between TPC levels and growth rate of grasses, the heights of grasses from 7 to 16 days were studied (). Wheat grew faster in the beginning days and measured 2.12 cm taller than barley grasses on day 7. The growth rate of wheatgrasses dropped after day 10. On the other hand, barley continued to grow at a higher rate and became as tall as wheatgrass at day 13 and slightly taller at day 16. These results demonstrate that delayed increase in TPC levels of barley is due to a delayed growth rate.
DPPH radical scavenging activity
To analyze AOA in seeds, sprouts, and grasses, IC50 values for scavenging DPPH radical were estimated from the methanolic extracts. IC50 is defined as the amount of sample required to scavenge 50% of a given concentration of DPPH free radical. A lower IC50 indicates higher radical scavenging activity and thus higher AOA.[Citation16] All IC50 values were compared to AA standard. The IC50 for AA was found to be 61.33 ± 1.01 mg/ml of DPPH solution. All extracts of seeds, sprouts, and grasses have a higher IC50 compared to AA and are in the order of seeds > sprouts > grasses ().
IC50 values in sprouts and grasses decreased with the increase in number of days (). In sprouts, IC50 showed a linear effect of number of days (p < 0.05). The linear line of fit for IC50 with days of sprouting was 0.98 (R2) for corn and 0.99 (R2) for wheat sprouts (). In grasses, IC50 showed a quadratic effect of number of days for both wheat (quadratic line of fit, R2 = 0.99, p < 0.05) and barley (quadratic line of fit, R2 = 0.99, p < 0.05) (). The decrease in IC50 is independent of the type of grain (p-value > 0.05). A minimum IC50 among the sprouts was obtained in day 7 wheat sprouts (IC50 value = 289.26 ± 25.21 mg/ml DPPH), which is 4.72 times higher than in AA. The lowest IC50 was observed in day 10 wheatgrass (IC50 value = 88.82 ± 8.93 mg/ml DPPH) and day 13 barley grass (IC50 value = 103.10 ± 11.37 mg/ml DPPH) (). IC50 values are 1.45 (wheat) and 1.68 (barley) times of AA. Similar findings were observed in previous studies. Wheatgrass showed highest AOA between 10 and 15 days[Citation3] and AOA, expressed as AA equivalent determined by 2,2ʹ-azino-bis (3-ethylbenzothiazoline-6-sulphonic acid) (ABTS) method, of 7 day wheatgrass juice was higher than in 7 day barley grass.[Citation13] It is of note that a lower IC50 value indicates higher AOA.
Correlation between TPC and AOA
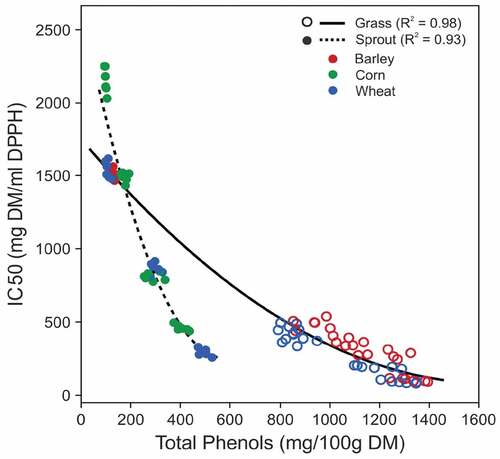
TPC and IC50 were significantly anti-correlated in both sprouts and grasses (R = −0.945, p < 0.05 in sprouts and R = −0.968, p < 0.05 in grasses) (). This implies a strong positive correlation between TPC and AOA because lower IC50 means higher AOA. Correlation between TPC and AOA has been reported previously in a wide range of seeds and plants including wheat, barley, rice, oats, corn, buckwheat, peas, beans, lentils, and many other fruits and vegetables.[Citation2,Citation10,Citation18,Citation42,Citation43] Phenolic compounds have strong AOA, and TPC is the sum of reaction potential (including radical scavenging and metal chelation) of the phenolic compounds. It is, however, not the sum of amounts of phenolic compounds due to variability in the reaction potentials of different phenolic compounds.[Citation21] AOA, on the other hand, is the measure of the consequences of radical scavenging components (like polyphenols and other non-phenolic antioxidants). Grasses required higher TPCs than sprouts to have the same IC50. Notably, both TPC levels and IC50 values for day 7 grasses (866.37 ± 64.65 mg GAE/100 g DM and 374.89 ± 28.68 mg DM/ml DPPH) were higher than for day 7 sprouts (495.66 ± 20.49 mg GAE/100 g DM and 289.26 ± 25.2 mg DM/ml DPPH) (). This is possibly due to the higher antioxidant potential of hydrolyzed bound phenolics present in sprouts.[Citation26,Citation32,Citation44] TPCs in sprouts are the sum of soluble phenolics in seed, bio-synthesized phenolics and hydrolyzed phenolics present as bound in the cell walls.[Citation7,Citation45]
Figure 4. Correlation between TPC and IC50 values in sprouts of corn and wheat, and grasses of wheat and barley
Conclusion
This study reports, for the first time, quantitative profiling of methanol extractible TPCs and IC50 obtained from seeds, sprouts, and grasses of corn, wheat, and barley. The quantitative profiling at different days of sprouting shows the optimal harvest times for maximum TPC and AOA. In addition to replicating previous findings, this study has charted TPC and AOA levels at different number of days on a dry matter basis. AOA of sprouts and grasses were 1/5th and 2/3rd of AA standard, respectively. The sprouts and grasses are rich in phenolic compounds and antioxidant properties which might be appreciated for their health benefits. This study mainly focused on phenolic quantification, but if cell-based studies or in vivo studies could be considered in the future, more valuable information that related to human health would be collected.
Acknowledgments
The authors thank Dr. Abhishek Niroula and Dr. Sushil Dhital for insightful discussions.
Additional information
Funding
References
- Tonguç, M.; Elkoyunu, R.; Erbaş, S.; Karakurt, Y. Changes in Seed Reserve Composition during Germination and Initial Seedling Development of Safflower (Carthamus Tinctorius L.). Turkish J. Biol. 2012, 36, 107–112. doi: 10.3906/biy-1012-164.
- Kulkarni, S. D.; Tilak, J. C.; Acharya, R.; Rajurkar, N. S.; Devasagayam, T. P. A.; Reddy, A. V. R. Evaluation of the Antioxidant Activity of Wheatgrass (Triticum Aestivum L.) As a Function of Growth under Different Conditions. Phyther. Res. 2006, 227, 218–227. DOI: 10.1002/ptr.1838.
- Agrawal, A.; Gupta, E.; Chaturvedi, R. Determination of Minerals and Antioxidant Activities at Different Levels of Jointing Stage in Juice of Wheat Grass -The Green Wonder. Int. J. Pure Appl. Biosci. 2015, 3, 311–316.
- Padalia, S.; Drabu, S.; Raheja, I.; Gupta, A.; Dhamija, M. Multitude Potential of Wheatgrass Juice (Green Blood): An Overview. Chronicles Young Sci. 2010, 1, 23–28.
- Falcinelli, B.; Benincasa, P.; Calzuola, I.; Gigliarelli, L.; Lutts, S.; Marsili, V. Phenolic Content and Antioxidant Activity in Raw and Denatured Aqueous Extracts from Sprouts and Wheatgrass of Einkorn and Emmer Obtained under Salinity. Molecules. 2017, 22, 1–13. DOI: 10.3390/molecules22122132.
- Chon, S.-U.;. Total Polyphenols and Bioactivity of Seeds and Sprouts in Several Legumes. Curr. Pharm. Des. 2013, 19, 6112–6124. doi: 10.2174/1381612811319340005.
- Singhal, A.; Kumari, S.; Raghavendra, R. S.; Kumar, S.; Rajendran, N. Wheatgrass: An Alternative Household Nutritional Food Security. Int. Res. J. Pharm. 2012, 3, 246–250.
- Benincasa, P.; Galieni, A.; Anna, C. M.; Pace, R.; Guiducci, M.; Pisante, M.; Stagnari, F. Phenolic Compounds in Grains, Sprouts and Wheatgrass of Hulled and Non-Hulled Wheat Species. J. Sci. Food Agric. 2015, 95, 1795–1803. DOI: 10.1002/jsfa.6877.
- Xu, J. G.; Tian, C. R.; Hu, Q. P.; Luo, J. Y.; Wang, X. D.; Tian, X. D. Dynamic Changes in Phenolic Compounds and Antioxidant Activity in Oats (Avena Nuda L.) During Steeping and Germination. J. Agric. Food Chem. 2009, 57, 10392–10398. DOI: 10.1021/jf902778j.
- Randhir, R.; Shetty, K. Developmental Stimulation of Total Phenolics and Related Antioxidant Activity in Light- and Dark-Germinated Corn by Natural Elicitors. Process Biochem. 2005, 40, 1721–1732. DOI: 10.1016/j.procbio.2004.06.064.
- Al-Karaki, G. N.;. Response of Wheat and Barley during Germination to Seed Osmopriming at Different Water Potential. J. Agron. Crop. Sci. 2008, 181, 229–235. doi: 10.1111/j.1439-037X.1998.tb00422.x.
- Kähkönen, M. P.; Hopia, A. I.; Vuorela, H. J.; Rauha, J.-P.; Pihlaja, K.; Kujala, T. S.; Heinonen, M. Antioxidant Activity of Plant Extracts Containing Phenolic Compounds. J. Agric. Food Chem. 1999, 47, 3954–3962. DOI: 10.1021/jf990146l.
- Wangcharoen, W.; Phimphilai, S. Chlorophyll and Total Phenolic Contents, Antioxidant Activities and Consumer Acceptance Test of Processed Grass Drinks. J. Food Sci. Technol. 2016, 53, 4135–4140. DOI: 10.1007/s13197-016-2380-z.
- Periera, D. M.; Valentao, P.; Periera, J. A.; Andrade, P. B. Phenolics: From Chemistry to Biology. Molecules. 2009, 2202–2211. DOI: 10.3390/molecules14062202.
- Boudet, A.-M.;. Evolution and Current Status of Research in Phenolic Compounds. Phytochemistry. 2007, 68, 2722–2735. DOI: 10.1016/j.phytochem.2007.06.012.
- Yoon, G. A.; Yeum, K. J.; Cho, Y. S.; Chen, C. Y. O.; Tang, G.; Blumberg, J. B.; Russell, R. M.; Yoon, S.; Lee-Kim, Y. C. Carotenoids and Total Phenolic Contents in Plant Foods Commonly Consumed in Korea. Nutr. Res. Pract. 2012, 6, 481–490. DOI: 10.4162/nrp.2012.6.6.481.
- Cai, Y.; Luo, Q.; Sun, M.; Corke, H. Antioxidant Activity and Phenolic Compounds of 112 Traditional Chinese Medicinal Plants Associated with Anticancer. Life Sci. 2004, 74, 2157–2184. DOI: 10.1016/j.lfs.2003.09.047.
- Djordjevic, T. M.; Šiler-Marinkovic, S. S.; Dimitrijevic, S. I. Antioxidant Activity and Total Phenolic Content in Some Cereals and Legumes. Int. J. Food Prop. 2011, 14, 175–184. DOI: 10.1080/10942910903160364.
- Mikulajová, A.; Takácsová, M.; Rapta, P.; Brindzová, L.; Zalibera, M.; Németh, K. Total Phenolic Contents and Antioxidant Capacities of Cereal and Pseudocereal Genotypes. J. Food Nutr. Res. 2007, 46, 150–157.
- Stanković, M. S.;. Total Phenolic Content, Flavonoid Concentration and Antioxidant Activity of Marrubium Peregrinum L. Extracts. Kragujev. J. Sci. 2011, 33, 63–72.
- Singleton, V. L.; Orthofer, R.; Lamuela-Raventós, R. Analysis of Total Phenols and Other Oxidation Substrates and Antioxidants by Means of Folin-Ciocalteu Reagent. Oxid. Antioxidants Part A. 1999, 299, 152–178. doi: 10.1016/S0076-6879(99)99017-1.
- Cuendet, M.; Hostettmann, K.; Potterat, O.; Dyatmiko, W. Iridoid Glucosides with Free Radical Scavenging Properties from Fagraea Blumei. Helv. Chim. Acta. 1997, 80, 1144–1152. DOI: 10.1002/hlca.19970800411.
- Urias-Lugo, D. A.; Heredia, J. B.; Serna-Saldivar, S. O.; Muy-Rangel, M. D.; Valdez-Torres, J. B. Total Phenolics, Total Anthocyanins and Antioxidant Capacity of Native and Elite Blue Maize Hybrids (Zea Mays L.). CyTA - J. Food. 2015, 13, 336–339. DOI: 10.1080/19476337.2014.980324.
- Fardet, A.; Rock, E.; Re, C. Is the in Vitro Antioxidant Potential of Whole-Grain Cereals and Cereal Products Well Reflected in Vivo? J. Cereal. Sci. 2008, 48, 258–276. doi: 10.1016/j.jcs.2008.01.002.
- Abozed, S. S.; El-Kalyoubi, M.; Abdelrashid, A.; Salama, M. F. Total Phenolic Contents and Antioxidant Activities of Various Solvent Extracts from Whole Wheat and Bran. Ann. Agric. Sci. 2014, 59, 63–67. doi: 10.1016/j.aoas.2014.06.009.
- Šimić, G.; Horvat, D.; Dvojković, K.; Abičić, I. Evaluation of Total Phenolic Content and Antioxidant Activity of Malting and Hulless Barley Grain and Malt Extracts. Chech J. Food Sci. 2017, 35, 73–78. doi: 10.17221/144/2016-CJFS.
- Zilic, S.; Basic, Z.; Sukalovic, V. H.-T.; Maksimovic, V.; Jankovic, M.; Filipovic, M. Can the Sprouting Process Applied to Wheat Improve the Contents of Vitamins and Phenolic Compounds and Antioxidant Capacity of the Flour? Int. J. Food Sci. Technol. 2014, 49, 1040–1047. DOI: 10.1111/ijfs.12397.
- Akcan Kardas, T.; Durucasu, I. A New Analytical Method for the Determination of Phenolic Compounds and Their Antioxidant Activities in Different Wheat Grass Varieties. Ekoloji. 2014, 23, 73–80. DOI: 10.5053/ekoloji.
- Lee, J. H.; Park, M. J.; Ryu, H. W.; Yuk, H. J.; Choi, S.; Lee, K.; Kim, S.; Seo, W. D. Elucidation of Phenolic Antioxidants in Barley Seedlings (Hordeum Vulgare L.) By UPLC-PDA-ESI/MS and Screening for Their Contents at Different Harvest Times. J. Funct. Foods. 2016, 26, 667–680. DOI: 10.1016/j.jff.2016.08.034.
- Kohler, G. O.;. The Effect of Stage of Growth on the Chemistry of the Grasses. J. Biol. Chem. 1944, 152, 215–223.
- Shahidi, F.; Yeo, J. Insoluble-Bound Phenolics in Food. Molecules. 2016, 21, 1216–1237. DOI: 10.3390/molecules21091216.
- Mattila, P.; Kumpulainen, J. Determination of Free and Total Phenolic Acids in Plant-Derived Foods by HPLC with Diode-Array Detection. J. Agric. Food Chem. 2002, 50, 3660–3667. DOI: 10.1021/jf020028p.
- Koyu, H.; Haznedaroglu, M. Z. Investigation of Impact of Storage Conditions on Hypericum Perforatum L. Dried Total Extract. J. Food Drug Anal. 2015, 23, 545–551. doi: 10.1016/j.jfda.2015.04.002.
- O’Keeffe, K.;. Growth & Development. In Procrop Maize Growth and Development; Edwards, J., Ed. ; NSW Department of Primary Industries: New South Waes, 2009; pp 9–14. ISBN 978 0 7347 1955 3.
- Bowden, P.; Ferguson, N. Germination and Emergence. In Procrop Wheat Growth and Development; White, J., Edwards, J., Eds.; NSW Department of Primary Industries: New South Waes, 2008. pp 9-26.
- Casada, M. E.;. Moisture Adsorption Characteristics of Wheat and Barley. Trans. Am. Soc. Agric. Eng. 2002, 45, 361–368.
- Bubelova, Z.; Sumczynski, D.; Salek, R. N. Effect of Cooking and Germination on Antioxidant Activity, Total Polyphenols and Flavonoids, Fibre Content, and Digestibility of Lentils (Lens Culinaris L.). J. Food Process. Preserv. 2017, e13388. DOI: 10.1111/jfpp.13388.
- Alverez-Jubeto, L.; Wijngaard, H.; Arendt, E. K.; Gallagher, E. Polyphenol Composition and in Vitro Antioxidant Activity of Amaranth, Quinoa, Buckwheat and Wheat as Affected by Sprouting and Baking. Food Chem. 2010, 119, 770–778. DOI: 10.1016/j.foodchem.2009.07.032.
- Pajak, P.; Socha, R.; Galkowska, D.; Roznowski, J.; Fortuna, T. Phenolic Profile and Antioxidant Activity in Selected Seeds and Sprouts. Food Chem. 2014, 143, 300–306. DOI: 10.1016/j.foodchem.2013.07.064.
- Aboras, N. E.; Canadanovic-Brunet, J.; Cetkovic, G.; Saponjac, V. T.; Vulic, J.; Ilic, N. Powdered Barley Sprouts: Composition, Functionality and Polyphenol Digestibility. Int. J. Food Sci. Technol. 2016, 52, 231–238. DOI: 10.1111/ijfs.13274.
- Tian, B.; Xie, B.; Shi, J.; Wu, J.; Cai, Y.; Xu, T.; Xue, S.; Deng, Q. Physiochemical Changes of Oat Seeds during Germination. Food Chem. 2010, 119(3), 1195–1200. DOI: 10.1016/j.foodchem.2009.08.035.
- Kapkum, N.; Phimphilai, S.; Srichairatanakool, S.; Varith, J. Reduction in Antioxidant Properties Lost during Processing of a Powdered Beverage from Young Organic Rice Plants. Asian J Food Ag-Ind 2011, 4(6), 388-398.
- Lutz, M.; Hernández, J.; Henríquez, C. Phenolic Content and Antioxidant Capacity in Fresh and Dry Fruits and Vegetables Grown in Chile. CYTA - J. Food. 2015, 13, 541–547. DOI: 10.1080/19476337.2015.1012743.
- Dvořáková, M.; Guido, L. F.; Dostálek, P.; Skulilová, Z.; Moreira, M. M.; Barros, A. A. Antioxidant Properties of Free, Soluble Ester and Insoluble-Bound Phenolic Compounds in Different Barley Varieties and Corresponding Malts. J. Inst. Brew. 2008, 114, 27–33. DOI: 10.1002/j.2050-0416.2008.tb00302.x.
- Yang, F.; Basu, T. K.; Ooraikul, B. Studies on Germination Conditions and Antioxidant Contents of Wheat Grain. Int. J. Food Sci. Nutr. 2001, 52, 319–330. DOI: 10.1080/09637480120057567.